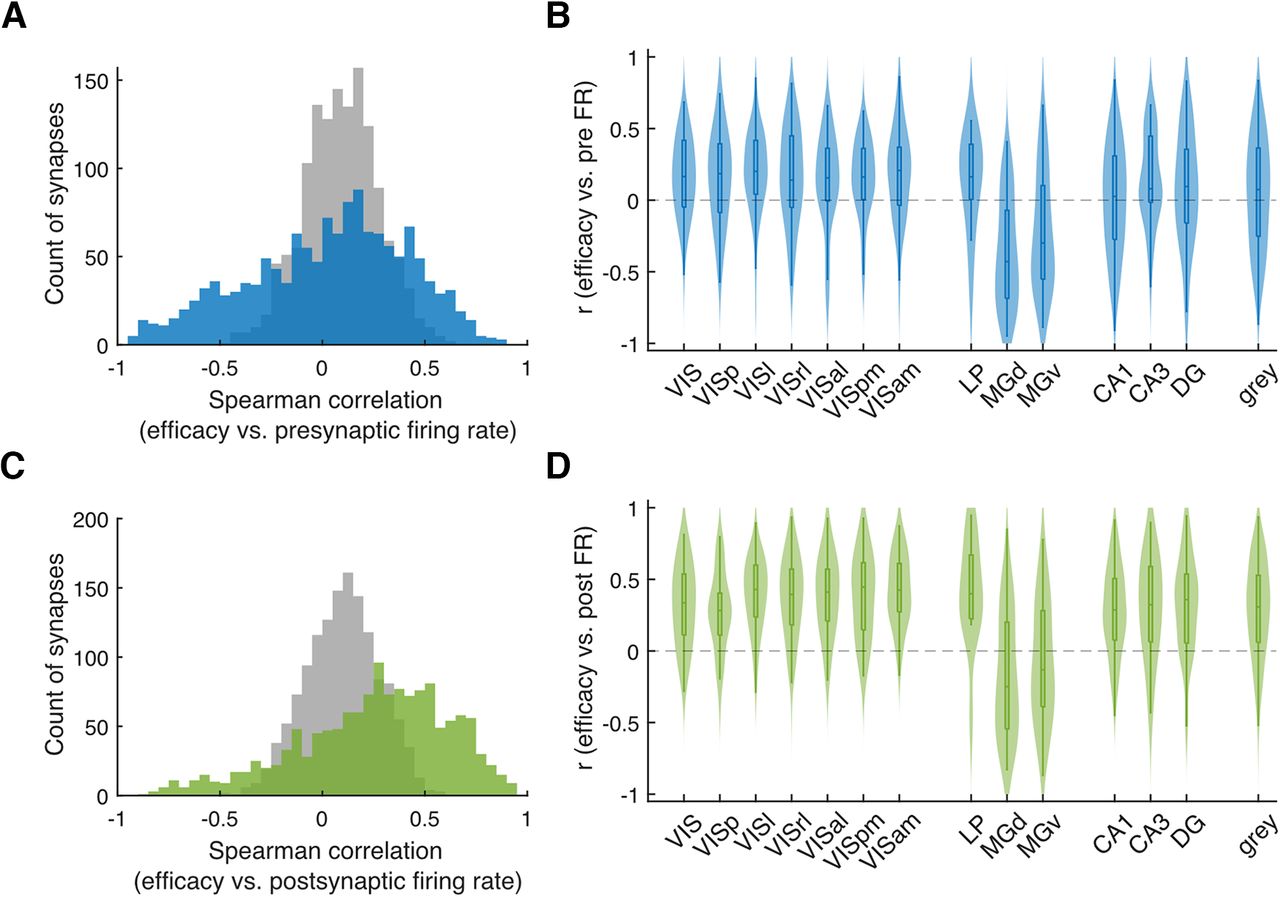
Figure 3.
Correlation between the fluctuation in synaptic efficacy and that in the presynaptic and postsynaptic firing rate. A, C, Histogram of the Spearman's correlation between the fluctuations in synaptic efficacy and the natural fluctuations in the presynaptic firing rate (A, blue) or the postsynaptic firing rate (C, green) and the corresponding distributions generated using postsynaptic spikes jittered on a uniform interval of [−1,1] s (gray). B, D, Violin plot of the Spearman's correlation for presynaptic firing rate (B) or postsynaptic firing rate (D) for each area. Only areas with ≥10 efferent synapses are shown.


