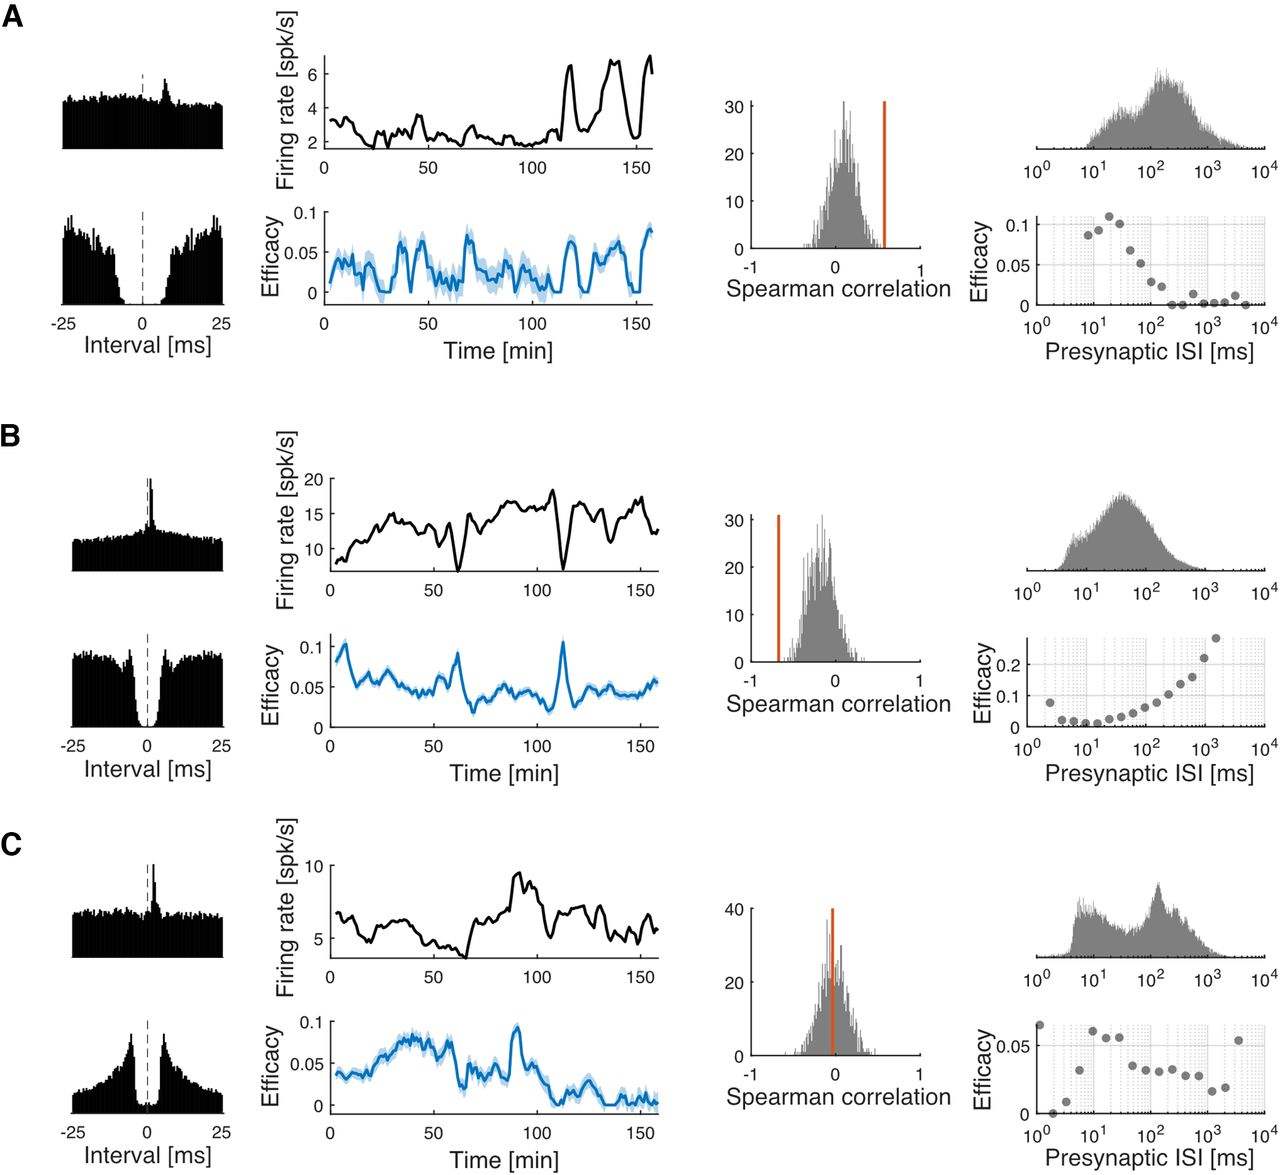
Three kinds of relationships between the fluctuations in synaptic efficacy and presynaptic firing rate. A, An example putative synapse (DG–CA3), where there is a positive correlation between the synaptic efficacy and the presynaptic firing rate. B, An example putative synapse (APN–APN), where there is a negative correlation between the synaptic efficacy and the presynaptic firing rate. C, An example putative synapse (CA1–VIAam), where the relationship between the synaptic efficacy and the presynaptic firing rate is not clear. First column (A–C), CCG (top) and autocorrelogram (ACG, bottom). Second column (A–C), The fluctuations in the presynaptic firing rate (top) and the synaptic efficacy (bottom). The shaded area represents 1 SD. Third column (A–C), The distribution of Spearman's correlation from surrogate, shuffled data (gray, 1000 samples shown for visualization). The red bar shows the observed correlation from the original data. Note that in C the observed correlation is close to zero. This does not mean the fluctuation in synaptic efficacy is random, it just indicates that the fluctuation in synaptic efficacy is not correlated with presynaptic firing rate. Fourth column, The distribution of the presynaptic ISI (top) and the efficacy estimated for presynaptic spikes with different ISIs using the extended GLM.


