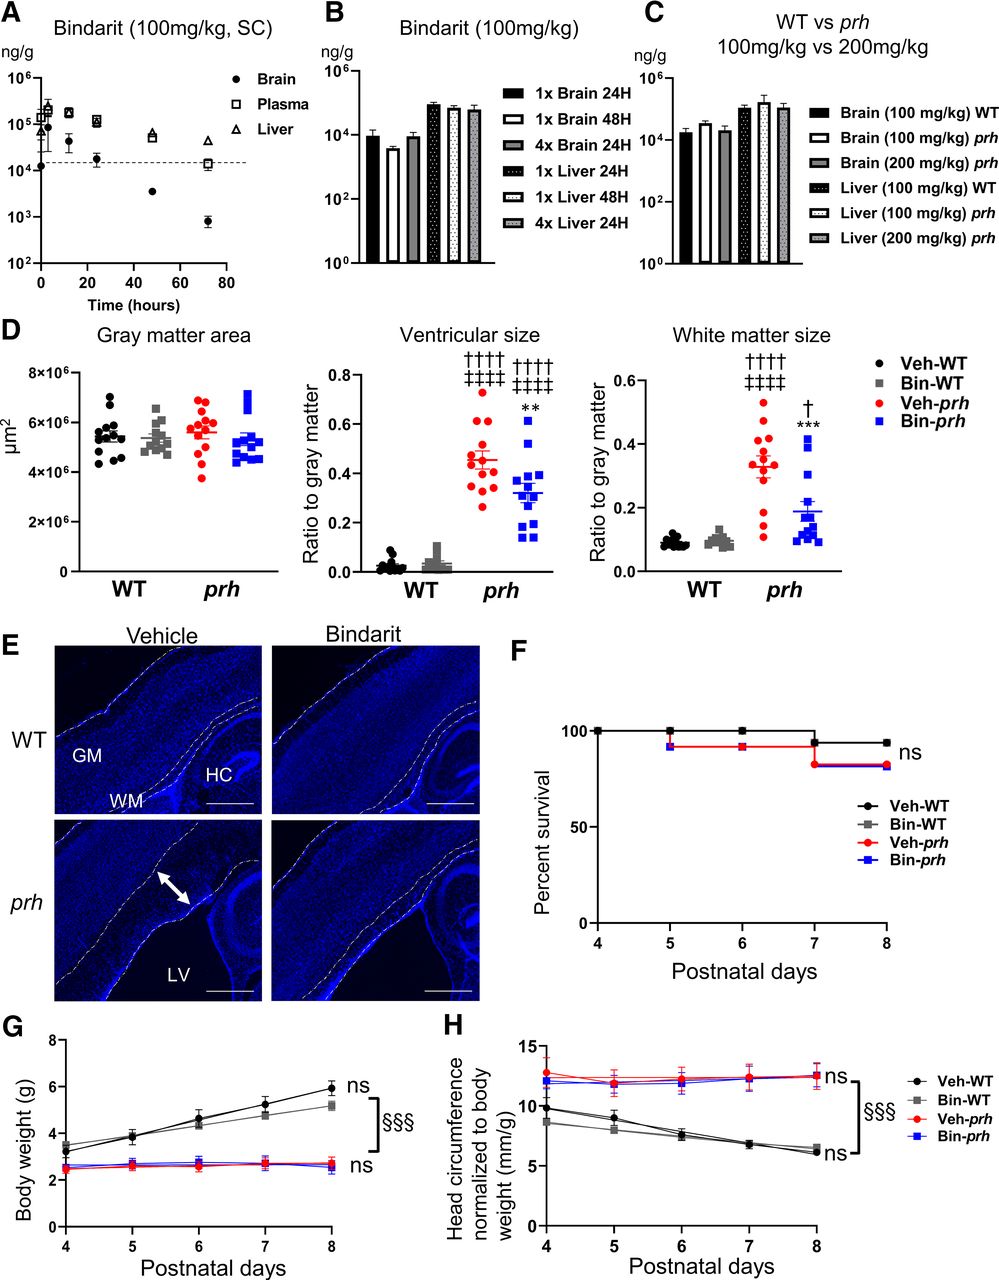
Pharmacokinetics of bindarit and its effect on ventricular and white matter enlargement. A, Tissue concentration of bindarit in the brain, plasma, and liver at 0, 3, 12, 24, 36, and 72 h after the subcutaneous injection. Dotted line indicates 16,620 ng/g as effective tissue concentration. B, Tissue concentration of bindarit in brain and liver, 24 or 48 h after the single, once-a-day injection (1×) and once-a-day injection for four consecutive days (4×). C, Tissue concentration of bindarit in brain and liver 24 h after the single injection of 100 or 200 mg/kg in either WT or prh genotype. D, Tissue area size of gray matter (total cerebral cortical area excluding white matter), ventricular size relative to gray matter [††††p < 0.0001 to vehicle-treated (veh-) WT, ‡‡‡‡p < 0.0001 to bindarit-treated (bin)-WT, **p = 0.0083 to veh-prh], and white matter size relative to gray matter (†p = 0.0274, ††††p < 0.0001 to veh-WT, ‡‡‡‡p < 0.0001 to bin-WT, ***p = 0.0008 to veh-prh) measured from DAPI-stained low power field pictures (two-way ANOVA followed by Tukey's test, n = 13 in each group). E, Low power field pictures of DAPI-stained animals. Double-headed arrow in veh-prh shows the swollen white matter (scale bars: 500 μm). GM, gray matter; WM, white matter; HC, hippocampus. F, Kaplan–Meier survival plot shows the survival rate of veh-WT and bin-WT are 93%, and veh-prh and bin-prh are 87.5% at P8 [nonsignificant (ns) in 4 groups]. G, Body weight analysis demonstrates that prh exhibit less weight growth compared with WT (§§§p < 0.001, prh vs WT) and no significant (ns) difference by treatment (repeated measures two-way ANOVA followed by Tukey's test, n = 8–10). H, Head circumference as a sum of the three directions (top-bottom, left-right, rostral-caudal, mm) normalized to body weight gradually declines in WT as they grow, but it stays relatively large in prh (§§§p < 0.001, prh vs WT), with no significant (ns) difference by drug treatment (repeated measures two-way ANOVA followed by Tukey's test, n = 8–12).


