Neuromedin B-Expressing Neurons in the Retrotrapezoid Nucleus Regulate Respiratory Homeostasis and Promote Stable Breathing in Adult Mice
- George M.P.R. Souza,
- Daniel S. Stornetta,
- Yingtang Shi,
- Eunu Lim,
- Faye E. Berry,
- Douglas A. Bayliss, and
- Stephen B.G. Abbott
-
Author contributions: G.M.P.R.S., D.A.B., and S.B.G.A. designed research; G.M.P.R.S., D.S.S., E.L., F.E.B., and S.B.G.A. performed research; G.M.P.R.S., D.S.S., E.L., F.E.B., and S.B.G.A. analyzed data; G.M.P.R.S. and S.B.G.A. wrote the first draft of the paper; G.M.P.R.S. and S.B.G.A. wrote the paper; D.S.S. and D.A.B. edited the paper; Y.S. and D.A.B. contributed unpublished reagents/analytic tools.
Abstract
Respiratory chemoreceptor activity encoding arterial Pco2 and Po2 is a critical determinant of ventilation. Currently, the relative importance of several putative chemoreceptor mechanisms for maintaining eupneic breathing and respiratory homeostasis is debated. Transcriptomic and anatomic evidence suggests that bombesin-related peptide Neuromedin-B (Nmb) expression identifies chemoreceptor neurons in the retrotrapezoid nucleus (RTN) that mediate the hypercapnic ventilatory response, but functional support is missing. In this study, we generated a transgenic Nmb-Cre mouse and used Cre-dependent cell ablation and optogenetics to test the hypothesis that RTNNmb neurons are necessary for the CO2-dependent drive to breathe in adult male and female mice. Selective ablation of ∼95% of RTNNmb neurons causes compensated respiratory acidosis because of alveolar hypoventilation, as well as profound breathing instability and respiratory-related sleep disruption. Following RTNNmb lesion, mice were hypoxemic at rest and were prone to severe apneas during hyperoxia, suggesting that oxygen-sensitive mechanisms, presumably the peripheral chemoreceptors, compensate for the loss of RTNNmb neurons. Interestingly, ventilation following RTNNmb-lesion was unresponsive to hypercapnia, but behavioral responses to CO2 (freezing and avoidance) and the hypoxia ventilatory response were preserved. Neuroanatomical mapping shows that RTNNmb neurons are highly collateralized and innervate the respiratory-related centers in the pons and medulla with a strong ipsilateral preference. Together, this evidence suggests that RTNNmb neurons are dedicated to the respiratory effects of arterial Pco2/pH and maintain respiratory homeostasis in intact conditions and suggest that malfunction of these neurons could underlie the etiology of certain forms of sleep-disordered breathing in humans.
SIGNIFICANCE STATEMENT Respiratory chemoreceptors stimulate neural respiratory motor output to regulate arterial Pco2 and Po2, thereby maintaining optimal gas exchange. Neurons in the retrotrapezoid nucleus (RTN) that express the bombesin-related peptide Neuromedin-B are proposed to be important in this process, but functional evidence has not been established. Here, we developed a transgenic mouse model and demonstrated that RTN neurons are fundamental for respiratory homeostasis and mediate the stimulatory effects of CO2 on breathing. Our functional and anatomic data indicate that Nmb-expressing RTN neurons are an integral component of the neural mechanisms that mediate CO2-dependent drive to breathe and maintain alveolar ventilation. This work highlights the importance of the interdependent and dynamic integration of CO2- and O2-sensing mechanisms in respiratory homeostasis of mammals.
- blood gas homeostasis
- carotid body
- central chemoreceptor
- periodic breathing
- sleep homeostasis sleep-disordered breathing
Introduction
Breathing is a highly coordinated motor activity that serves the essential function of maintaining blood gas homeostasis (Del Negro et al., 2018). In mammals, central and peripheral respiratory chemoreceptors regulate lung ventilation in relation to arterial Pco2 and Po2 (Nattie and Li, 2012; Del Negro et al., 2018; Guyenet and Bayliss, 2022). Depending on species and approach, central respiratory chemoreceptors that encode CO2 and H+ generate between 50% and 70% of resting ventilation derived from arterial Pco2 (Paco2) at baseline (Blain et al., 2009; Smith et al., 2010; Guyenet et al., 2018). Although several cell types have been suggested to function as central respiratory chemoreceptors, the hierarchical and functional interdependence of these chemoreceptors for eupneic breathing and CO2 homeostasis is still a matter of debate (Nattie and Li, 2012; Guyenet et al., 2019; Gourine and Dale, 2022).
A prominent group of central respiratory chemoreceptors are retrotrapezoid nucleus (RTN) neurons. RTN neurons are excitatory, CO2-activated neurons located in the parafacial region derived from a developmental lineage that includes Egr-2, Lbx1, Atoh-1, and importantly, Phox2b as key markers (Guyenet et al., 2019; Guyenet and Bayliss, 2022). Polyalanine expansion mutations in Phox2b are associated with congenital central hypoventilation syndrome (CCHS) in humans, a rare genetic condition characterized by hypoventilation and apnea during sleep (Amiel et al., 2003; Weese-Mayer et al., 2010). Developmental studies modeling CCHS-like mutations in mice show that an absence of RTN neurons might explain the deficits in the hypercapnic ventilatory reflex (HCVR) in humans with CCHS (Dubreuil et al., 2009; Ramanantsoa et al., 2011; Ruffault et al., 2015). However, resting breathing and the HCVR in mice with CCHS-like mutations partly recover during development, raising important questions of the role of the RTN in adults. Experimental studies in unanesthetized adult rats provide varied evidence. For example, acute and reversible optogenetic inhibition of a mixed population of RTN and nearby C1 neurons reduces breathing by ∼40% during waking and non-rapid eye movement sleep (NREMS) (Burke et al., 2015). Similarly, ablation of RTN neurons using saporin, a ribosomal toxin, targeted to tachykinin receptor 1-expressing cells in the parafacial region causes alveolar hypoventilation and blunts the HCVR (Takakura et al., 2014; Souza et al., 2018). However, others have shown that chemogenetic inhibition of RTN neurons produces a negligible effect on resting ventilation and does not attenuate diaphragmatic activity during hypercapnia (Marina et al., 2010). Thus, while there is a general agreement that RTN neurons contribute to the increase in pulmonary ventilation in response to CO2, it remains uncertain whether these neurons contribute to eupneic (i.e., resting) ventilation in adults.
In rodents, putative central chemoreceptor neurons in the RTN can be identified by the expression of a constellation of markers, including expression of Phox2b, vesicular glutamate transporter 2 (Slc17a6), tachykinin receptor 1 (TACR1), galanin, and more recently neuromedin B (Nmb), as well as the absence of TH and ChAT (Guyenet et al., 2019; Guyenet and Bayliss, 2022). Among these identifiers, Nmb, first described by Li et al. (2016), is universally expressed in putative central chemoreceptor neurons of the RTN (Shi et al., 2017), although evidence linking these neurons with respiratory homeostasis is lacking. Importantly, between 80% and 90% of Nmb neurons in the parafacial region express GPR4 and TASK2 (Shi et al., 2017), which are acid-sensitive proteins that are critical for the HCVR (Gestreau et al., 2010; Kumar et al., 2015). Thus, we hypothesized that Nmb expression identifies central chemoreceptor neurons in the RTN that contribute to respiratory homeostasis. We tested this hypothesis by generating a transgenic Nmb-Cre knock-in mouse in which we used genetically targeted cell ablation and optogenetic techniques to determine the contribution of the RTNNmb neurons to the control of breathing in adult mice.
Materials and Methods
Animals
All experiments were conducted in accordance with the National Institutes of Health's Guide for the care and use of laboratory animals and approved by the University of Virginia Animal Care and Use Committee (protocol #4312). We used transgenic NmbCre/+ male and female mice. These mice were generated by homologous recombination in embryonic stem (ES) cells to introduce an IRES-Cre cassette into the Nmb locus by Ingenious Targeting Laboratory. In short, an 11.9 kb genomic DNA was extracted from a positively identified C57BL/6 BAC clone (RP23-425N1) and inserted into a ∼2.4 kb pSP72 (Promega) backbone vector. The inserted region included homology arms 5′ (3.2 kb) and 3′ (8.5 kb) relative to the knock-in cassette. The knock-in cassette containing IRES-Cre-pA and FRT-flanked neomycin resistance (Neo) cassette was inserted immediately downstream of the TAG stop codon in exon 3 of the mouse Nmb gene. The targeting vector was confirmed by restriction analysis and sequencing after each modification step. The targeting vector was linearized (NotI) and transfected by electroporation of FLP C57BL/6 (BF1) ES cells, selected with G418 antibiotic, and surviving clones were expanded for PCR analysis to identify recombinant ES clones and verify FLP-mediated excision of the Neo cassette. Correctly targeted iTL BF1 (C57BL/6 FLP) ES cells were microinjected into BALB/c blastocysts, and resulting chimeric mice were mated to C57BL/6N WT mice to generate germline mice. PCR products from tail DNA were sequenced to verify proper targeting and a separate PCR confirmed absence of FLP recombinase. The Nmb-Cre mouse line was maintained in house by crossing with C57BL/6J mice acquired from The Jackson Laboratory (stock #000664), and male and female WT control (Nmb+/+) and heterozygous Cre-positive littermates (NmbCre/+) were used for experiments.
For anatomic studies, we used NmbCre/+::Jx99 mice generated by crossing NmbCre/+ mice with JX99 (Phox2b::eGFP BAC transgenic) mice on a mixed genetic background (Lazarenko et al., 2009). For retrograde tracing studies, we used R26-loxSTOPlox-L10-GFP Cre-reporter mice acquired from The Jackson Laboratory (strain #024750, RRID:IMSR_JAX:024750) and bred as heterozygotes with C57BL/6J mice in house. Animals were group-housed wherever possible and maintained under a 12:12 light: dark cycle (lights on at 700 h) at 23°C-24°C with water and food provided ad libitum.
Viral vectors
For the mouse model validation, we tested the selectivity of the viral vector transduction using microinjection of Cre-dependent vector containing the fluorophore mCherry (AAV2-hSyn-DIO-hM3D(Gq)-mCherry, Addgene plasmid 44361, titer: 8.0 × 10¹¹ GC/ml). To promote RTNNmb ablation, we used a Cre-dependent vector (AAV5-FLEX-taCasp3-TEVp, titer: 4.2 × 10¹² GC/ml, University of North Carolina Vector Core). This vector expresses the apoptotic enzyme caspase-3 (taCasp3) and its activation protease, the Tobacco Etch Virus protease (TEVp) in Cre-expressing cells. To identify efferent connections from RTNNmb neurons, we used a vector containing the fluorophore mScarlet (AAV8-nEF-Con/Foff 2.0-ChRmine-oScarlet, titer for injection: 1.2 × 10¹² GC/ml, Addgene plasmid 137161) (Fenno et al., 2020). For retrograde tracing, we used a retrograde vector expressing Cre-recombinase (AAVrg-hSyn-Cre-WPRE-hGH, Addgene plasmid 105553, titer: 2.39 × 10¹³ GC/ml). For optogenetic inhibition of RTNNmb neurons, we used eArch3.0 (AAV2-EF1α-DIO-eArch3.0-eYFP, UNC Vector Core, titer for injection: 4.0 × 10¹² GC/ml).
Animal preparation and brainstem microinjections
Mice of both sexes (age: 8-12 weeks) were anesthetized with a mixture of ketamine (100 mg/kg) and dexmedetomidine (0.2 mg/kg) given intraperitoneally. The depth of anesthesia was assessed by an absence of the hind-paw withdrawal reflex. Additional anesthetic was administered as necessary (20% of the original dose, i.p.). The following procedures were performed under aseptic conditions. Following skin shaving and disinfection, the skin overlying the left mandible was cut to reveal a short segment of the mandibular branch of the facial nerve. The mice were then placed on a stereotaxic apparatus adapted for mouse CNS microinjections (ear bar adaptor, model EB-5N, Narashige Scientific Instrument Lab; bite bar, model 926 mouse adaptor set at −3 mm below the interaural line for a flat skull, David Kopf Instruments). Body temperature maintained at 37°C with a servo-controlled heating pad and a blanket. A small hole, 1.5 mm in diameter, was drilled bilaterally into the occipital plate caudal to the parieto-occipital suture. The AAV was loaded into a 1.2 mm internal diameter glass pipette broken to a 25 µm tip (external diameter). The facial nerve was stimulated (0.1 ms, 100-300 µA, 1 Hz) to evoke antidromic field potentials within the facial motor nucleus as previously described (Abbott et al., 2013). These field potentials were used to map the facial motor nucleus and help identify the location of the RTN neurons, which reside 100-200 µm below this nucleus.
For the ablation of RTNNmb neurons, microinjections of AAV5-FLEX-taCasp3-TEVp, 60-80 nl of virus were delivered bilaterally at three sites spanning the rostro-caudal length of the facial nucleus (1400 µm lateral, 100 µm below the bottom of the facial nucleus). For tracing and selectivity experiments, two 50 nl injections of virus (AAV8-nEF-Con/Foff 2.0-ChRmine-oScarlet or AAV2-EF1α-DIO-eArch3.0-eYFP) were placed underneath the facial nucleus. For retrograde tracing studies, <10-20 nl of virus AAVrg-hSyn-Cre was placed at the following coordinates relative to λ: pre-Bötzinger complex (PreBötC) at −2.7 mm caudal, 1.25 mm lateral, 4.5 mm ventral of brain surface; and lateral parabrachial nucleus (LPB) at −0.6 mm caudal, 2.1 mm lateral, 3.5 mm ventral of brain surface. The caudal ventral respiratory group (cVRG) and nucleus of the solitary tract (NTS) were accessed via an atlanto-occipital window with the nose of the mouse 5 mm below a flat-skull position. Coordinates relative to obex were as follows: cVRG at 0.0 mm caudal, 1.2 mm lateral, 2.5 mm ventral of brain surface; and NTS at 0.0 mm rostral, 0.1 mm lateral, 0.25 mm ventral of brain surface. For the optogenetic loss-of-function experiments, a vector encoding eArch3.0 (AAV2-EF1α-DIO-eArch3.0-eYFP) was microinjected in the left RTN in three sites spanning the rostro-caudal length of the facial nucleus (1400 µm lateral to midline, 100 µm below the bottom of the facial nucleus) and a vector encoding taCasp3 (AAV5-FLEX-taCasp3-TEVp) was injected in the contralateral RTN in the same fashion. This experimental approach produces unilateral ablation of RTNNmb neurons allowing a more pronounced effect of the optogenetic inhibition of the contralateral side on the respiratory variables.
In all mice, incisions were closed with sutures and surgical cyanoacrylate adhesive. Mice received postoperative boluses of atipamezole (α2-adrenergic antagonist, 2 mg/kg, s.c.) and ketoprofen (4 mg/kg, s.c.) and were then placed in a clean warmed home cage (37°C) until consciousness was regained before being returned to the vivarium. Ketoprofen was administered immediately after surgery and at 24, 48, and 72 h following surgery. Mice were housed in the vivarium for >4 weeks before experimentation to allow sufficient expression of the transgene and/or caspase-mediated cell death.
Arterial blood gases
Arterial blood gases were assessed during quiet breathing in unrestrained, conscious mice by blood withdrawal from an arterial catheter. Two days before the experiment, mice were anesthetized with isoflurane (2.5% in normoxia) and a polyethylene catheter (PE-8 connected to a PE-50) was inserted in the abdominal aorta through the femoral artery. The catheter was tunneled under the skin and the tip placed in the dorsal aspect of the neck. This procedure lasted 10-15 min, and ketoprofen was administered after the surgery (4 mg/kg, s.c). After 2 d, mice were placed in the plethysmography chamber, and blood samples were withdrawn (100 µl) and filled into hand-held i-STAT 1 configured with CG4+ cartridges for analysis. After this procedure, mice were deeply anesthetized with a mixture of ketamine (200 mg/kg) and dexmedetomidine (0.4 mg/kg) given intraperitoneally and transcardially perfused for histologic examination. Blood samples were obtained exclusively in male mice because of their larger size and greater success rate of the femoral arterial catheter implant surgery. The implant was performed via the femoral artery rather than the carotid artery to avoid disturbing carotid body function.
Metabolic activity
Mice were placed in a plexiglass chamber (15 cm × 10 cm × 10 cm) connected to a Comprehensive Lab Animal Monitoring System with a continuous flow of 0.5 L/min of normoxia (Columbus Instruments). Mice were provided ad libitum food and water and had access to enrichment, including nesting materials. Recording sessions occurred over a period of at least 4 d with data acquired in the final 24 h of recording used for analysis. Body temperature was measured in a subset of mice by introducing a rectal probe connected to a temperature monitor.
Unrestrained whole-body plethysmography and respiratory challenges
Breathing parameters were evaluated in conscious unrestrained mice using whole-body plethysmography (400 ml internal volume, Data Sciences International). Recording sessions were conducted between 0900 and 1600 h and lasted <6 h. Chambers were continuously flushed with dry room temperature air delivered by three computer-driven mass flow regulators controlling the flow of O2, N2, and CO2 (total flow: 1 L/min/chamber). An estimation of tidal volume (VT) was calibrated to air injected into the plethysmography chamber from a 1 ml syringe. The flow signal was amplified (×200) and acquired at 1 kHz in Spike2 software (version 9, CED).
In this study, mice were exposed to different respiratory challenges, such as hyperoxic hypercapnia, normoxic hypercapnia, and hypoxia to test specific hypotheses. For the hyperoxic hypercapnia protocol, the inspired fraction of oxygen (FIO2) increased initially from 0.21 to 0.60 and then stayed at this level during the whole protocol, similar to our previous studies (Souza et al., 2018). After 10 min of hyperoxia, the inspired fraction of CO2 (FICO2) increased from 0 to 0.03, followed by an increase of FICO2 to 0.06 and finally an increase in FICO2 to 0.09. Each of the three episodes of hypercapnia lasted 10 min and was followed by recovery in normoxia for at least 20 min. For the normoxic normocapnia, the same step changes in FICO2 described above were conducted in normoxia (FIO2 = 0.21). The hypoxia protocol was performed by exposing the mice to FIO2 = 0.1 for 10 min, following a period of normoxia recovery (reoxygenation) for 20 min before a second exposure to hypoxia FIO2 = 0.12 for 10 min.
Respiratory frequency (fR) and VT were analyzed from periods free of movement artifacts, and minute ventilation (VE) was calculated as a product of fR × VT. For the analysis of breathing during sleep, these variables were analyzed as the average of 5 segments of ∼40-120 s duration each. The variability of breathing was calculated as the percentage change in the duration of a given respiratory cycle in relation to its preceding one. The breathing variability index was calculated using at least 100 breaths for each condition. The apnea index was calculated as the proportion of breathing pauses that lasted >1 s among a given number of respiratory cycles (number of apneas/number of breaths). During hypercapnia and hypoxia, the analysis of VT, fR, and breathing variability was performed at 7-10 min from the beginning of the gas change. The ventilatory response to hyperoxia was determined from data between 30 and 60 s and also 7-10 min from the onset of the stimulus. To determine the sensitivity of the hypercapnic ventilatory response, linear regression was performed to determine the slope of the ventilatory response for each animal and condition. We removed three data points from group data in this analysis because the goodness of fit (R2) was <0.50.
Sleep-wake recordings
Mice were instrumented with six-pin connectors (Mill-Max Manufacturing) connected to three intracranial screws (left frontal, left and right parietal) for EEG recording and two braided stainless-steel wires (A-M Systems) implanted in the neck muscles for EMG recording. EEG (recorded between the left frontal and right parietal screw) and EMG recording were used to monitor sleep behavior. Immediately before the experiment, mice were briefly anesthetized with isoflurane (1.5% in normoxia) to connect the headset. The lead of the headset passed through the top of the plethysmography chamber and connected to the amplifier. EEG and EMG signals were amplified and bandpass filtered (bandpass filter, gain and sampling rate, EEG: 0.1-100 Hz, ×2000, 1 kHz; EMG: 300-1000 Hz, ×300, 1 kHz). All signals were acquired, processed, and analyzed using Spike2 software (CED).
A script available for Spike2 software (sleepscore version 7.05, CED) was used to determine sleep-wake behavior. Sleep-wake behavior was assessed over a continuous 4 h period between 1100 and 1600 h in plethysmography chambers. Sleep-wake state was determined for nonoverlapping 20 s epochs that were manually scored as wake, NREMS, or rapid eye-movement sleep (REMS) by a trained blinded observer based on EEG and EMG activity only. Breathing patterns were not used for scoring sleep-wake state. Micro-arousals, defined as periods of EEG desynchronization lasting between 3 and 9 s with or without EMG activation, were scored during a 10 min period of uninterrupted NREM sleep based on the above sleep-wake state scoring procedure.
Optogenetics
During microinjection surgery (described above), an optical fiber (200 µm core, 0.39 NA) was implanted 500 µm above the left microinjection site in the caudal aspect of the RTN. Postoperative care was conducted as described above. One month after the surgery, mice were briefly anesthetized with isoflurane (2.0% in normoxia) for the connection of the optical fiber with the laser source and the EEG/EMG headset. The animals were then placed in a plethysmography chamber, and the experiments were conducted 1 h after this procedure in freely behaving mice. We used a green laser (532 nm, 10 mW at the tip of the fiber, 5 s constant pulse) to activate eArch3.0 and, thus, inhibit RTNNmb neurons. eArch3.0 has been proven to be highly effective at inhibiting RTNNmb neuron activity in rats (Basting et al., 2015). Ventilatory variables (fR, VT, VE) were analyzed for 5-10 s before the laser stimulation for baseline and then during the 5 s laser stimulation trial. Data points in Figure 7 reflect the average of at least three trials per condition.
CO2-induced freezing behavior assay
Freezing behavior during exposure to CO2 was evaluated in an opaque white plastic chamber with a transparent roof (30 cm × 30 cm × 30 cm) to permit video recording from above. RTNNmb-lesion and control mice were exposed to two conditions on the same day in randomized order, with a period of at least 1 h between tests in each mouse. Mice were not habituated to the chamber before experiments but had been exposed to CO2 during previous plethysmography sessions. The two conditions tested were normoxia (FIO2 = 0.21, FICO2 = 0.00) and 10% hypercapnia (FIO2 = 0.21, FICO2 = 0.10), which were generated using mass flow controllers producing a total flow of 5 standard liters per minute (SLPM). CO2 concentrations were continuously monitored 10 cm above the chamber floor using a capnometer (Columbus Instruments) to ensure FICO2 during the hypercapnia condition was within a range of 9.5% and 10% at the time of placing the mouse in the test chamber and throughout the test, which lasted 5 min, after which mice were returned to their home-cage. The test chamber was cleaned with soapy water and dried between animals. Video data were collected using a consumer web camera attached to a fixed arm 60 cm centered above the chamber floor. Videos were manually calibrated, and no correction was made for lens distortion (Panadeiro et al., 2021). Rodent positions were extracted from videos using a custom data processing pipeline using the OpenCV library (Bradski, 2000). In brief, raw videos were cropped for content, a Gaussian blur was applied, the contents were filtered based on HSV-color values (leveraging the contrast between the black coats of the subject animals and the white plastic environment), and lastly the x and y coordinates of the centroid of the identified contour were used to represent the animal's position. Before analysis, videos and activity traces were manually reviewed for accuracy. Freezing time was determined as periods when the x-y coordinates of the centroid were static. Jumping was manually counted by a scorer blinded to condition.
CO2-avoidance assay
To assess CO2 avoidance, we built a custom apparatus consisting of two plastic chambers (30 cm × 30 cm × 30 cm) connected by a passageway (opening 5 cm × 5 cm) with a removable transparent lid. We delivered normoxia and high CO2 to either side of the apparatus at a flow rate of 5 L/min for each; we also had a scavenging system drawing ∼8-10 L/min from a small opening in the passageway to reduce gas mixing between chambers. CO2 concentration was monitored continuously 5 cm above the chamber floor in the CO2 chamber using a capnometer (Columbus Instruments), FICO2 values during the experiment in the CO2 chamber varied between 0.08 and 0.09. To achieve these values, we manually adjusted the concentration of CO2 administered to the chamber within a range of 12%-15%. Periodic measurements of CO2 in the normoxia-infused chamber indicate that CO2 concentrations were <1% in this chamber during experiments. RTNNmb-lesion and control mice were subject to a single exposure lasting 30 min after which mice were returned to their home-cage. Mice were initially placed in the normoxic chamber and allowed to explore the apparatus freely during the session. Mice were not habituated to the chamber before experiments but had been exposed to CO2 during previous plethysmography sessions. Separate groups of mice were used for the freezing assay and CO2 avoidance assay. Video data were collected in the same manner as for the CO2-induced freezing assay. Avoidance was assessed in 5 min epochs and expressed as time spent in the CO2 infused-chamber as a percentage of each epoch.
Perfusion and histology procedures
Mice were deeply anesthetized with a mixture of ketamine (100 mg/kg) and dexmedetomidine (0.2 mg/kg) given intraperitoneally and perfused transcardially with 4% PFA, pH 7.4 in 100 mm PB or pH-buffered 10% formalin, pH 7.0. Brains were removed and postfixed in the same fixative for 12-24 h at 4°C. Brains were sectioned (30-50 µm) on a vibratome (VT-1000S, Leica Biosystems), and sections were stored in cryoprotectant (30% ethylene glycol (v/v), 20% glycerol (v/v), 50% 100 mm PB, pH 7.4) at −20°C. Immunohistochemistry was performed on free-floating sections at room temperature unless noted otherwise. Serial 1-in-3 sections were rinsed, then blocked in a solution containing 100 mm Tris, 150 mm saline, 10% horse serum (v/v), 0.1% Triton-X (v/v), and incubated with primary antibodies for 60 min at room temperature then 4°C overnight. Sections were subsequently rinsed and then incubated with secondary antibodies for 60 min at room temperature and rinsed again before mounting on slides. Slides were covered with ProLong Gold anti-fade mounting medium (P36931, Fisher Scientific).
Multiplex FISH was performed using RNAscope (version 1 kit, Advanced Cell Diagnostics). Serial 1-in-3 sections were washed in RNase-free PBS, mounted on charged slides, dried overnight, and processed according to the manufacturer's instructions. When necessary, immunohistochemistry was performed on the slide after the RNAscope procedure using antibodies against mCherry or GFP along with their respective secondary antibodies. Immediately following the RNAscope procedure, sections were rinsed and then incubated in blocking solution for 10 min followed by incubation in primary at room temperature for 60 min, rinsed and incubated in secondary antibodies for 30 min, rinsed and then dried overnight before coverslipping. Slides were coverslipped with Prolong Gold antifade mountant with DAPI (P3693, Fisher Scientific). Primary and secondary antibodies and FISH probes used are detailed in Table 1.
Primary and secondary antibodies used for immunohistochemistry and probes used for ISHa
Microscopy, imaging, and cell mapping
Neuronal mapping was conducted using Neurolucida software (MBF Bioscience) with an AxioImager M2 microscope (Carl Zeiss Microscopy). Digital images were acquired in grayscale using a Hamamatsu C11440 Orca-Flash 4.0LT digital camera (Hamamatsu). Maximum projections of z-stack images were exported (8-bit) and further image modifications were performed in ImageJ/Fiji software (Schindelin et al., 2012). Representative images were pseudo-colored and optimized for presentation, brightness, and contrast were adjusted equally in all pixels of the image. Cell counting was conducted with a 1-in-3 series that was subsequently aligned to Paxinos and Franklin's fourth edition (Franklin and Paxinos, 2013). Expression of GFAP was assessed based on brightness of the immunofluorescence staining. The tissue was processed in parallel and imaged with a 20× objective using a camera exposure of 200 ms. Stack images were acquired (10 images with a spacing of 1 µm) and exported as a maximum projection image. Maximum projection images were batch processed in ImageJ/Fiji. In brief, images were manually cropped to the relevant anatomic region, a Gaussian blur was applied, the default auto thresholding was applied (Ridler and Calvard, 1978), despeckled, and then the default particle analysis tool was used to collect signal intensities. Data are expressed in arbitrary units.
To determine the density of axonal varicosities, we counted mScarlet-labeled axonal enlargements (1-3 µm in diameter) in a single area of interest defined anatomically in 3 cases using an oil-immersion 63× objective. The number of varicosities was first normalized to the area of tissue analyzed (range: 10,000-40,000 µm2) and this value (expressed in density/100 µm2) was normalized to the number of mScarlet-labeled neurons in each case. To evaluate retrograde-labeling of RTN neurons, we counted all Nmb, Gal, and GFP-labeled neurons within the ventrolateral medulla between −5.47 and −5.79 mm relative to bregma. GFP fluorescence in neurons and glia at the site of AAVrg-Cre injections was mapped as a representation of injection sites in Figure 10B.
Statistics
Data were tested for normality using the D'Agostino–Pearson, Shapiro–Wilk, or Kolmogorov–Smirnov test. Datasets that were considered normally distributed based on at least one of the above-mentioned tests were analyzed using parametric tests, and non-normal distributed samples were analyzed using nonparametric tests. For normally distributed data, Student's t test, one-way or two-way ANOVA, usually with repeated measures, followed by Tukey's, Bonferroni's, or Holm–Sidak's multiple comparisons test. The F and p values for every effect and interaction between effects are reported in the figure legends. The non-normally distributed data were analyzed using Kruskal–Wallis nonparametric test, followed by Dunn's post hoc multiple comparisons test or the Mann–Whitney test as specified for each dataset in the figure legends. Differences were considered significant when p < 0.05. In figures, data from each animal are presented in scatter plots, with summary data in text shown as mean ± SD unless noted otherwise.
Results
Validation of Nmb-Cre mouse and effect of selective-cell ablation on alveolar ventilation at rest
We generated a knock-in transgenic Nmb-Cre strain to selectively target RTN neurons in vivo (Fig. 1A, for details, see Materials and Methods). Injection of three distinct AAVs encoding Cre-dependent fluorescent reporters into the RTN of NmbCre/+ mice (n = 6) resulted in labeling restricted to RTNNmb neurons (96 ± 2% of labeled neurons contained Nmb mRNA), with transduction between 20% and 81% of all RTNNmb neurons (58 ± 10% of RTNNmb neurons expressed fluorescent reporter) (Fig. 1B–D). To ablate RTNNmb neurons, we bilaterally microinjected AAV5-FLEX-Casp3-TEVp in Cre+ (RTNNmb-lesion) and Cre– (control) littermates (Fig. 1E). Microinjections in Cre+ mice eliminated >95% of RTNNmb neurons while preserving nearby neuronal populations expressing dopamine-β-hydroxylase (Dbh) and TH-2 (Tph2) (Fig. 1F–H). We also observed no difference in DAPI staining or the expression of GFAP at the site of injection (intensity of GFAP in RTNNmb-lesion vs controls; 0.14 ± 0.02 vs 0.13 ± 0.01 a.u., n = 3, Mann–Whitney U = 4, p > 0.99, Fig. 1F,G), showing that the general structure of the RTN was preserved in RTNNmb-lesion mice. This histologic analysis shows that Casp3-TEVp-mediated cell ablation of RTNNmb neurons in NmbCre/+mice is both effective and highly selective.

Genetically targeted ablation of Neuromedin B (Nmb)-expressing neurons in the RTN produces alveolar hypoventilation. A, Gene targeting of Cre in Nmb allele. Nmb-Cre mice were generated by homologous recombination, inserting an IRES-Cre-pA cassette at the stop codon in exon 3 of the Nmb locus. B, Experimental setup for in vivo validation of the Nmb-Cre mice. C, Transverse section of mouse medulla showing Nmb-expressing RTN neurons (RTNNmb) labeled with a Cre-dependent mCherry. Viral transduction was confined to the RTN/parafacial region. Note the extensive dendrites at the caudal end of the facial nucleus. D, Same as in C, except at a higher magnification showing Nmb transcript in neurons that express mCherry. E, Experimental strategy for genetically targeted ablation of the RTNNmb neurons with AAV5-FLEX-taCasp3-TEVp. F, G, Coronal sections showing the ventral surface of the medulla of a control mouse in F, and RTNNmb-lesion mice in G, 6 weeks after injection of AAV5-FLEX-taCasp3-TEVp. Left panels, FISH for Nmb, Dbh, and Tph2. Note the absence of Nmb cells (yellow) in the RTN of RTNNmb-lesion mice, but similar expression of Dbh and Tph2 in the same section. Middle panels, Nmb and DAPI expression at high magnification. DAPI expression at the site of AAV injection was comparable between groups. Right, GFAP expression in marginal glia and Phox2b immunofluorescence. GFAP expression is similar between groups. H, Cell counts in control and RTNNmb-lesion mice. Unpaired t test with Welch's correction Nmb: t = 9.29, df = 8, p < 0.0001. Dbh: t = 1.02, df = 14, p = 0.32. Tph2: t = 1.13, df = 8, p = 0.29. I, Minute ventilation (VE). Unpaired t test, t = 5.31, df = 24. p < 0.0001. J, Arterial Pco2. Unpaired t test, t = 5.1, df = 11, p = 0.0003. K, Arterial blood bicarbonate. Unpaired t test, t = 2.860, df = 11, p = 0.0155. L, Arterial blood pH. Unpaired t test, t = 0.3557, df = 11, p = 0.7288. M, Metabolic CO2 production (VCO2). Unpaired t test, t = 1.00, df = 22. p = 0.33. N, Metabolic O2 consumption (VO2). Unpaired t test, t = 1.03, df = 19, p < 0.0001. p = 0.31. 7N, Facial motor nucleus; Gi, gigantocellular reticular nucleus; GiA, gigantocellular reticular nucleus, α part; IRt, intermediate reticular nucleus; LPGi, lateral paragigantocellular nucleus; RVLM, rostral ventrolateral medulla; Sp5, spinal trigeminal nucleus; sp5; spinal trigeminal tract; vsm, ventral surface of medulla. Scale bars: C, D, 250 µm; F, G, left to right, 250, 5, and 100 µm, respectively.
Having established a model to selectively eliminate RTNNmb neurons in adult mice, we first evaluated resting alveolar ventilation by whole-body plethysmography, and examined arterial blood gases and metabolic activity in unrestrained/freely behaving conditions. In RTNNmb-lesion mice, resting minute-ventilation (VE) was 31% lower than in control mice (Fig. 1I), owing to a lower VT with no difference in breathing frequency (fR). The lower VE resulted in an elevated arterial Pco2 (Paco2) in RTNNmb-lesion mice (∼10 mmHg, Fig. 1I,J), while arterial pH was similar between groups, apparently because of the retention of HCO3- (i.e., compensated respiratory acidosis, Fig. 1K,L). Notably, there was no statistical difference between VCO2 and VO2 between RTNNmb-lesion and control mice during the inactive phase (Fig. 1M,N). Alveolar ventilation, calculated using mean values for Paco2 and VCO2, was ∼35% lower during quiet breathing in RTNNmb-lesion mice, which is explained by the reduced VE. This demonstrates that RTNNmb neurons are required for optimal alveolar ventilation at rest. Importantly, body weight, body temperature, and locomotor activity were similar between RTNNmb-lesion mice and controls, and RTNNmb-lesion mice exhibited normal diurnal patterns in metabolic activity (Table 2), which indicates that these mice were in good physical condition.
Body weight, body temperature, locomotor activity, and VCO2 and VO2 in control and RTNNmb-lesion mice
Effect of RTNNmb ablation on breathing during sleep and sleep-wake patterns
The regulation of breathing varies with change in vigilance state, and this has many implications for sleep-related breathing disorders. During NREMS, VE is mostly maintained by the chemical drive arising from the chemoreceptors; and we therefore suspected that RTNNmb-lesion would exhibit deficits in VE mostly during NREMS sleep. For this, we assessed breathing during wakefulness, NREMS and REMS (Fig. 2A–C). We observed a significantly lower VT in RTNNmb-lesion compared with control, and no interaction between ablation of RTNNmb neurons and vigilance state, whereas there was no significant difference in fR regardless of the vigilance state. There was also a significant effect of ablation of RTNNmb neurons on VE, and no significant interaction between ablation of RTNNmb neurons and vigilance state. Post hoc analysis indicates that the deficits in VT and VE in RTNNmb-lesion are most evident during NREMS. Collectively, this analysis shows that, in normoxic conditions, ablation of RTNNmb neurons reduces VE across all vigilance states, but most profoundly during NREMS.

Complete RTNNmb-lesion produces hypoventilation and breathing instability. A, Effects of RTNNmb-lesion on VT across vigilance states. Two-way repeated-measures ANOVA, RTN-lesion versus state; interaction, F(2,34) = 3.17, p = 0.054. State, F(2,29) = 176.6, p < 0.0001. Lesion, F(1,17) = 7.5, p = 0.014. B, Effects of RTNNmb-lesion on fR across vigilance states. Two-way repeated-measures ANOVA, RTNNmb-lesion versus state; interaction, F(2,34) = 2.06, p = 0.14. State, F(2,34) = 55.9, p < 0.0001. Lesion, F(1,17) = 0.13, p = 0.72. C, Effects of RTNNmb-lesion on VE across vigilance states. Two-way repeated-measures ANOVA, RTNNmb-lesion versus state; interaction, F(2,34) = 3.2, p = 0.051. State, F(2,34) = 65.8, p < 0.0001. Lesion, F(1,17) = 4.7, p = 0.044. D, Representative recordings of EEG and breathing patterns (Flow) during NREM sleep in control and RTNNmb-lesion mice. Note periods of tachypnea followed by hypoventilation that occur in bouts. E, Representative Poincaré plots showing the breath duration (BBn) in relation to the subsequent breath duration (BBn+1) in control and RTNNmb-lesion mice. F, Effects of RTNNmb-lesion on breathing variability across vigilance states. Two-way repeated-measures ANOVA, RTNNmb-lesion versus state; interaction, F(2,34) = 0.86, p = 0.4310. State, F(2,30) = 24.4, p < 0.0001. Lesion, F(1,17) = 21.4, p = 0.0002. G, Representative recordings of breathing patterns during entry to sleep after a period of continuous waking (>10 min in this case) defined as early NREMS, and later in the same recording immediately before the onset of a REMS period defined as late NREMS. Arrows indicate periods of oscillatory breathing, which occur more frequently during early NREMs than late NREMS. H, Breathing variability during early NREMS and late NREMS in control and RTNNmb-lesion mice. Two-way repeated-measures ANOVA, RTNNmb-lesion versus time in NREMS cycle; interaction, F(1,17) = 2.35, p = 0.14. State, F(1,17) = 23.5, p = 0.0002. Lesion, F(1,17) = 48.1, p < 0.0001. *p < 0.05; **p < 0.01; ***p < 0.001; Control versus RTNNmb-lesion mice by Bonferroni's multiple comparisons (A-H).
A more detailed examination of the breathing pattern revealed the presence of a distinctive phenotype in RTNNmb-lesion mice, namely, a significant increase in the variability of respiratory cycle duration (Fig. 2D–F). This was evident when comparing raw flow traces of highly regular breathing pattern in control mice with the more erratic pattern in RTNNmb-lesion mice (Fig. 2D), and a greater dispersion of data points in Poincaré plots (Fig. 2E). When compared with control mice by two-way ANOVA, there was a significant increase in breathing variability and no interaction with vigilance state (Fig. 2F). Although RTNNmb-lesion mice had unstable breathing across all vigilance states, this effect was most evident during NREMS, a period typically associated with very stable breathing. During periods of NREMS, RTNNmb-lesion mice exhibited breathing instability consisting of rapid accelerations in fR (i.e., tachypneas) followed by hypoventilation (Fig. 2D, right) but few apnea events by standard criteria (respiratory pauses longer than 1s). Breathing instability in RTNNmb-lesion mice was most evident on entry to NREMS (early phase), whereas breathing during periods of NREMS preceding the onset of REMS (late phase) were more stable (Fig. 2G,H). We observed a similar relationship between breathing variability and NREMS in control mice (i.e., higher variability during early phase NREMS), but variability was always higher in RTNNmb-lesion mice. The instability of breathing during early phase NREMS is presumably the effects of the rapid withdrawal of the waking drive to breathe (Dempsey, 2019).
Owing to the severity of respiratory dysfunction in RTNNmb-lesion mice during NREMS, we sought to determine whether ablation of RTNNmb neurons influences sleep-wake patterns based on a 4 h recording period in normoxic conditions beginning between 1000 and 1200 h (Fig. 3). Based on blinded scoring of vigilance state in 20 s epochs independent of breathing pattern, RTNNmb-lesion mice spent the same amount of time in both NREMS and REMS as control mice and had comparable slow-wave activity (δ power) during NREMS (Fig. 3A–C). Furthermore, while oscillatory breathing during NREMS in RTNNmb-lesion mice was occasionally associated with instances of cortical desynchronizations (<1 s), those breathing patterns generally occurred without a detectable change in EEG activity (Fig. 2D, right). However, we did observe a significant increase in the incidence of microarousals during NREMS sleep (EEG desynchronization <10 s) (Fig. 3D–G). When aligned with breathing patterns, these microarousals were always associated with respiratory-related events and commonly with sighs (Fig. 3E–G). Collectively, these data show that a loss of RTNNmb neurons causes hypoventilation and breathing instability and increases respiratory-related sleep disturbances (micro-arousals) without disrupting general sleep-wake processes.

RTNNmb-lesion does not reduce the total time spent in NREMS sleep but increases respiratory-related microarousals. A, Hypnogram of sleep-wake patterns during a single plethysmography recording session. B, Percent time spent in each vigilance state over a 4 h recording period in control and RTNNmb-lesion mice. Two-way ANOVA, RTNNmb-lesion versus state; interaction, F(2,30) = 1.54, p = 0.23. State, F(2,30) = 157.7, p < 0.0001. Lesion, F(1,30) = 2.9e−17, p > 0.99. C, Total power in δ band (0.5-4.5 Hz) of FFT power spectrum of EEG during NREMS in Control and RTNNmb-lesion mice. Mann–Whitney test, U = 8. p = 0.48. D, Representative recording of sleep-wake state scoring using a 20 s window, EEG (moving power-spectrum and raw signal) neck EMG and breathing patterns (Flow) in a RTNNmb-lesion mouse. There was an increase in microarousals (<10 s of cortical desynchronization), consisting of coincident activation of breathing, EEG, and EMG in RTNNmb-lesion mice. E, F, Expanded examples from D. G, Microarousals per 10 min of NREMS in control and RTNNmb-lesion mice. Control versus RTNNmb-lesion mice. Mann–Whitney test, U = 0. p = 0.004.
Effect of hyperoxia on breathing stability
In addition to increased Paco2, we found a significant reduction in arterial Po2 (Pao2) in RTNNmb-lesion mice, with 5 of 6 mice having values <80 mmHg during periods of unrestrained quiet breathing. This characterizes a state of chronic hypoxemia (Fig. 4A) sufficient to activate the peripheral chemoreceptors (Lopez-Barneo, 2022). Thus, we hypothesized that hypoxic drive may be an important compensatory mechanism that supports breathing in the absence of RTNNmb neurons. To test this, we exposed mice to hyperoxia (FIO2 = 0.60) to relieve the hypoxemia in RTNNmb-lesion mice. Hyperoxia produced an immediate and profound hypoventilation in RTNNmb-lesion mice, whereas it had negligible effects on breathing in controls (Fig. 4B–D). In addition to a reduction in fR, hyperoxia in RTNNmb-lesion mice markedly increased breathing variability (Fig. 4E) and led to the appearance of apneas (expiratory duration >1 s, Fig. 4F). Furthermore, RTNNmb-lesion mice exhibited a greater sigh frequency in normoxic conditions relative to controls, and this was normalized during periods of hyperoxia (Fig. 4G,H), suggesting that effects related to hypoxemia following ablation of RTNNmb neurons underlies this enhanced sigh frequency. We also noted that the inspired volume during sighs was significantly larger in RTNNmb-lesion mice compared with controls, but this was not corrected by hyperoxia (Fig. 4I). Collectively, these experiments demonstrate that O2-sensitive mechanisms compensate for the loss of respiratory drive following ablation of RTNNmb neurons.
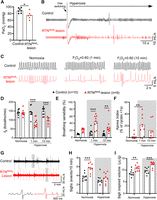
Breathing is driven by hypoxia in RTNNmb-lesion mice. A, Pao2 in control (n = 7) and RTNNmb -lesion mice (n = 6) in normoxic, resting conditions. Unpaired t test, t = 2.757, df = 1, p = 0.0186. *p < 0.01 (t test). B, Breathing responses to acute hyperoxia (FIO2 = 0.6) in control (n = 10) and RTNNmb-lesion (n = 9). RTNNmb-lesion mice present a more pronounced reduction in fR in response to hyperoxia compared with control. C, Breathing in response to hyperoxia 1 min (middle) and 10 min (right) after the beginning of the stimulus. Hyperoxia exacerbates breathing variability in RTNNmb-lesion mice but not in control mice. Hyperoxia also promotes apnea (pauses in respiratory cycle longer than 1 s). Control mice presented no apnea in response to hyperoxia. D, fR. Two-way repeated-measures ANOVA, RTNNmb-lesion versus hyperoxia; interaction, F(2,34) = 14.2, p < 0.0001. Hyperoxia, F(2,34) = 11.5, p = 0.0002. Lesion F(1,17) = 24.5, p = 0.0001. E, Breathing variability. Two-way repeated-measures ANOVA, RTNNmb-lesion versus hyperoxia; interaction, F(1,34) = 4.3, p = 0.0218. Hyperoxia, F(2,34) = 9.3, p = 0.0006. Lesion, F(1,17) = 33.6, p < 0.0001. F, Apnea index. Friedman's test; p = 0.0024. **p < 0.01 (Dunn's multiple comparisons). G, Sigh events in control and RTNNmb-lesion mice. The frequency of the sighs is increased in RTNNmb-lesion mice and the VT increased. H, Sigh frequency. Two-way repeated-measures ANOVA, RTNNmb-lesion versus hyperoxia; interaction, F(1,17) = 6.3, p = 0.0223. Hyperoxia, F(1,17) = 37.2, p < 0.0001. Lesion, F(1,34) = 10.2, p = 0.0053. I, Sigh inspired volume. Two-way repeated-measures ANOVA, RTNNmb-lesion versus hyperoxia; interaction, F(1,16) = 0.89, p = 0.3571. Hyperoxia, F(1,16) = 17.2, p = 0.0008. Lesion, F(1,16) = 22.9, p = 0.0002. **p < 0.01, ***p < 0.001 versus controls by Bonferroni's multiple comparisons test in D-I.
Hypercapnic ventilatory responses
Consistent with the molecular phenotype of Nmb-expressing neurons in the RTN (i.e., expression of specific molecular proton detectors implicated in CO2/H+ sensing, TASK2 and GPR4), we hypothesize that RTNNmb neurons mediate the respiratory response to central chemoreflex activation by CO2. To test this hypothesis, we first examined the effect of hypercapnia in hyperoxic conditions to isolate the central component of the HCVR. Under these conditions, hypercapnia produced a very small increase in the fR, VT, and VE in RTNNmb-lesion mice (Fig. 5A–D), reducing the ΔVE in response to 9% CO2 from an increase of 9.65 ± 0.74 ml/min/kg in intact mice to only 1.89 ± 0.34 ml/min/kg in RTNNmb-lesion mice (control vs RTNNmb-lesion; unpaired t test, t = 9.284, df = 29, n = 16 and 15, p < 0.0001). Interestingly, ΔVE during hypercapnia in RTNNmb-lesion mice was similar in normoxic and hyperoxic conditions (Fig. 5E). According to linear regression of VE during hypercapnia (mean R2 = 0.80 ± 0.03), the sensitivity of HCVR in RTNNmb-lesion mice was reduced by 94% in normoxic conditions and 86% in hyperoxic conditions compared with control mice (Fig. 5F). Notably, despite a large reduction in the HCVR in RTNNmb-lesion mice compared with controls, there was still a significant residual increase in VE from baseline during hypercapnia by one-way ANOVA (Fig. 5E). In addition to deficits in the HCVR, we also found that stabilizing effect of hypercapnia on breathing frequency observed in controls was absent in RTNNmb-lesion mice (Fig. 5G). That is, whereas breathing variability decreased between 0% and 9% CO2 in control mice, it was higher in RTNNmb-lesion mice and did not change across that range of CO2 (Fig. 5H). In sum, the ablation of RTNNmb neurons in adult mice essentially eliminates the HCVR and disrupts the stabilizing effects of hypercapnia on breathing.

RTNNmb-lesion attenuates the HCVR and the effects of CO2 on breathing variability. A, Representative recordings of breathing during hypercapnia in controls and RTNNmb-lesion mice. Only controls exhibit a graded increase in VE as FICO2 increases. B, Effects of RTNNmb-lesion on fR during hypercapnia. Two-way repeated-measures ANOVA, RTN-lesion versus CO2 condition; interaction, F(4,120) = 74.2, p < 0.0001. CO2 condition, F(3,96) = 188.5, p < 0.0001. Lesion, F(1,30) = 132.3, p < 0.0001. C, Effects of RTNNmb-lesion on VT during hypercapnia. Two-way repeated-measures ANOVA, RTN-lesion versus CO2 condition; interaction, F(4,120) = 29.5, p < 0.0001. CO2 condition, F(3,85) = 78.3, p < 0.0001. Lesion, F(1,30) = 35.2, p < 0.0001. D, Effects of RTNNmb-lesion on VE during hypercapnia. Two-way repeated-measures ANOVA, RTN-lesion versus CO2 condition; interaction, F(4,120) = 70, p < 0.0001. CO2, F(2,54) = 126.1, p < 0.0001. Lesion, F(1,30) = 135.7, p < 0.0001. E, Comparison of the HCVR in RTNNmb-lesion and control mice in normoxia and hyperoxia. One-way repeated-measures ANOVA. Controls in normoxia; F(2,8) = 73.15, p < 0.0001. RTNNmb-lesion in normoxia; F(1,7) = 6.697, p = 0.036. Controls in hyperoxia; F(2,9) = 79.77, p < 0.0001. RTNNmb-lesion in hyperoxia; F(2,9) = 5.822, p = 0.028. F, Slope of linear regression for HCVR data in E. Two-way ANOVA, RTNNmb -lesion versus O2 condition; interaction, F(1,19) = 4.699, p = 0.0431. O2 condition, F(1,19) = 2.278, p = 0.148, p < 0.0001. Lesion, F(1,19) = 237.1, p < 0.0001. G, Breathing recordings during hypercapnia in controls and RTNNmb-lesion mice. Note variability present in RTNNmb-lesion mice even under high CO2. H, Effects of RTNNmb-lesion on the breathing variability during hypercapnia. One-way repeated-measures ANOVA. Controls; F(1.312, 11.81) = 17.08, p = 0.0008. RTNNmb-lesion; F(2,13) = 1.249, p = 0.31. *p < 0.05, **p < 0.01, ***p < 0.001 versus controls by Bonferroni's multiple comparisons test in B-D, F, versus baseline by Holm–Sidak's multiple comparisons test for E, versus other CO2 conditions by Tukey's multiple comparisons for H.
Hypoxic ventilatory responses
Given the dramatic attenuation in the HCVR of RTNNmb-lesion mice, we examined the possibility that ablation of RTN neurons reduces the sensitivity of the respiratory central pattern generator to other stimulants of breathing. To this end, we examined the hypoxic ventilatory response, which is understood to be mediated primarily by the peripheral chemoreceptors (Lopez-Barneo, 2022). In contrast to the effect of hypercapnia in RTNNmb-lesion mice, the increase in VE during graded hypoxia was not attenuated in RTNNmb-lesion after accounting for baseline differences (Fig. 6A–E). Indeed, there was a notable sensitization of the fR response and an attenuated VT response to hypoxia in RTNNmb-lesion mice (Fig. 6B,C). Furthermore, unlike the effects of hypercapnia noted above, hypoxia stabilized breathing patterns in RTNNmb-lesion mice (Fig. 6F,G). This suggests that breathing instability in RTNNmb-lesion mice is likely caused by deficits that are specific to the CO2-mediated drive to breathe. Unstable breathing during the post-hypoxia recovery period is a well-known characteristic of mice (Yamauchi et al., 2007; Getsy et al., 2014) that was present in both controls and RTNNmb-lesion mice (Fig. 6H). It has been suggested that unstable breathing in this condition is mostly related to hypocapnia/alkalosis that occurs with hypoxia-induced increases in VE (Yamauchi et al., 2007). Collectively, these data show that the hypoxic ventilatory response does not require RTNNmb neurons and that the respiratory central pattern generator is functionally intact in RTNNmb-lesion mice. However, there appears to be a reorganization of the hypoxic ventilatory response that promotes tachypnea to compensate for an inadequate recruitment of VT during hypoxia. Also, the persistence of unstable breathing during the post-hypoxia period in RTNNmb-lesion mice suggests that this effect is not only due the effects of hypocapnia/alkalosis on RTNNmb neurons.

RTNNmb-lesion does not attenuate the hypoxic ventilatory response or the effects of hypoxia on breathing variability. A, Breathing recordings from control and RTNNmb-lesion mice during hypoxia (FIO2 = 0.12 and 0.1). Hypoxia increases ventilation and reduces the breathing variability in both control and RTNNmb-lesion mice. B, Effects of RTNNmb-lesion on fR during hypoxia. Two-way repeated-measures ANOVA, RTN-lesion versus O2 condition; interaction, F(2,24) = 10.2, p = 0.0006. O2 condition, F(2,24) = 75.3, p < 0.0001. Lesion, F(1,12) = 6.1, p = 0.0299. C, Effects of RTNNmb-lesion on VT during hypoxia. Two-way repeated-measures ANOVA, RTN-lesion versus O2 condition; Interaction, F(2,24) = 2.1, p = 0.1368. O2 condition, F(2,24) = 27.2, p < 0.0001. Lesion effect F(1,12) = 10.7, p = 0.0066. D, Effects of RTNNmb-lesion on VE during hypoxia. Two-way repeated-measures ANOVA, RTN-lesion versus O2 condition; interaction, F(2,24) = 1.9, p = 0.1692. O2 condition, F(2,24) = 62.9, p < 0.0001. Lesion, F(1,12) = 4.4, p = 0.0556. E, Changes in VE from baseline. Two-way repeated-measures ANOVA, RTN-lesion versus O2 condition; interaction, F(1,12) = 2.5, p = 0.1365. O2 condition, F(1,12) = 39.6, p < 0.0001. Lesion, F(1,12) = 0.81, p = 0.3854. F, Poincaré plots of breath-to-breath interval (BBn) and subsequent breath-to-breath interval (BBn+1) from an RTNNmb-lesion mouse in normoxia and during hypoxia (FIO2 = 0.1). Breathing becomes less variable during hypoxia. G, Breathing variability during hypoxia. One-way repeated-measures ANOVA. Control, F(2,9) = 1.2, p = 0.3325; RTNNmb-lesion, F(2,12) = 15.6, p = 0.0006. **p < 0.01 from Tukey's multiple comparisons. H, Breathing recordings during the reoxygenation period following hypoxia. Recordings taken 1-2 min after switching the gas condition from hypoxia (FIO2 = 0.1) to normoxia. Reoxygenation following hypoxia increases variability of breathing in both control and RTN lesion mice. I, Breathing variability during reoxygenation in control and RTNNmb-lesion mice. Two-way repeated-measures ANOVA, RTNNmb-lesion versus O2 condition; interaction, F(1,12) = 0.02270, p = 0.88. O2 condition, F(1,12) = 11.43, p = 0.006. Lesion, F(1,12) = 0.7796, p = 0.40. *p < 0.05, **p < 0.01, ***p < 0.001 versus controls by Bonferroni's multiple comparisons test in B-D, and by Holm–Sidak's multiple comparisons test for G.
Optogenetic inhibition of RTNNmb neurons
Our experiments using bilateral ablation of RTNNmb neurons indicate that these neurons contribute at least one-third of the drive to breathe during resting VE. However, as demonstrated by the effects of hyperoxia, there is likely a degree of physiological compensation that occurs following ablation that could result in an underestimation of the contribution of RTNNmb neurons to resting VE. Hence, we performed acute and reversible optogenetic inhibition of RTNNmb neurons using the inhibitory proton pump eArch3.0 to assess the instantaneous contribution of these neurons to VE (Fig. 7). To improve the efficacy of our approach, RTNNmb neurons were ablated in the right RTN using AAV5-FLEX-Casp3-TEVp, and a unilateral optical fiber was used to illuminate (and inhibit) the remaining contralateral RTNNmb neurons expressing eArch3.0 (selectivity: 98.9 ± 1.1%; coverage: 58.3 ± 11.5% n = 3) (Fig. 7A–C). Notably, the HCVR of mice with unilateral ablation of RTNNmb neurons was similar to controls (compare Fig. 7J with Fig. 5D), consistent with our work in rats demonstrating that deficits in respiratory control are only observable after nearly all of the RTNNmb neurons are eliminated (Souza et al., 2018).

Acute optogenetic inhibition of RTNNmb neurons produces hypoventilation. A, Experimental setup for the optogenetic inhibition of RTNNmb neurons. B, Photomicrograph showing the optical fiber tract and RTNNmb neurons transduced with eArch3.0. Scale bar, 400 µm C, ISH showing Nmb neurons expressing eArch3.0-eYFP. Arrowheads indicate double-labeled cells. Scale bar, 100 µm. D, Optogenetic inhibition of RTNNmb neurons during different stages of the sleep-wake cycle. E, Effect of RTNNmb neuron inhibition on fR (n = 5). Two-way repeated-measures ANOVA, laser-on versus vigilance state; interaction, F(1,5) = 5.1, p = 0.0754. Laser-on, F(1,5) = 5.1, p = 0.0754. vigilance state, F(1,6) = 6.6, p = 0.0402. F, Effect of RTNNmb neuron inhibition on VT. Two-way repeated-measures ANOVA, laser-on versus vigilance state; interaction, F(1,5) = 5.1, p = 0.0754. Laser-on, F(1,4) = 659.0, p < 0.0001. Vigilance state, F(1,6) = 6.6, p = 0.0402. G, Effect of RTNNmb neuron inhibition on VE. Two-way repeated-measures ANOVA, laser-on × vigilance state; interaction, F(2,6) = 28.9, p = 0.0009. Laser-on, F(1,4) = 526.1, p < 0.0001. Vigilance state, F(2,6) = 7.4, p = 0.0267. H, ΔVE during RTNNmb neuron inhibition. One-way repeated-measures ANOVA, F(2,6) = 30.1, p = 0.0008. I, Effect of inhibition of RTNNmb neurons during hyperoxia (top panels) and hyperoxic hypercapnia (bottom panels). The effect of RTNNmb neuron inhibition during hyperoxia and hyperoxic hypercapnia is increased compared with normoxia. J, Effect of RTNNmb neuron inhibition on VE during normoxia, hyperoxia, and hyperoxic hypercapnia. Normoxia versus hyperoxia at 0% CO2, two-way repeated-measures ANOVA, laser-on versus O2 condition; interaction, F(1,4) = 17.14, p = 0.0144. Laser-on, F(1,4) = 66.38, p = 0.0012. O2 condition, F(1,4) = 5.955, p = 0.0712. Effect across CO2 conditions, two-way repeated-measures ANOVA, laser-on versus CO2 condition in hyperoxia; interaction F(3,12) = 11.21, p = 0.0009. Laser-on, F(1,4) = 78.73, p = 0.0009. CO2 condition, F(3,12) = 34.77, p < 0.0001. K, ΔVE during inhibition of RTNNmb neurons as a percentage of baseline in hyperoxia and hyperoxic hypercapnia. One-way repeated-measures ANOVA, F(2,8) = 24.77, p = 0.0004. L, Effect of RTNNmb neuron inhibition during hypoxia (FIO2 = 0.1) and during hypoxia-hypercapnia (FICO2 = 0.06). Hypoxia blunts the effect of RTNNmb neuron inhibition, and this effect is reversed by supplementing CO2 to the breathing mixture. M, ΔVE during inhibition of RTNNmb neuron in hypoxia and hypoxia-hypercapnia. One-way repeated-measures ANOVA, F(1,6) = 23.74, p = 0.0026. *p < 0.05, **p < 0.01, **p < 0.001 by Bonferroni's multiple comparisons test for E-G, J, and by Tukey's multiple comparisons test for H, K, M.
Unilateral opto-inhibition of RTNNmb neurons resulted in an immediate reduction in VE in all vigilance states (Fig. 7D–H). Inhibition of RTNNmb neurons caused a comparable reduction in fR, VT, and VE during both waking and NREMS, whereas the effects on fR and VT were less pronounced and more variable during REMS, similar to previous studies in rats (Burke et al., 2015), which confirms a diminished significance for RTNNmb neurons in the control of breathing during this state. Complete apnea was not observed during optogenetic inhibition of RTNNmb neurons in normoxic conditions. However, hyperoxia enhanced the effect of opto-inhibition (ΔVE during RTNNmb neuron inhibition in normoxic vs hyperoxic; −1.61 ± 0.20 vs −2.37 ± 0.31 ml/min/kg, n = 5, paired t test t = 4.141, df = 4, p = 0.0144) and produced complete apnea in most trials (Fig. 7I, top). In hyperoxic conditions, the effect size of opto-inhibition of RTNNmb neurons on VE was also enhanced with graded hypercapnia (Fig. 7I,J), although the reduction in VE as a proportion of baseline ventilation was significantly reduced during 9% CO2 compared with other levels of CO2 (Fig. 7K). Finally, 10% hypoxia essentially eliminated the reduction in VE during opto-inhibition of RTNNmb neurons, and this could be reversed by the addition of 6% CO2 (Fig. 7L,M). Collectively, this experiment indicates that RTNNmb neurons provide CO2/pH-dependent drive to breath that is necessary for optimal VE across vigilance states. Furthermore, resting eupneic ventilation in hyperoxic conditions is determined by RTNNmb neurons.
RTNNmb neuron ablation does not perturb CO2 avoidance behavior
In mice, hypercapnia produces anxiety-related behaviors and avoidance that has been linked to the detection CO2 or H+ by cells in the hypothalamus and limbic system (Ziemann et al., 2009; Vollmer et al., 2016; Taugher et al., 2020). Phox2b-expressing RTN neurons are reported to contribute to arousal from sleep in response to CO2 in rats and anatomic evidence indicates Phox2b-expressing RTN neurons innervate the LPB, a region involved in aversive behaviors (Abbott and Souza, 2021). Based on this, we tested the hypothesis that RTN neurons contribute to the behavioral response of mice to hypercapnia. We first examined freezing behavior during exposure to CO2 in an open-field assay. During exposure to 10% CO2, RTNNmb-lesion and control mice exhibited freezing for a comparable period of time and had a similar incidence of jumping in both normoxia and hypercapnia (Fig. 8A–C). Next, we determined whether ablation of RTNNmb neurons influenced the natural preference of mice for low CO2 environments using a two-chamber placed-preference assay. Based on a two-way repeated-measures ANOVA, ablation of RTNNmb neurons did not markedly affect CO2 avoidance in this assay (Fig. 8D,E). Collectively, these data suggest that RTNNmb neurons are not required for freezing, jumping, or avoidance behaviors in response to a high CO2 environment.

RTNNmb-lesion does not reduce freezing or avoidance during hypercapnia. A, Example of video-tracking for controls (top panels) and RTNNmb-lesion (bottom panels) mice during normoxia and 10% CO2 exposure in an open-field assay. B, Group data for time spent freezing in 5 min during room air and 10% CO2 conditions. Two-way repeated-measures ANOVA, RTNNmb-lesion versus CO2 condition; interaction, F(1,19) = 2.632, p = 0.12. CO2 condition, F(1,19) = 58.58, p < 0.0001. Lesion, F(1,19) = 0.3516, p = 0.56. C, Group data for the incidence of jumping in 5 min during normoxia and 10% CO2 conditions. Two-way repeated-measures ANOVA, RTNNmb-lesion versus CO2 condition; interaction, F(1,19) = 0.09873, p = 0.76. CO2 condition, F(1,19) = 0.6632, p = 0.43. Lesion, F(1,19) = 4.442, p = 0.049. D, Example of video-tracking for controls (top) and RTNNmb-lesion (bottom) mice during a two-chamber CO2 avoidance assay. E, Group data for the % of time spent in the normoxia chamber during a 20 min period. Two-way repeated-measures ANOVA, RTNNmb-lesion versus time; interaction, F(3,42) = 1.751, p = 0.17. Time, F(3,42) = 2.49, p = 0.074. Lesion, F(1,14) = 3.21, p = 0.095. E, p indicates comparison of controls and RTNNmb-lesion mice by Sidak's multiple comparisons test.
Efferent projections of RTNNmb neurons
The axonal projections of Phox2b-expressing RTN neurons, a population of neurons that overlaps with but may not be strictly identical to the Nmb-expressing RTN neurons, have been well described in rats (Abbott et al., 2011; Silva et al., 2016; Souza et al., 2020) but not in mice. Based on the functional effects of ablating RTNNmb neurons and known projections of Phox2b-expressing RTN neurons in rats, we hypothesized that RTNNmb neurons would innervate respiratory-related regions in the pons and medulla. To map the downstream connections of RTNNmb neurons in mice, we performed genetically targeted efferent tracing experiments. Microinjections of a Cre-dependent AAV-expressing red fluorescent protein (mScarlet) in the RTN labeled a majority of Nmb-expressing neurons with high selectivity (selectivity: 98.8 ± 1.2%, coverage: 58.3 ± 11.5% n = 3, Fig. 9C,D). In these cases, intensely labeled axons and terminals were observed in the regions that contain the medullary and pontine respiratory network (Fig. 9) (Del Negro et al., 2018). Labeled fibers were not observed anterior to the parabrachial nucleus. RTNNmb fiber and terminals were present in most subregions of the LPB, with the heaviest innervation concentrated in areas reported to contained neurons that coexpress Foxp2 and Lmx1b in mouse (Karthik et al., 2022), corresponding to the Kölliker–Fuse, external lateral and lateral crescent PB (Fulwiler and Saper, 1984). Only sparse fibers were observed in the external lateral PB and the medial parabrachial nucleus (Fig. 9E,M). We also noted RTNNmb fibers in a region medial to the locus coeruleus that contained TH positive processes (Fig. 9F).

RTNNmb neurons innervate the ponto-medullary respiratory network. A, Experimental approach to label the efferents of RTNNmb neurons. B, Graphic summary of projections of RTNNmb neurons. C, Image of RTN Nmb neurons at the site of virus injection. D, ISH showing co-expression of mScarlet (upper panel) and Nmb mRNA (lower panel). E, Image of RTNNmb neurons projecting to the LPB. F, Image of projections of RTNNmb neurons to locus coeruleus labeled with TH and Phox2b-GFP. G, Image of projections of RTNNmb neurons to the dorsomedial perifacial region (indicated by white arrows). This projection extended the rostro-caudal length of the facial motor nucleus. H, Image of projections of RTNNmb neurons to the NTS; Hi, Hii, Insets. I, J, Images of projections of RTNNmb neurons to the PreBötC, ipsilateral to the injection site in I and contralateral to the injections site in J. K. Images of labeled axons of RTNNmb neurons in the upper cervical spinal cord. L, Normalized density of varicosities per 100 mm2 across different pontomedullary regions. Scale bars: all photomicrographs, 100 µm. ITR, Intertrigeminal region.
Within the brainstem, we observed moderate terminal fields spanning the dorsomedial edge of facial motor nucleus (Fig. 9G). These fibers merged caudally with the intense projection of RTNNmb neurons to the entire ventral respiratory column. RTNNmb neurons also heavily innervated the NTS, with the heaviest projections found in the ventrolateral and commissural subnuclei of the NTS (Fig. 9H,M). We also observed sparse contralateral RTNNmb projections throughout the ventral respiratory column and NTS but not to the parabrachial region. A sparse collection of axons and fibers were observed in the lateral funiculus of the cervical spinal cord with sparse terminal fields in the lateral and ventrolateral gray matter (Fig. 9L). We quantified the density of RTNNmb varicosities in the main targets of these efferents, finding that RTN terminals were comparably dense in the Kölliker–Fuse and ventral respiratory column, and sparser in the NTS, the perifacial region and the locus coeruleus (Fig. 9M).
To complement our anterograde tracing, we conducted retrograde tracing of RTN neurons (Fig. 10); we used a retrogradely transported AAV-Cre (AAVrg-Cre) microinjected in a Cre- reporter mouse line and detected GFP by immunohistochemistry along with Nmb and Galanin transcripts by FISH to identify neurons. We focused on four easily distinguished locations in the ponto-medullary respiratory network: the LPB, including the Kölliker–Fuse, PreBötC, NTS, and the location of expiratory premotor neurons in the cVRG (Fig. 10A,B). Injections of AAV-Cre labeled a substantial proportion of RTNNmb neurons regardless of location (PreBötC, 74.5 ± 3.3%; LPB, 65.2 ± 2.6%; cVRG, 53.8 ± 5.5%; NTS, 37.5 ± 3.0% of total RTNNmb neurons) (Fig. 10C). Moreover, PreBötC, cVRG, and NTS tracing labeled an appreciable number of RTNNmb neurons contralateral to the injection site (15.5 ± 11.2%, 22.8 ± 11.7%, and 35.1 ± 5.6% of total RTNNmb neurons, respectively), whereas contralateral labeling was extremely rare following injections in the LPB (2.5 ± 1.6% of total RTNNmb neurons). Additionally, we found a small group of RTN neurons were retro-labeled following injections of AAVrg-Cre in the spinal cord at T2 (8.5 and 6.8% of total Nmb+ neurons in 2 cases), confirming the evidence from the anterograde tracing of RTNNmb neurons.

RTN neuron projections to the ponto-medullary respiratory network are highly collateralized. A, Experimental approach to retrogradely label RTNNmb neurons using a Cre-reporter mouse. B, Location and distribution of AAVrg-Cre injections. C, Group data percent of RTNNmb neurons that innervate the PreBötC, LPB, cVRG, and NTS. D, Same data as in C, except segregated according to the presence or absence of Galanin transcript (Gal). E, Image of retrograde-labeled RTNNmb neurons after injections in the cVRG. RTNNmb neurons that were Gal- were less commonly labeled that RTNNmb neurons that were Gal+, and that Gal+ often expressed low levels of Nmb. Scale bar, 100 µm. F, Distribution of retrograde-labeled RTNNmb neuron from a representative case from each targeted region.
The neuropeptide Galanin is reported to be enriched in a subpopulation of CO2-activated RTNNmb neurons that express low levels of Nmb transcript (Stornetta et al., 2009; Shi et al., 2017). Galanin transcript was expressed in 35.4 ± 1.7% of RTNNmb neurons, principally those with relatively low Nmb expression that tended to be closer to the ventral surface of the medulla (Fig. 10E,F). Within the Gal+ population of RTNNmb neurons, virtually all projected to both the PreBötC and LPB (91.3 ± 5.1% and 94.9 ± 1.8%, respectively), and a majority projected to the cVRG and NTS (79.3 ± 8.9% and 59.7 ± 7.1%, respectively) (Fig. 10D). Together, these anatomic data demonstrate that RTNNmb neurons in mice innervate the respiratory rhythm and pattern generating network with a strong ipsilateral preference, similar to what has been described for Phox2b-expressing RTN neurons in the rat. In addition, they also project to regions that may be involved in nonrespiratory functions, such as the regulation of cardiovascular function and arousal. Furthermore, RTNNmb neurons are highly collateralized, with at least one-third of these neurons having collaterals to both the PreBötC and LPB, and possibly all compartments of the respiratory network.
Discussion
Leveraging a novel transgenic line, this study reveals that RTNNmb neurons are a hub for the integration of CO2-dependent drive to breathe. Based on the circumscribed projections of RTNNmb neurons and the persistence of the behavioral effects of high CO2 after ablation of RTNNmb neurons, these neurons appear to be specialized for controlling the respiratory-related effects of CO2. Following ablation of RTNNmb neurons, the contribution of oxygen-sensitive mechanisms to resting ventilation is increased markedly, suggesting that peripheral chemoreceptors, likely the carotid bodies, compensate for the loss of RTNNmb neurons. After the loss of RTNNmb neurons, a reduction in central CO2-dependent drive to breathe coupled with a heightened role of peripheral chemoreceptors in breathing may account for breathing instability during NREMS. Similar mechanisms may also drive respiratory events during NREMS that result in sleep fragmentation in mice lacking RTNNmb neurons.
RTNNmb neurons are critical for alveolar ventilation regardless of vigilance state
RTN neurons have long been attributed a role in the HCVR but have also been viewed ultimately as redundant for eupneic ventilation at rest (Marina et al., 2010; Ramanantsoa et al., 2011; Nattie and Li, 2012; Guyenet et al., 2019). Our study finds that ablation of RTNNmb neurons in adult mice reduced resting VE and led to a retention of CO2 and unchanged VCO2. As such, alveolar ventilation was reduced by 35%, which is comparable to RTN-lesion in adult rats (Souza et al., 2018). However, optogenetic inhibition of RTNNmb neurons produced a 70 ± 4% reduction in VE in normoxic conditions and complete apnea in hyperoxic conditions, which indicates that that the 35% reduction in alveolar ventilation in RTNNmb-lesion mice relative to controls is likely an underestimation of RTNNmb neuron contribution to eupneic respiratory drive. Importantly, the effects of ablation or optogenetic inhibition of RTNNmb neurons on VE were comparable in absolute terms during waking and NREMS, indicating that the RTNNmb neuron contribution to breathing does not significantly interact with the “waking drive to breathe” (Shea, 1996; Khoo, 2000). Thus, our data demonstrate that RTNNmb neurons regulate respiratory homeostasis across vigilance states, with a more pronounced contribution to VE during NREMS. This result is consistent with the notion that hypoventilation during sleep in individuals with CCHS could be partly because of a disruption of RTNNmb neurons.
RTNNmb neurons stabilize breathing during NREMS
Robust and regular respiratory motor activity is necessary for optimal gas exchange, and ventilatory instability is an important factor contributing to the pathogenesis of sleep-related breathing disorders (Javaheri et al., 2017; Orr et al., 2017). In this study, we observed increased breathing variability in RTNNmb-lesion mice that was clearest during NREMS. Recent studies (Cleary et al., 2021; Ferreira et al., 2022) corroborate our findings, and suggest that breathing instability is a consistent phenotype caused by RTN dysfunction in adult mice. Conversely, RTN-lesion in rats does not cause respiratory instability in normoxic conditions (Souza et al., 2018). However, this could be explained by the countervailing effect of damage to respiratory centers, such as the Bötzinger complex and possibly other neurons (Souza et al., 2019).
Breathing instability in RTNNmb-lesion mice was exacerbated at the onset of NREMS, which is notable because periodic breathing in humans during hypoxia and in central sleep apnea occurs predominantly during light NREMS (Javaheri and Dempsey, 2013). We also observed an increase in respiratory-related microarousals in normoxic conditions in RTNNmb-lesion mice, suggesting that respiratory disturbances caused by a loss of RTNNmb neurons are significant enough to disrupt NREMS. We did not observe apneas in RTNNmb-lesion mice under normoxic conditions, which is presumably because of elevated peripheral chemoreceptor activity. This observation is supported by the appearance of apneas in RTNNmb-lesion mice under hyperoxia.
The administration of CO2 or lowering arterial pH with acetazolamide stabilizes erratic breathing pattern in healthy humans during hypoxia and at high altitude (Berssenbrugge et al., 1983; Fan et al., 2012), and in patients with obstructive sleep apnea (Xie et al., 2013) and Cheyne-Stokes breathing (Lorenzi-Filho et al., 1999; Javaheri, 2006). However, breathing instability in RTNNmb-lesion mice was not corrected by increasing inspired CO2. Together, these data provide evidence that RTNNmb neurons mediate the stabilizing effect of CO2 on breathing and suggest that a loss of this mechanism leads to sleep-disordered breathing in mice.
What mechanisms cause unstable breathing in RTNNmb-lesion mice? Periodic breathing in humans and experimental animals is thought to involve interactions between the apneic threshold, the sensitivity of the HCVR (i.e., loop gain), transient arousals, and cerebral blood flow (Ainslie et al., 2013; Javaheri and Dempsey, 2013). Among these possibilities, an elevation in apneic threshold is particularly plausible given that RTNNmb-lesion mice are unresponsive to CO2, and previous studies in rats show that RTN-lesion raises the apneic threshold (Takakura et al., 2008). Furthermore, we observed evidence indicative of enhanced peripheral chemoreceptor activity and sensitivity in RTNNmb-lesion mice, which contributes to periodic breathing in humans and dogs (Javaheri and Dempsey, 2013). The carotid body (Lopez-Barneo, 2022), which detects O2, CO2, and H+, is the most likely source of compensatory respiratory drive in RTNNmb-lesion mice, though not the only possibility (aortic bodies and brainstem mechanisms) (Lahiri and Forster, 2003; Angelova et al., 2015; Gourine and Funk, 2017; Uchiyama et al., 2020). Thus, unstable breathing in RTNNmb-lesion mice could be caused by an elevated apneic threshold compounded by carotid body hyperactivity and hypersensitivity. Transient arousal and altered cerebral blood flow may also contribute to breathing instability in this model as an effect secondary to the respiratory dysfunction in RTNNmb-lesion mice.
RTNNmb neurons are specialized for the respiratory regulation of CO2
RTNNmb neurons have been proposed to have two nonmutually exclusive functions: Shi et al. (2017) proposed that Nmb is expressed by RTN chemoreceptor neurons (Guyenet et al., 2019), whereas Li et al. (2016, 2020) proposed that Nmb identifies perifacial neurons that stimulate sighs. In the present study, selective ablation of RTNNmb neurons (1) elevated arterial Pco2 by 10 mmHg, (2) largely eliminated the HCVR, and (3) increased spontaneous sighs. These results broadly support the interpretation of Shi et al. (2017) but are not consistent with the results of Li et al. (2020) who used chemogenetics to silence RTNNmb neurons and found no changes in minute-ventilation and a reduction in sigh frequency. This discrepancy may be attributable to differences in the transgenic model and approach used, and in the case of sigh frequency, the activation of O2-sensitive mechanisms that prevent alveoli collapse in the lungs (atelectasis). Notably, RTNNmb neurons appear not to contribute to hypoxia-induced sighing in mice (Souza et al., 2018; Li et al., 2020; current study), which may instead be mediated by Grp-expressing neurons of the NTS (Yao et al., 2023).
The reduction in the HCVR in RTNNmb-lesion mice largely aligns with previous studies that use genetic deletion, inhibition, or lesion of the RTN Phox2b neurons (Marina et al., 2010; Takakura et al., 2014; Ruffault et al., 2015; Souza et al., 2018). However, we observed a substantially larger reduction in the HCVR than many previous studies, which we attribute to the selectivity and efficiency of the approach used in this study and the absence of developmental compensation. Importantly, the reduction in the HCVR in RTNNmb-lesion mice could be because of an attenuation of active expiration, which is an important mechanism for increasing VT during hypercapnia. Anatomically, RTNNmb neurons are found in both the ventral and lateral parafacial region, which are important for active expiration (Pagliardini et al., 2011; Huckstepp et al., 2015). Moreover, functional studies using the Phox2b-promoter, PRSx8, to target RTN neurons in rats show that the selective activation of RTN neurons drives active expiration (Souza et al., 2020) and inhibition of RTN neurons blocks active expiration in anesthetized and reduced preparations (Marina et al., 2010). As such, the data support the interpretation that active expiration is attenuated in RTNNmb-lesion mice. However, direct recordings of abdominal activity during hypercapnia are needed to verify this interpretation. In contrast to the reduction in the HCVR, RTNNmb-lesion mice had a robust behavioral response to high CO2, which suggests that RTNNmb-lesion selectively disrupts respiratory-related responses to hypercapnia. Consistent with this notion, our data show that RTNNmb neurons projects densely and almost exclusively to the respiratory-related regions in the pons and medulla. These projections are highly collateralized and generally conform to the descriptions of the connectivity of Phox2b-expressing RTN neurons in rats (Abbott et al., 2009; Souza et al., 2020). Given their anatomy, RTNNmb neurons are well placed to stimulate respiratory circuits that promote alveolar gas-exchange. Thus, our results provide essential functional and anatomic evidence for the assertion that perifacial Nmb expression in adult mice identifies CO2-activated Phox2b-expressing central chemoreceptor neurons that contribute to the respiratory regulation of arterial Pco2 and pH.
Compensatory responses after RTNNmb ablation in mice
This study shows that the loss of RTN neurons produces alveolar hypoventilation and fully compensated respiratory acidosis, which could involve several physiological adaptations (Cummins et al., 2020). Our data indicate that the renal retention of bicarbonate normalizes arterial pH and respiratory homeostasis establishes at a new set point for Po2/Pco2. The resetting of respiratory homeostasis appears to be mediated by O2-dependent respiratory drive and, to a lesser extent, wake-active drive that compensates for the loss of CO2-dependent respiratory drive. The greater effect of hyperoxia on VE in RTNNmb-lesion mice suggests that there is a reduction in CO2 drive to breath at equilibrium, but our data suggest that there is a weak but persistent effect of CO2 on breathing. First, there was a small residual HCVR under normoxic and hyperoxic conditions in RTNNmb-lesion mice. Second, breathing at rest persisted under hyperoxic conditions in RTNNmb-lesion mice, although this interpretation is predicated on the assumption that hyperoxia effectively silences O2-sensing mechanisms in RTNNmb-lesion mice. Finally, post-hypoxia breathing instability, which we attribute to CO2 chemoreceptor silencing caused by hyperventilation-induced hypocapnia/alkalosis (Lydic et al., 2002; but see Millhorn et al., 1984; Gallman and Millhorn, 1988), was similar in RTNNmb-lesion and control mice. In sum, respiratory homeostasis in RTNNmb-lesion mice is largely driven by the O2 homeostasis, but a small component of CO2- and/or H+-dependent respiratory drive may still contribute to alveolar ventilation and respiratory homeostasis.
In conclusion, the selective ablation of RTNNmb neurons causes hypoventilation at rest and virtually eliminates the HCVR. Moreover, we demonstrated that disrupting RTNNmb neurons causes highly unstable breathing patterns, particularly during sleep, which raises the possibility that a change in RTNNmb activity could be important in the etiology of certain forms of sleep-disordered breathing in humans. The potent respiratory effect of deleting RTNNmb neurons appears to stem from a breakdown in the relationship between Paco2 and ventilation that exists in intact conditions, which results in respiratory homeostasis driven by O2-dependent mechanisms.
Footnotes
- Received February 28, 2023.
- Revision received June 1, 2023.
- Accepted June 5, 2023.
-
This work was supported by National Institutes of Health Grant HL108609 to D.A.B. and HL148004 to S.B.G.A.; and CCHS Family Foundation Pilot Grant to Y.S. We thank Dr. Patrice Guyenet for helpful feedback throughout the course of this project.
-
The authors declare no competing financial interests.
- Correspondence should be addressed to Stephen B.G. Abbott at sba6t{at}virginia.edu
- Copyright © 2023 the authors




