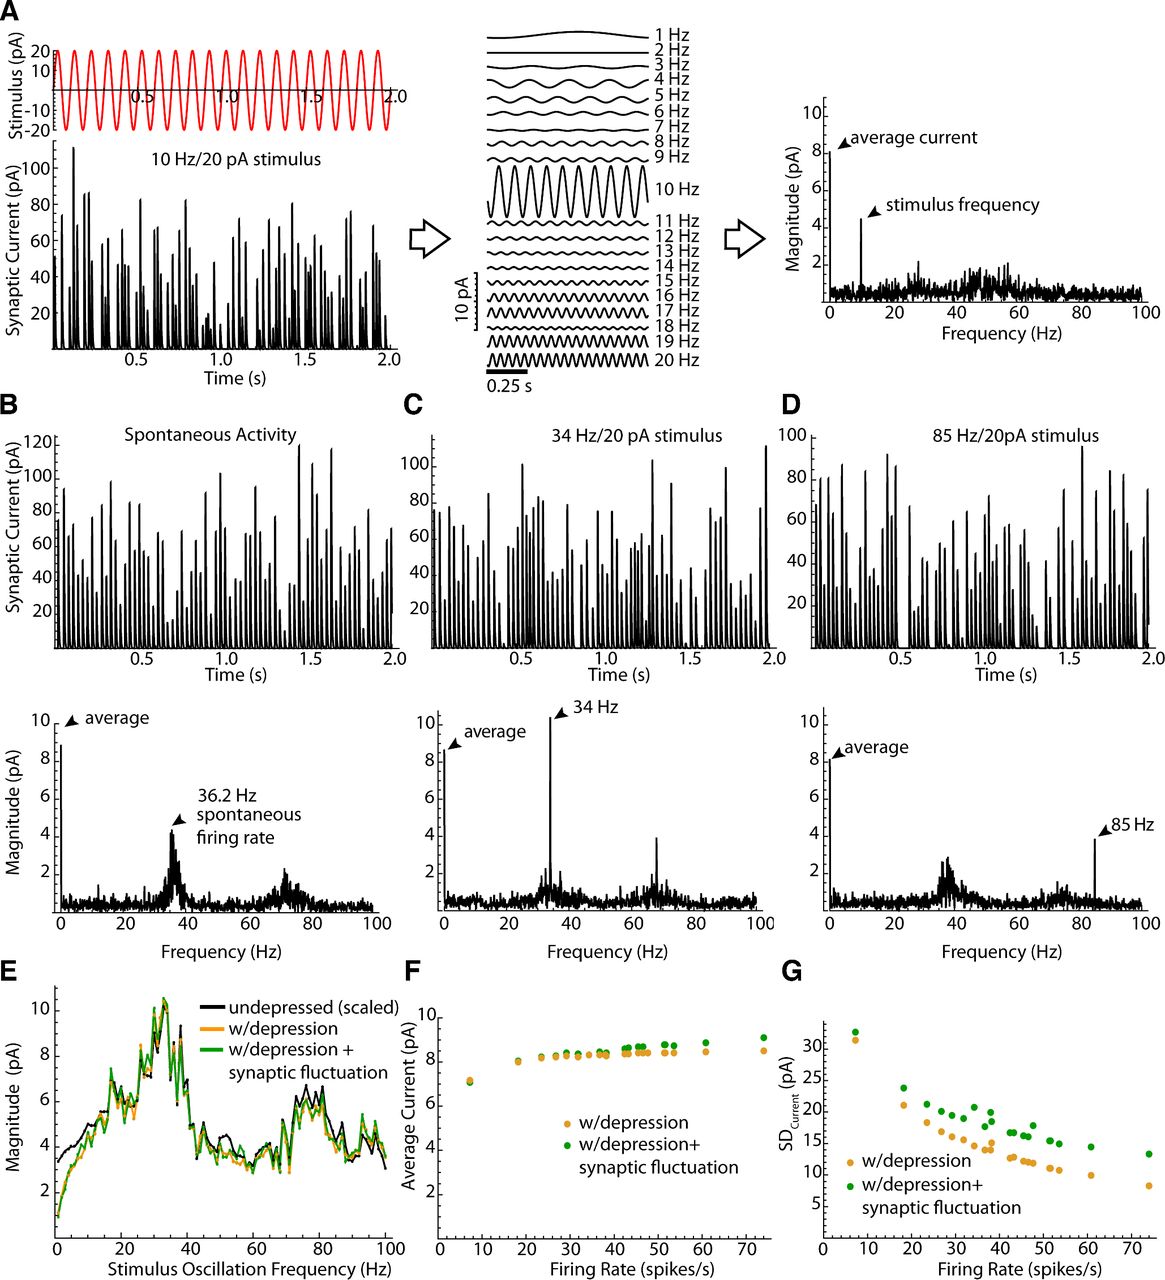
The frequency spectrum of propagated synaptic current. A, Creation of the frequency spectrum. Current calculated for a conductance waveform as in Figure 2 for a GPe cell with a 10 Hz stimulus. Current is decomposed into sinusoidal components. The amplitudes are plotted to form a spectrum of synaptic current. B–D, Top traces, Example synaptic current waveforms calculated from the spike times of a prototypic GPe neuron firing spontaneously (B) or with oscillations at 34 Hz (C) and 85 Hz (D). Bottom traces, Corresponding current spectra. E, The amplitude of spectral peaks at the oscillation frequency for a range of oscillation frequencies, calculated either without depression or synaptic amplitude fluctuations, with depression but no synaptic fluctuations, and with depression and synaptic fluctuations. The values without depression were scaled by the average steady-state depression at the cell’s spontaneous firing rate. F, Average inhibitory current generated by the synaptic conductance for each of the 20 GPe neurons, each firing at its spontaneous rate. G, Background noise, measured as SD of the synaptic current waveform, for each of the GPe neurons in the sample.


