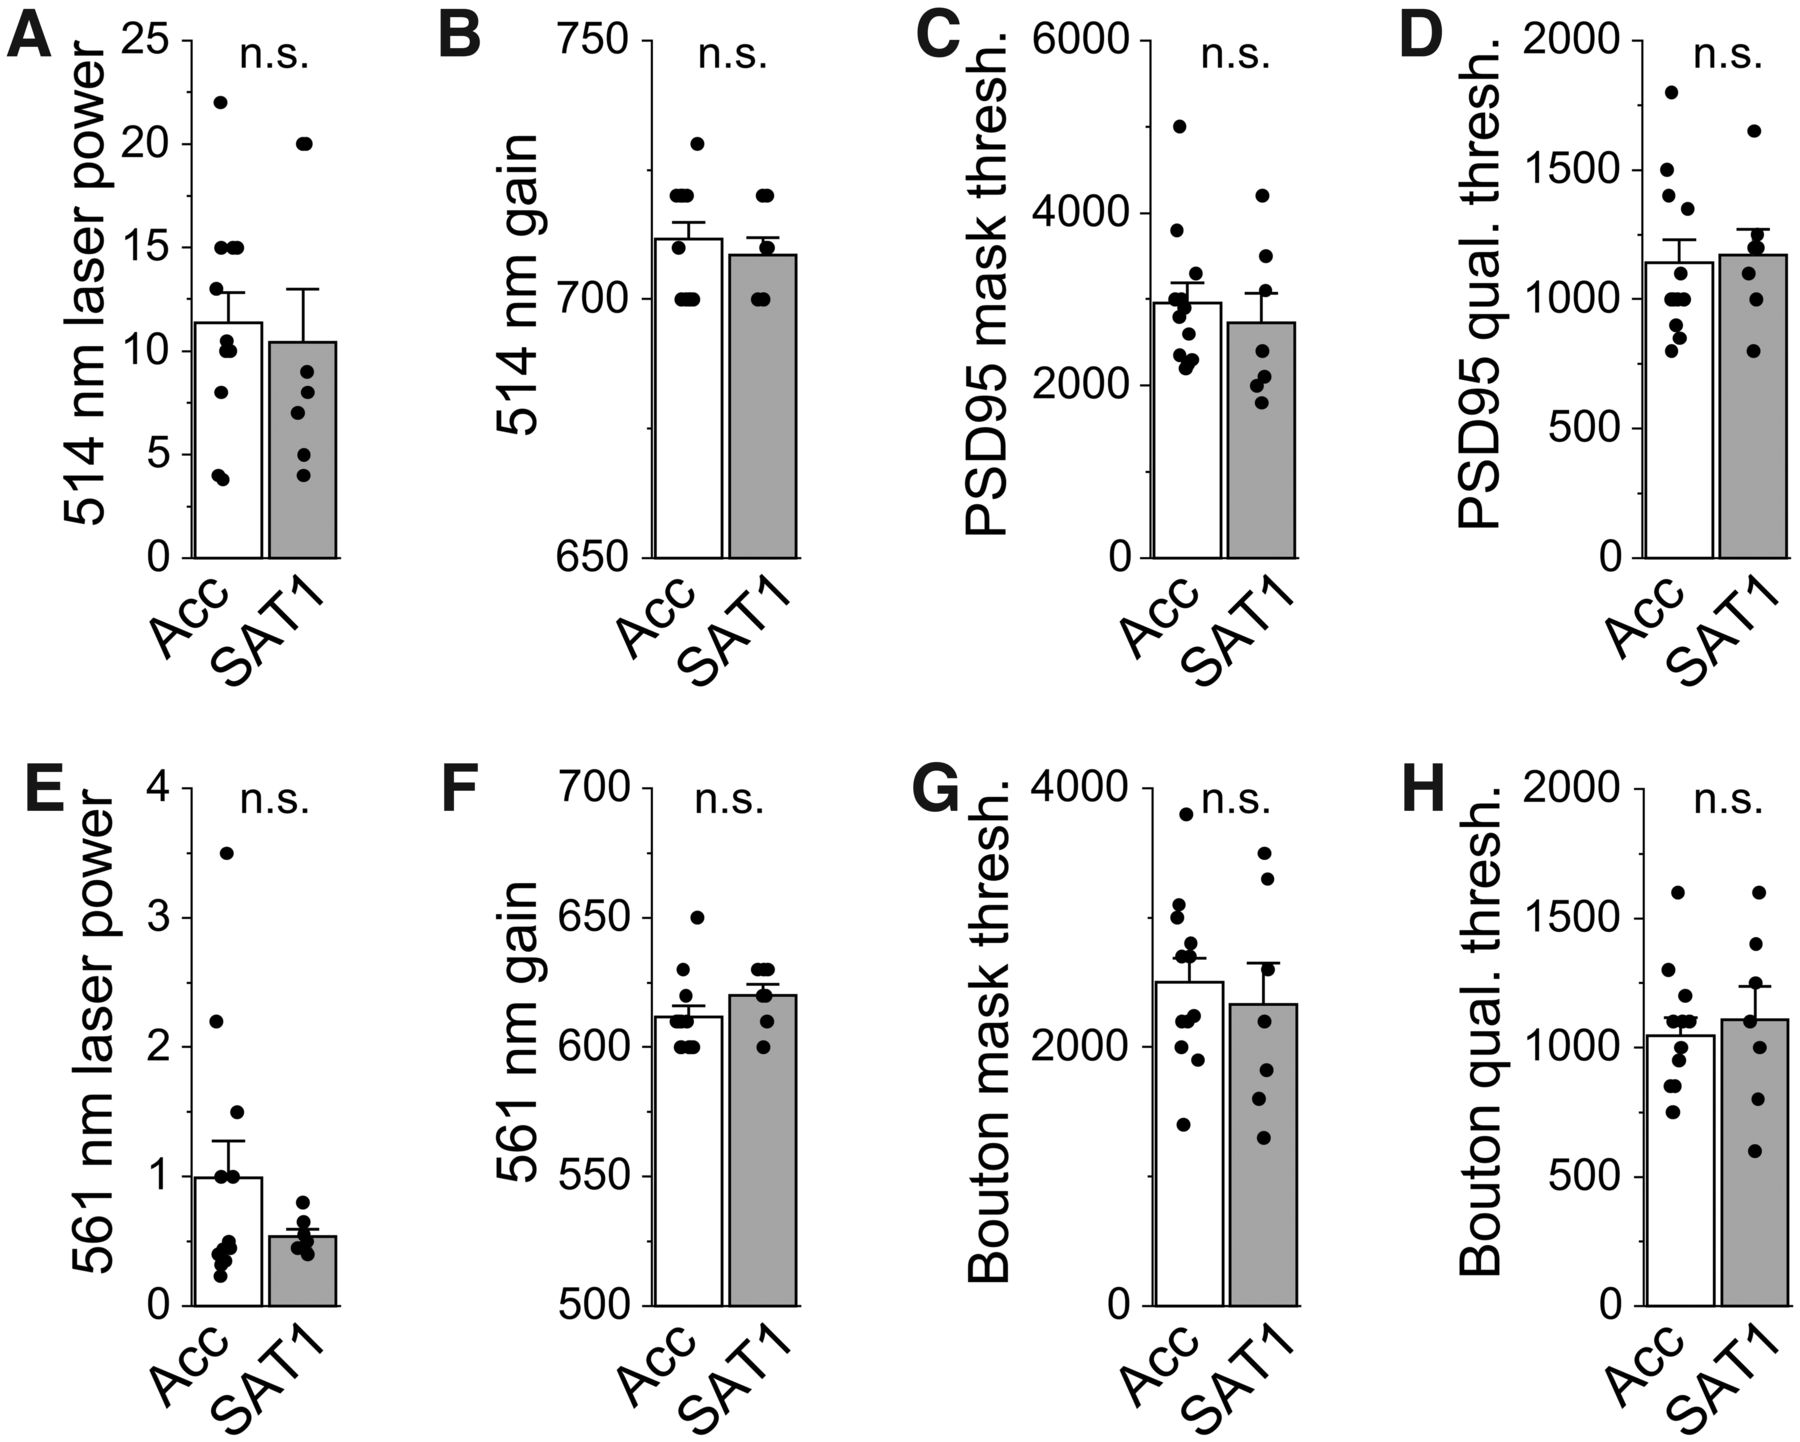
Imaging and analytical parameters do not differ between experimental groups. All comparisons were made for L5a images from individual animals from acclimation control (Acc; white) and SAT1 (gray) experimental groups. A–F, Each dot represents value for individual animal + SEM; bar graphs represent mean + SEM. N = 12 Acc and 7 SAT1 mice. A, Laser intensities for excitation of PSD95.FingR-Citrine fluorescence. Unpaired t(17) = 0.34; p = 0.74. B, Camera gain setting for acquiring PSD95.FingR-Citrine fluorescence. Unpaired t(17) = 0.62; p = 0.54. C, Imaris watershedding algorithm threshold for reconstructing PSD95.FingR-Citrine puncta contours. Unpaired t(17) = 0.58; p = 0.57. D, Imaris object-splitting algorithm threshold for separating fused PSD95.FingR-Citrine puncta. Unpaired t(17) = −0.22; p = 0.83. E, Laser intensities for excitation of tdTomato-labeled POm bouton fluorescence. Unpaired t(17) = 1.19; p = 0.25. F, Camera gain setting for acquiring tdTomato-labeled POm bouton fluorescence. Unpaired t(17) = −0.1.24; p = 0.23. G, Imaris watershedding algorithm threshold for reconstructing tdTomato-labeled POm bouton contours. Unpaired t(17) = 0.50; p = 0.62. H, Imaris object-splitting algorithm threshold for separating fused tdTomato labeled POm bouton. Unpaired t(17) = −0.45; p = 0.66.


