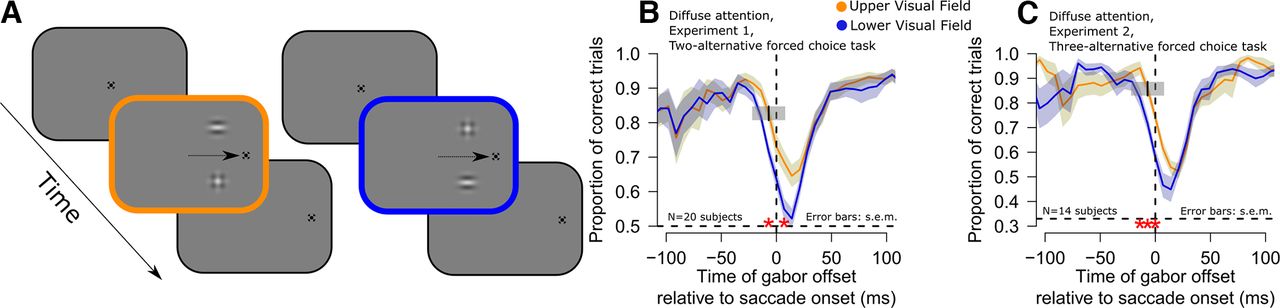
Better peri-saccadic orientation identification performance in the upper visual field. A, Subjects generated ∼12° horizontal saccades (schematized by an arrow in the figure). At different times relative to saccade onset, two image patches appeared briefly, one above and one below the horizontal meridian (Materials and Methods). One patch was an oriented gabor grating (the target), and the other was a distractor with no orientation information. The subjects reported the orientation of the target gabor, and we assessed whether the subjects’ responses were better when the target appeared in the upper (yellow) versus lower (blue) visual field. B, Time course of orientation identification performance relative to saccade onset for targets in the upper (yellow) or lower (blue) visual field in experiment 1 (diffuse attention condition; Materials and Methods). Red asterisks indicate significant differences between the two curves (GLMM, main effect of target gabor grating location, p < 0.01; error bars denote SEM). C, Similar analysis for experiment 2 (diffuse attention condition; Materials and Methods). Here, chance performance was at 0.33 proportion of correct trials, instead of 0.5 (see dashed horizontal lines in each panel). In both cases, peri-saccadic orientation identification performance was significantly higher in the upper rather than the lower visual field. Figures 2, 3 describe eye movement and visual stimulation controls that we analyzed to rule out other potential alternative explanations for different perceptual performance in the upper and lower visual fields. Also note that when computing the average peri-saccadic time course, we used a moving time window of 30 ms (Materials and Methods), and we used window’s center when plotting. For example, the discrimination accuracy at time −7 ms included trials within the interval −22–8 ms (that is, the interval also included trials where the gabor grating was projected on screen while the eyes started moving toward the landing fixation point). We have added a visual representation of a single bin as a small gray box in panels B, C, centered at the time of −7 ms, to clearly showcase the temporal extent of the bin.


