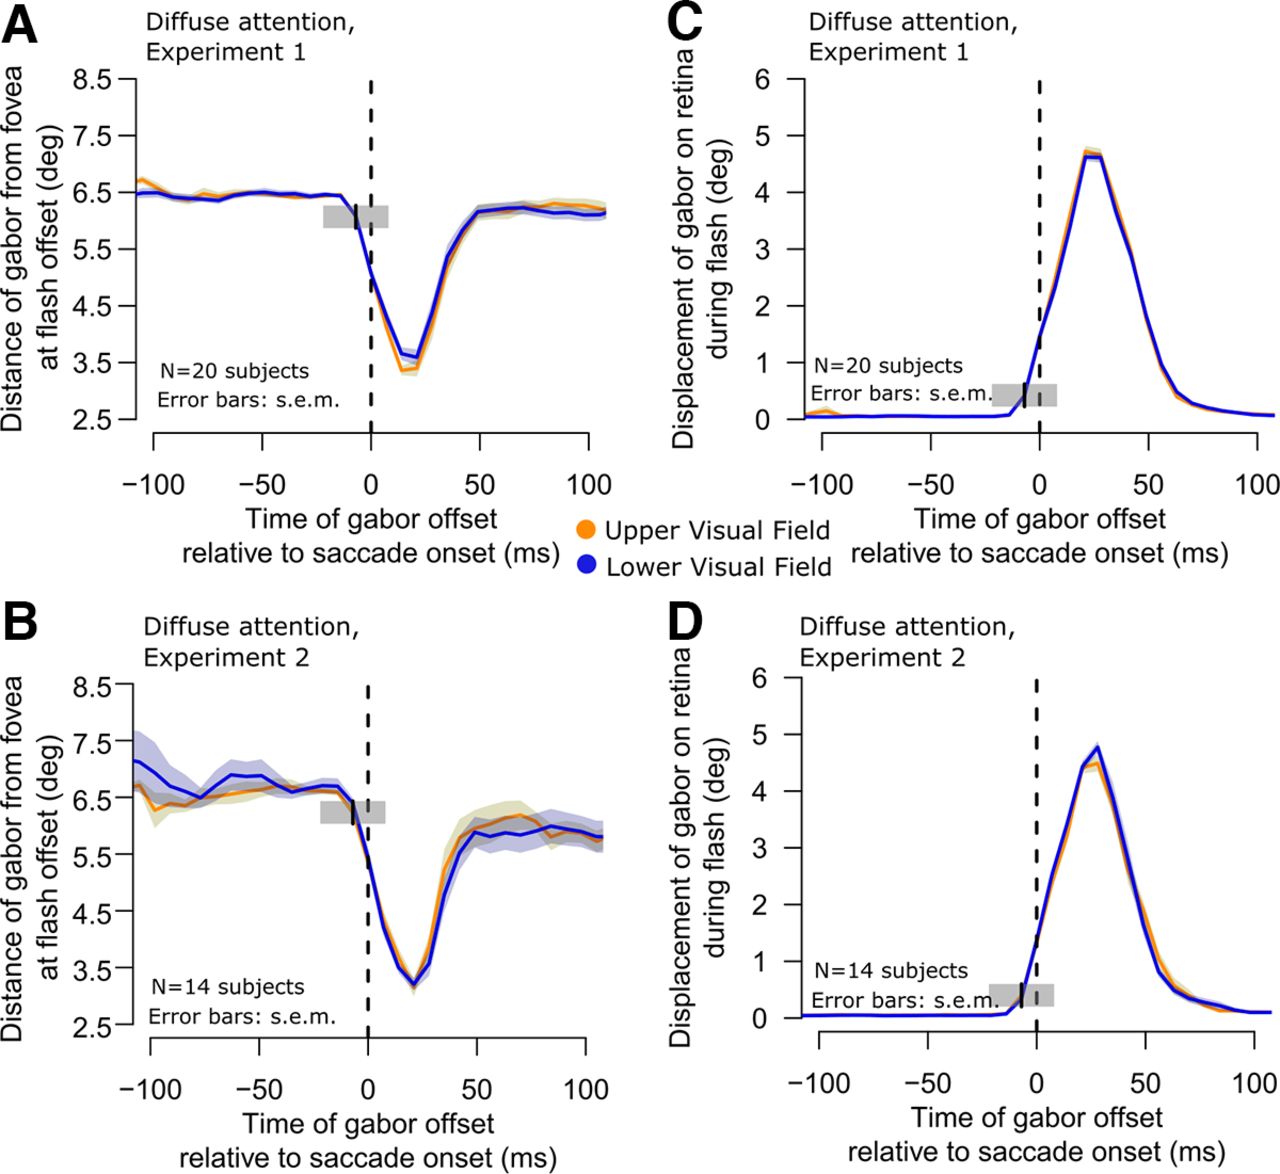
Similarity of retinal stimulation by the flashed gabor patches in the upper and lower visual field target trials. A, B, In each experiment, we plotted the distance of the target gabor grating from the fovea as a function of time from saccade onset. During the saccade, the patches were closest to the fovea because the flash was always midpoint along the saccade path and timed to frequently occur peri-saccadically. However, and most critically, the distance to the fovea was not different for upper and lower visual field targets (compare yellow and blue curves in each panel). Therefore, the results of Figure 1 were not because of a visual acuity benefit for upper visual field targets because of retinal eccentricity. Error bars denote SEM. C, D, Similar analysis but for the retinal slip of the images during their onset (that is, the displacement of the gabor during its presentation). Because the eye was moving during a saccade, the grating slipped in position on the retina. However, once again, such retinal slip was the same for upper (yellow) and lower (blue) visual field targets in both experiments. Note that the gray shaded regions with center at time −7 ms are similar to those shown in Figure 1, and they illustrate the extent of our binning window for one example sample point. They also explain why the retinal slip may have appeared to start increasing even before saccade onset (this was only a consequence of our temporal binning windows and not because of erroneous saccade onset detection).


