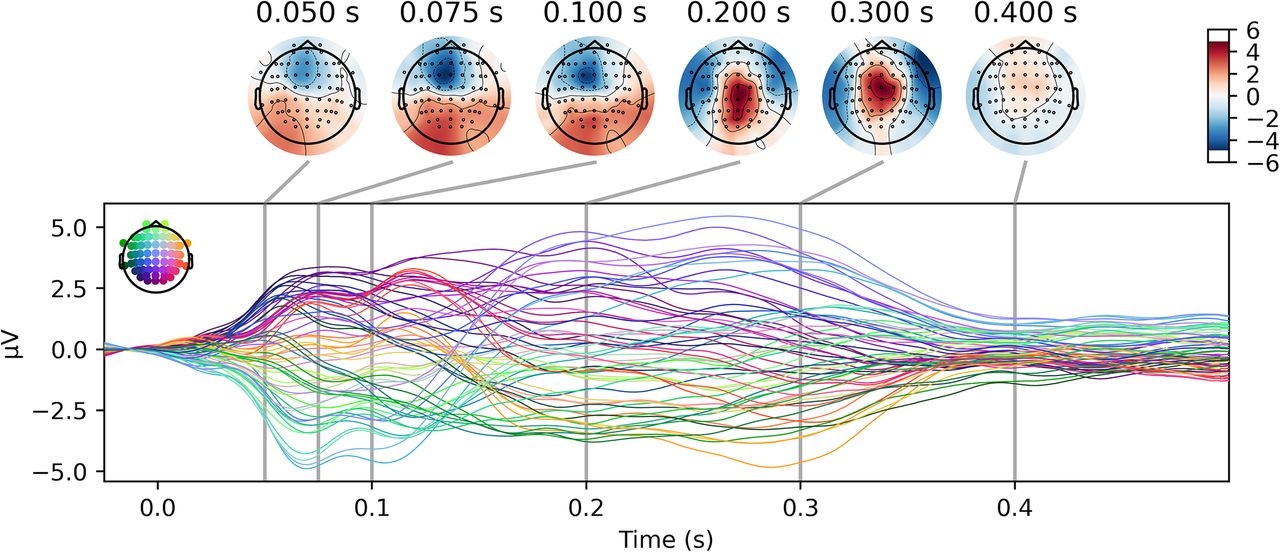
Figure 5.
The grand-average evoked EEG response to muscle stimulation. The depicted waveform was computed by averaging the preprocessed (1-30 Hz filtered) data across stimulation trials within each subject, and then averaging the resulting subject-level EEG responses to obtain a group-level average.


