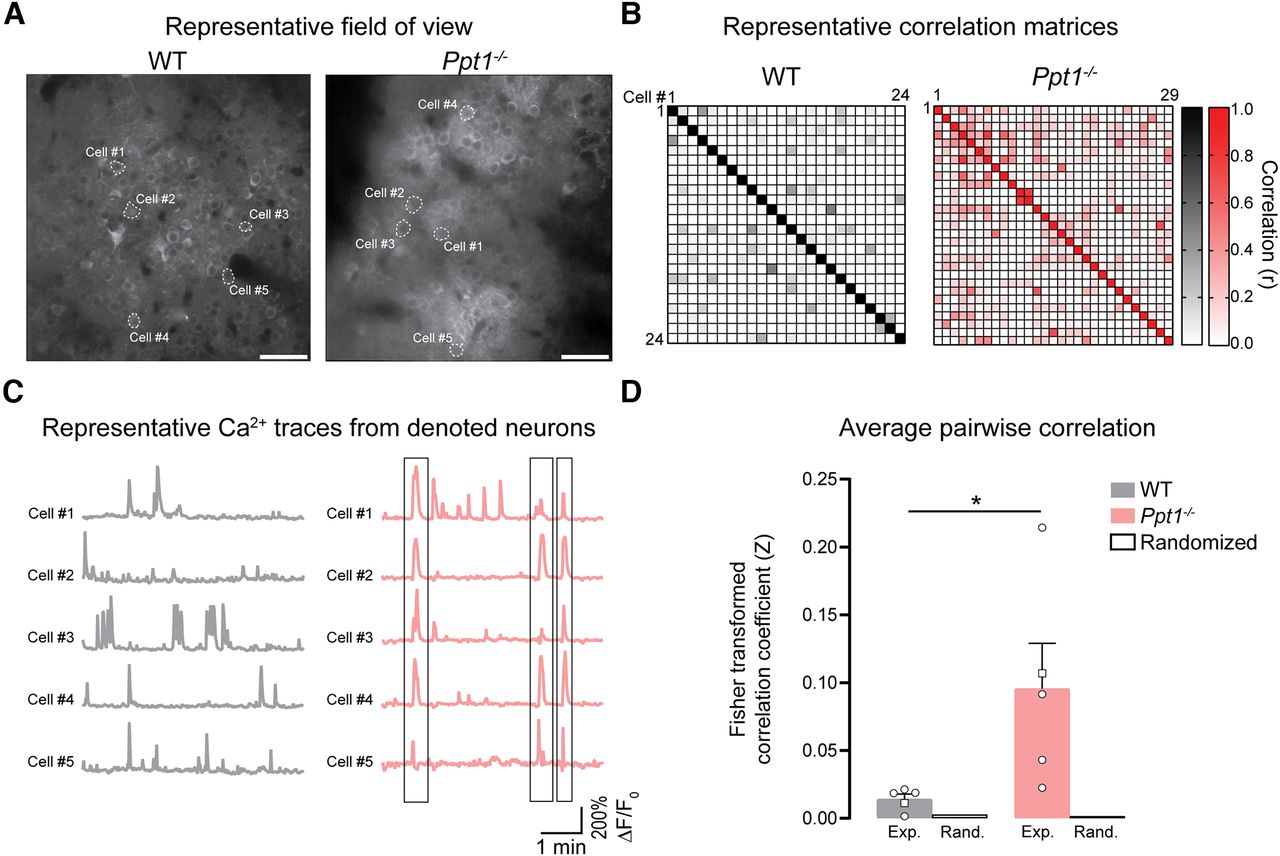
In vivo imaging reveals coordinated calcium activity in the visual cortex of Ppt1−/− mice. A, Representative calcium imaging video still frames of layer 2/3 cortical neuronal somata from a WT and Ppt1−/− mouse. Scale bar = 50 µm. B, Representative ΔF/F0 traces for selected cells in each video. Note the coactivity of multiple cells in the Ppt1−/− brain demarked by gray boxes. All cells in each frame (not just selected cells) were used for further analyses in panels C and D. C, Correlation matrices of the deconvolved calcium activity (Persons r correlation values) of all cells in the representative videos (Movie 5, Movie 6). Each square represents 1 cell, as denoted in the top left. D, Averaged pair-wise correlation value (Fisher transformed) for all videos, from each animal (experimental data; Exp.) compared with average correlations produced from the same Ca2+ transient datasets randomized (Rand). Each point represents the average for one mouse. t test: *p = 0.0419. Square points denote the representative correlation matrices from panel C. n = 5 mice/group. Data represent mean ± SEM.


