HERV-K (HML-2) Envelope Protein Induces Mitochondrial Depolarization and Neurotoxicity via Endolysosome Iron Dyshomeostasis
- Peter W. Halcrow1,
- Darius N.K. Quansah1,*,
- Nirmal Kumar1,*,
- Joseph P. Steiner2,
- Avindra Nath2, and
- Jonathan D. Geiger1
- 1Department of Biomedical Sciences, University of North Dakota School of Medicine and Health Sciences, Grand Forks, North Dakota 58202
- 2Section for Infections of the Nervous System, National Institute of Neurological Disorders and Stroke, National Institutes of Health, Bethesda, Maryland 20892
-
Author contributions: P.W.H., J.P.S., A.N., and J.D.G. designed research; P.W.H., D.N.K.Q., and N.K. performed research; P.W.H., D.N.K.Q., N.K., A.N., and J.D.G. analyzed data; P.W.H. and J.D.G. wrote the paper.
Abstract
Human endogenous retroviruses (HERVs) are associated with the pathogenesis of amyotrophic lateral sclerosis (ALS); a disease characterized by motor neuron degeneration and cell death. The HERV-K subtype HML-2 envelope protein (HERV-K Env) is expressed in the brain, spinal cord, and cerebrospinal fluid of people living with ALS and through CD98 receptor-linked interactions causes neurodegeneration. HERV-K Env-induced increases in oxidative stress are implicated in the pathogenesis of ALS, and ferrous iron (Fe2+) generates reactive oxygen species (ROS). Endolysosome stores of Fe2+ are central to iron trafficking and endolysosome deacidification releases Fe2+ into the cytoplasm. Because HERV-K Env is an arginine-rich protein that is likely endocytosed and arginine is a pH-elevating amino acid, it is important to determine HERV-K Env effects on endolysosome pH and whether HERV-K Env-induced neurotoxicity is downstream of Fe2+ released from endolysosomes. Here, we showed using SH-SY5Y human neuroblastoma cells and primary cultures of human cortical neurons (HCNs, information on age and sex was not available) that HERV-K Env (1) is endocytosed via CD98 receptors, (2) concentration dependently deacidified endolysosomes, (3) decreased endolysosome Fe2+ concentrations, (4) increased cytosolic and mitochondrial Fe2+ and ROS levels, (5) depolarized mitochondrial membrane potential, and (6) induced cell death, effects blocked by an antibody against the CD98 receptor and by the endolysosome iron chelator deferoxamine. Thus, HERV-K Env-induced increases in cytosolic and mitochondrial Fe2+ and ROS as well as cell death appear to be mechanistically caused by HERV-K Env endocytosis, endolysosome deacidification, and endolysosome Fe2+ efflux into the cytoplasm.
- cell death
- endolysosome iron
- HERV-K envelope protein
- mitochondrial dysfunction
- neurotoxicity
- reactive oxygen species
Significance Statement
Human endogenous retroviruses (HERVs) represent 8% of genomic DNA, play roles in brain development, and are silenced in the adult brain. HML-2 envelope protein (HERV-K Env) activation is found in the brain, spinal cord, and cerebrospinal fluid in an amyotrophic lateral sclerosis (ALS) subgroup and is implicated in ALS pathogenesis. HERV-K Env-induced neurotoxicity increases reactive oxygen species (ROS) levels but by unclear mechanisms. We showed that HERV-K Env is endocytosed, deacidified endolysosomes, decreased endolysosome Fe2+ levels, increased cytosol and mitochondria Fe2+ and ROS levels, depolarized mitochondrial membrane potential, and induced cell death, effects that were blocked by a CD98 receptor antibody and the endolysosome iron chelator deferoxamine. Identifying mechanisms of HERV-K Env-induced toxicity may identify targets against which therapeutics can be developed in HERV-K Env-associated diseases.
Introduction
Human endogenous retroviruses (HERVs) represent ∼8% of our genomic DNA. These viruses were endogenized into the human genome over a million years ago and have acquired multiple mutations. HERV-K was recently subclassified into HML-1 to HML-11, and HML-2 was found to be relatively intact with open reading frames for all the viral proteins. HERVs have critical roles in early embryogenesis and brain development but are silenced in the adult brain. Re-activation of these viral genes has been linked to the pathogenesis of cancer and neurodegenerative disease implications (Garcia-Montojo et al., 2018). In particular, the HML-2 envelope protein (HERV-K Env) was implicated in the pathogenesis of amyotrophic lateral sclerosis (ALS) (Li et al., 2022a), a disorder characterized by motor deficits, motor neuron degeneration, and neuronal cell death (Celestin et al., 2021). Activation of HERV-K Env was found in the brain, spinal cord, cerebrospinal fluid, and plasma of a subgroup of ALS patients (Li et al., 2015, 2022b; Steiner et al., 2022). Further, transgenic animals expressing HERV-K Env in neurons develop degeneration of motor neurons, loss of motor cortex volume, and decreased synaptic activity (Li et al., 2015). However, the mechanisms by which HERV-K Env induces neurotoxicity remain unclear.
Central to neurotoxicity is mitochondrial dysfunction and HERV-K Env induced mitochondrial dysfunction and cell death (Steiner et al., 2022). Mitochondrial membrane potential (Δψm) depolarization is one of the earliest events leading to cell death (Vayssiere et al., 1994; Cohen, 1997), and depolarization of Δψm was observed in motor neurons exposed to cerebral spinal fluid (CSF) from ALS patients (Sharma et al., 2016). HERV-K Env knock-out cells significantly reduced reactive oxygen species (ROS) levels (Ko et al., 2021), but by unclear mechanisms.
The cell surface binding partner of HERV-K Env is CD98 receptors (Steiner et al., 2022). CD98 is an endogenous cargo protein that enables clathrin-independent endocytosis (Eyster et al., 2009), and extracellularly released HERV-K Env interacts with CD98 receptors and causes neurotoxicity (Steiner et al., 2022). However, HERV-K Env endocytosis via CD98 receptors has not been reported, and the identification and characterization of the mechanisms by which HERV-K Env complexed with CD98 receptors mediate neurotoxicity remain unknown.
Increased oxidative stress has been implicated in the pathogenesis of ALS (Barber et al., 2006), and ferrous iron (Fe2+) via Fenton-like chemistry generates ROS (Fenton, 1894). Endosomes and lysosomes (endolysosomes) are “master regulators of iron metabolism,” contain high concentrations of readily releasable Fe2+, and are central to iron trafficking and redox signaling (Rizzollo et al., 2021; Halcrow et al., 2022). Endolysosomes have an acidic lumen, and endolysosome deacidification decreases levels of Fe2+ in endolysosomes and increases levels of Fe2+ and ROS in cytosol and mitochondria (Nash et al., 2019; Halcrow et al., 2021). HERV-K Env is an arginine-rich protein, and arginine-rich proteins that are endocytosed deacidify endolysosomes (Mayer et al., 1999; Ledder et al., 2017). Accordingly, it is important to determine mechanisms by which HERV-K Env is endocytosed (Dewannieux et al., 2005) and whether HERV-K Env-induced neurotoxicity is downstream of endolysosome deacidification, release of endolysosome Fe2+, and resulting increases in levels of ROS.
Here, using SH-SY5Y human neuroblastoma cells and primary cultures of human cortical neurons (HCNs), we showed that HERV-K Env (1) is endocytosed via CD98 receptors, (2) concentration dependently deacidified endolysosomes, (3) decreased endolysosome Fe2+ concentrations ([Fe2+]el) in SH-SY5Y cells and in HCNs, (4) increased levels of Fe2+ and ROS in cytosol and mitochondria, (5) depolarized mitochondrial membrane potential, and (6) induced cell death, effects that were blocked by an antibody against the CD98 receptor and by deferoxamine (DFO), an endolysosome iron chelator. Thus, HERV-K Env-induced increases in cytosolic and mitochondrial Fe2+ and ROS as well as cell death appear downstream of HERV-K Env endocytosis, endolysosome deacidification, and Fe2+ efflux from endolysosomes. Increased understanding of HERV-K Env-induced inter-organellar signaling of Fe2+ and identifying the mechanisms by which HERV-K Env mediates toxicity may help in identifying initiating factors linked to HERV-K Env-associated diseases and the pathogenesis of ALS (Mead et al., 2023).
Materials and Methods
Cell cultures
Human-derived neuroblastoma SH-SY5Y cells were cultured in Dulbecco's Modified Eagle Medium (1 × DMEM, Invitrogen, catalog #11995) containing 10% fetal bovine serum (FBS, ThermoFisher) and 1% penicillin/streptomycin solution (Invitrogen, catalog #15140122). SH-SY5Y cells were grown in T75 flasks and sub-cultured as needed at 70–80% confluency. The cells were passaged every 3–4 d using 0.025% trypsin (Invitrogen) and did not exceed 10 passages.
HCNs (Innoprot catalog #P10152) were cultured in Neuronal Medium (Innoprot catalog #P60157) containing 1% neuronal growth supplement (NGS, Innoprot Lot #35502) and 1% penicillin/streptomycin solution (P/S solution, Innoprot Lot #8490722). HCNs were seeded in 35 mm2 glass-bottom dishes at 100,000 cells/dish and fresh neuronal medium was added every 2 d until experimentation. The HCNs were only seeded once in 35 mm2 glass-bottom dishes and not further passaged. These HCNs were isolated from a healthy human brain cortex and are not recommended for expanding or long-term cultures since the cells do not proliferate in culture. Based on our MAP2 staining experiments, the isolated primary cultures were 99% purely cortical neurons; however, the age and sex of the human the cells were isolated from are not known because the company (Innoprot) did not provide that information. Both SH-SY5Y cells and HCNs were maintained at 37°C in a humidified incubator atmosphere containing 5% CO2.
Reagents and cell treatments
The recombinant HERV-K (HML-2)-Env protein from MyBioSource (#MBS1391552) used in all experiments contained an intact surface unit domain and a transmembrane domain (amino acids 90–632 of consensus sequence). Several separate aliquots of HERV-K Env were prepared and stored at −4°C to prevent potential problems with multiple freezing and thawing. Cells were treated with different concentrations of HERV-K Env ranging from 10 to 100 nM. After initial experiments with varying concentrations, the 30 nM concentration of HERV-K Env was selected for further experimentations. Heat-inactivated HERV-K Env (95°C for 15 min) and buffer alone were used controls. To block HERV-K Env-mediated effects, a HERV-K/antibody complex (denoted as K01 + HERV-K Env) was produced by incubating HERV-K Env (30 nM) with monoclonal antibody K01 (3 μg/ml) at 4°C for 2 h. K01 monoclonal antibody was obtained from GeNeuro Inc (Steiner et al., 2022). Anti-CD98 antibody (Abcam, catalog #ab193364) and recombinant Alexa Fluor 647 anti-6X His-tag antibody (Abcam, catalog #ab237337) were purchased from Abcam. Normal mouse IgG1 Alexa Fluor 488 (Santa Cruz Biotechnology, catalog #sc-3890) was purchased from Santa Cruz Biotechnology. CD98 mAb was labeled with secondary antibody normal mouse Alexa Fluor 488 (Santa Cruz Biotechnology, catalog #sc-3890).
Monoclonal antibody-mediated inhibition of CD98 receptor and HERV-K endocytosis
SH-SY5Y cells were added to 35 mm2 dishes at a density of 7 × 10⁴ cells/dish and primary cultures of HCNs seeded in 35 mm2 dishes were used for experimentation. Cells were preincubated with mAb against CD98 at 37°C for 30 min. Next, cells were incubated with HERV-K Env tagged with recombinant Alexa Fluor 647 anti-6X His-tag antibody (Abcam, catalog #ab237337) for 1 h at 37°C. After 1 h, cells were washed twice with PBS and then stained with 50 nM LysoTracker Green DND 26 (Invitrogen, L7526) and 1 μg/ml Hoechst 33342 (ThermoFisher, catalog #H3570) for 10 min at 37°C. Cells were washed twice with PBS and then images were taken using our spinning-disk confocal microscope (Oxford Instruments). Imaris software version 9.9.1 (Oxford Instruments) was used to reconstruct the images and data were represented as mean fluorescence intensity (MFI).
Microtubule associated protein 2 (MAP2) labeling of HCNs: The neuronal medium for primary cultures of HCNs was replaced with 4% paraformaldehyde (PFA) for 5 min at room temperature and then was removed and replaced with 2 ml of ice-cold methanol for 2 min. Methanol was then removed, and the cells were washed three times with 2 ml of PBS; care was taken to avoid detaching the cells. The cells were blocked with 2 ml of 1% goat serum (Jackson ImmunoResearch Laboratories Inc.) and incubated for 30 min and then the cells were incubated with primary MAP-2 chicken antibody (catalog number CH22103, Neuromics Antibodies Edina, MN 55439) for 1 h at 37°C in a cell culture incubator. After incubation, the primary antibody was removed and the cells were gently washed three times with 2 ml of warm PBS. The cells were then incubated with 1 ml (1:2,000) of fluorescently labeled secondary antibody (Goat anti-Chicken IgY, FITC, catalog number PA1-28794, ThermoFisher Scientific) at 37°C for 1 h. The secondary antibody was replaced with 2 ml of PBS, and the nuclei were stained with Hoechst 33342 for 10 min and then gently washed twice with warm PBS. We then acquired the images on our spinning-disk confocal microscope (Oxford Instruments).
Endolysosome pH measurement
Endolysosome pH was determined using LysoSensor Yellow/Blue DND-160 (ThermoFisher, catalog #L7545), a ratiometric dual-excitation dye used to measure pH in acidic organelles independent of dye loading efficiency. SH-SY5Y cells were grown in 35 mm2 dishes overnight and then incubated for 5 min at 37°C with media containing 10 µM DND-160. After incubation, the media was replaced with new media, and then images were taken. During imaging, respective treatments were added, while images were acquired in real time. Light emission at 520 nm wavelength in response to excitations for 2 ms at 340 and 380 nm was measured every 10 s using a filter-based microscope imaging system (Zeiss). Using a standard curve as previously described (Hui et al., 2012), we calculated the pH from the ratios of light excitations (340/380 nm) verses light emission (520 nm). Using the formula pH = −log[H+], we calculated changes in proton concentrations within endolysosomes. An additional method for determining endolysosome pH was used with LysoSensor DND-189 (ThermoFisher, catalog #L7535, green) colocalized with LysoTracker Red (ThermoFisher, catalog #L7528, DND-99). With a pKa of ∼5.2, LysoSensor Green DND-189 becomes more fluorescent in acidic environments. Primary cultures of HCNs were incubated for 10 min at 37°C with media containing 1 µM DND-189 and 100 nM of DND-99. After incubation, the media was replaced with 1× PBS, and then images were taken. During imaging, respective treatments were added, and images were acquired in real time. Light emission at 505 nm wavelength in response to excitation at 443 nM was measured every 5 min using a confocal microscope (Zeiss 800). Using a standard curve, we calculated pH from light emission (505 nm).
Endolysosome ferrous iron (Fe2±) measurement
Labile ferrous iron (Fe2+) in endolysosomes was detected using the fluorescence probe FeRhoNox-1 (Goryo Chemicals, catalog #GC901) as described recently by us (Halcrow et al., 2022). SH-SY5Y cells were added to 35 mm2 dishes at a density of 7 × 10⁴ cells/dish and primary cultures of HCNs added to 35 mm2 dishes at a density of 100,000 cells/dish were incubated at 37°C prior to being taken for experimentation. Cells were incubated with 10 µM FeRhoNox-1 at 37°C for 1 h, stained with 50 nM LysoTracker Green DND 26 (ThermoFisher Scientific, L7526) and 1 μg/ml Hoechst 33342 (ThermoFisher, catalog #H3570) for 10 min at 37°C and then washed three times with 1 × PBS. Images were taken using our spinning-disk confocal microscope (Oxford Instruments). To determine the extent to which endolysosome Fe2+ was responsible for downstream effects, cells were preincubated with an endolysosome-specific iron chelator DFO (50 µM) for 1 h prior to the various treatments such as HERV-K Env. Imaris software version 9.9.1 (Oxford Instruments) was used to reconstruct the images and data were represented as MFI.
Cytosolic ROS measurement
Levels of cytosolic ROS were measured in SH-SY5Y using approximately 6 × 10⁵ cells/well following 1 h treatments of HERV-K Env or preincubation with DFO for 1 h. Following the incubations, cells were washed three times with PBS, 10 µM CM-H2DCFDA (Invitrogen, catalog #C6827) was added, and cells were incubated for 30 min at 37°C and 5% CO2; cells were then washed three times with PBS to remove extracellular stain. Unstained cells were used as negative controls to establish background fluorescence and stained cells incubated with 250 µM H2O2 were used as positive controls. MFI was acquired on a minimum of 10,000 cells per condition using an Attune NxT flow cytometer (ThermoFisher).
Mitochondrial Fe2± measurement
Mitochondrial Fe2+ levels were measured using rhodamine B 4-[(2,2′-bipyridin-4-yl) aminocarbonyl] benzyl ester (RDA) (Guidechem, catalog #952228-30-7). SH-SY5Y cells were added at a density of about 6 × 10⁵ cells/well to 12-well plates and incubated at 37°C and 5% CO2 overnight prior to preincubation with DFO (50 μM) for 1 h. Following treatments with HERV-K Env and other controls for 1 h, cells were washed three times with 1× PBS and incubated with PBS containing 100 nM RDA dye for 20 min at 37 °C in a 5% CO2 incubator. Cells were washed with PBS to remove extracellular dye. A minimum of 10,000 cells were collected and RDA fluorescence was analyzed at an excitation of 562 nm and an emission of 598 nm. Unstained and stained (no treatment) cells were used to setup settings and cells treated with FeCl3 were used as positive controls. MFI was determined by flow cytometry (Attune NxT, ThermoFisher). For primary cultures of HCNs, following treatments with HERV-K Env and other controls for 1 h, cells were washed three times with 1× PBS and incubated with neuronal medium containing 100 nM RDA dye, 100 nM MitoTracker (green), and Hoechst 33342 for 20 min at 37°C in a 5% CO2 incubator. Cells were washed with PBS to remove extracellular dye and then imaged using spinning-disk confocal microscopy (Oxford Instruments).
Mitochondrial ROS measurement
SH-SY5Y cells (6 × 10⁵ cells/well) were added into 12-well plates and incubated at 37°C and 5% CO2 overnight prior to being taken for experimentation. Cells were preincubated with DFO (50 μM) for 1 h; then cells were treated with respective treatments for 1 h, washed gently three times with PBS, and incubated with 2.5 µM of MitoSOX (Invitrogen, catalog #M36008) for 20 min in a 37°C and 5% CO2 incubator. Cells were rinsed three times with PBS, and then fresh PBS was added to the wells, and a minimum of 10,000 cells per condition were placed into Eppendorf tubes for determination of MitoSOX fluorescence at an excitation of 510 nm and an emission of 580 nm by flow cytometry (Attune NxT, ThermoFisher). For primary cultures of HCNs in 35 mm2 dishes, cells were preincubated with DFO (50 μM) for 1 h, then cells were treated with respective treatments for 1 h, washed gently three times with PBS, and incubated with 2.5 µM of MitoSOX (Invitrogen, catalog #M36008) for 20 min in a 37°C and 5% CO2 incubator. Cells were rinsed three times with PBS, and then fresh PBS was added to each dish and then imaged using our spinning-disk confocal microscope (Oxford Instruments).
Mitochondrial membrane potential
SH-SY5Y cells were seeded to 12-well plates at a density of 6 × 10⁵ cells/well and were incubated overnight at 37°C and 5% CO2. Cells were preincubated with DFO (50 μM) for 1 h, then treated with respective treatments for 1 h, washed gently three times, and stained with 100 nM CMXROS (red) (Invitrogen, catalog #M7512) for 30 min in a 37°C and 5% CO2 incubator. Cells were washed three times with warm 1 × PBS and re-suspended in 0.5 ml PBS, and fluorescence was determined using a flow cytometer (Attune NxT, ThermoFisher) at an excitation of 579 nm and an emission of 599 nm. Additionally, confocal microscopy was used to measure mitochondrial membrane potential. SH-SY5Y cells were added to 35 mm2 dishes and incubated overnight in an incubator kept at 37°C and 5% CO2. Cells were treated with respective drugs for 1 h, washed gently three times with PBS, and incubated with 100 nM CMXROS (red) and 200 nM MitoTracker Green FM (Invitrogen, catalog #M7514) for 30 min in a 37°C and 5% CO2 incubator. Cells were washed three times with PBS, stained with 1 μg/ml Hoechst 33342 for 10 min, washed with PBS three times, and imaged using confocal microscopy (Zeiss 8,000) at an excitation of 579 nm and an emission of 599 nm.
Neurite length assay
The neurite length of primary HCNs was determined using MemBrite Fix Cell Surface Staining Kits (Biotium, catalog #30093) using our spinning-disk confocal microscope (Oxford Instruments). MemBrite Fix Cell Surface Staining is a fluorescent dye that binds to proteins on the surface of live cells and does not allow the binding to lipids and was used to measure retraction or extension of neurites. Primary cultures of HCNs were added to 35 mm2 dishes at a density of 100,000 cells/dish and incubated at 37°C prior to experimentation. Cells were treated for 24 h, then the media was removed and a MemBrite prestaining solution was added for 5 min in a 37°C and 5% CO2 incubator. After 5 min, the MemBrite prestaining solution was removed and the MemBrite Fix Dye was added for 5 min at 37°C before the cells were finally washed with PBS three times and imaged using confocal microscopy (Oxford Instruments) at an excitation of 488 nm and an emission of 515 nm.
Cell death assay
The percentage of SH-SY5Y cell death was determined using propidium iodide (PI) staining solution (BD Biosciences, catalog #556463) by flow cytometry according to the company protocol. Briefly, SH-SY5Y cells were seeded at 60,000 cells/well in 24-well plates, and cells were treated for 24 h. After 24 h, cells were collected into separate Eppendorf tubes and then centrifuged at 400 × g for 10 min. Next, cell pellets were collected and resuspended in PI staining solution (3 µM PI stain into PBS), mixed, and incubated at room temperature for 15 min under dark conditions. Attune NxT Flow cytometer (ThermoFisher) with channel FL2 was used to detect cell death. Flow cytometry data were collected from a minimum of 50,000 cells per condition. For determination of apoptotic cell death, Apoptosis/Necrosis Detection kits (Abcam, catalog #ab176749) were used. This method simultaneously determines numbers of apoptotic, necrotic, and live cells; 7-AAD labels the nucleus of necrotic cells (red fluorescence), Apopxin Green labels phosphatidylserine (PS) on the cell surface of apoptotic cells (green fluorescence), and CytoCalcein Violet labels the cytoplasm of living cells (blue fluorescence). SH-SY5Y cells were seeded into 35 mm2 glass-bottom dishes at a density of about 1 × 10⁴ cells and incubated overnight at 37°C and 5% CO2. Cells were treated with respective drugs for 24 h and then incubated with a mixture of 200 µl assay buffer, 2 µl Apopxin Green Indicator, 1 µl CytoCalcein 450, and 1 µl 7-AAD at room temperature for 45 min in the dark. To determine ferroptotic cell death after 24 h, treated SH-SY5Y cells were stained with 10 µM of C11-BODIPY 581/591 C11 (Invitrogen, catalog #D3861) for 30 min at 37°C as a measure of lipid peroxidation. Cells were washed three times with PBS, and images were acquired using a spinning-disk confocal laser microscope (Oxford Instruments). In our study, the plasma membrane appears “leaky” only after 24 h of HERV-K Env treatment, yet the membrane-impermeable dye 7-AAD (1.3 KDa) did not permeate the membrane. Apopxin Green (36 KDa) is also membrane impermeable and is much larger than 7-AAD. Because our studies did not observe any significant increases in 7-AAD fluorescence and no significant loss in membrane integrity, we conclude that Apopxin Green likely binds PS on the outer leaflet of the plasma membrane.
Experimental design and statistical analyses
All data were shown as mean (bars) ± standard deviation (SD). Statistical significance between controls and treatments (two groups) were analyzed with a two-tailed Student’s t test, and the statistical significance between three groups or more (multiple groups) was analyzed with one-way ANOVA plus a Tukey’s multiple-comparisons post hoc test. A P value less than 0.05 was considered statistically significant. No predetermined exclusion criteria were performed. Data were assessed for normal distribution by using the Shapiro–Wilk test. The Kruskal–Wallis nonparametric test was used to compare data that had a skewed distribution. No outliers were detected using ROUT method. GraphPad Prism 9.3.1 software was used to perform all statistical analyses. Statistical significance is marked by asterisks as follows: *p < 0.05; **p < 0.01; ***p < 0.001; ****p < 0.0001. Results were based on experiments conducted at least three separate times, each time in triplicate.
Results
Role of CD98 receptors in HERV-K Env endocytosis
HERV-K Env is an arginine-rich viral envelope protein that was shown recently to bind to CD98HC complexed to b1 integrin on the surface of neurons (Steiner et al., 2022). To confirm and extend these findings, we determined the involvement of various endocytic pathways in the uptake and accumulation of HERV-K Env in SH-SY5Y cells and in primary cultures of HCNs. First, we demonstrated that both SH-SY5Y cells and HCNs have CD98 receptors using a CD98 monoclonal antibody (CD98 mAb) labeled with Alexa Fluor 488 (Green) secondary antibody (Figs. 1A, 2B); a primary microtubule associated protein 2 (MAP-2) antibody with a fluorescently labeled secondary antibody (FITC) was used as a neuronal cell marker and identifier of HNCs (Fig. 2A). As expected, HERV-K Env cellular entry was blocked by a 30 min pretreatment with a CD98 monoclonal antibody (CD98 mAb) in both SH-SY5Y cells and HCNs (Figs. 1B, 2C). HERV-K Env (30 nM) complexed with a recombinant Alexa Fluor 647 anti-6X His-tag antibody (red) accumulated in LysoTracker-positive endolysosomes (green); merged images were highly colocalized (yellow) as demonstrated by a statistically significant Pearson’s correlation coefficient of 0.51 (p < 0.0001) in SH-SY5Y cells and 0.50 (p < 0.0001) in HNCs. The accumulation of HERV-K Env in endolysosomes was blocked significantly (p < 0.0001) by a 30 min pretreatment with 0.2 µg CD98 mAb (Figs. 1B,C, 2C,D). Insets in Figures 1 and 2 show single LysoTracker-positive endolysosomes containing HERV-K Env (red) within endolysosomes (green) (Figs. 1B, 2C).

HERV-K Env was endocytosed via CD98 receptors. A, Representative spinning-disk confocal microscope images of CD98 receptors on the surface of SH-SY5Y cells stained with CD98 mAb and Alexa Fluor 488 secondary antibody (green) and Hoechst 33342-positive nuclei (blue). B, Representative spinning-disk confocal microscope images of SH-SY5Y cells stained for HERV-K Env labeled with a recombinant Alexa Fluor 647 anti-6X His-tag antibody (red), LysoTracker-positive endolysosomes (green), and Hoechst 33342-positive nuclei (blue). SH-SY5Y cells were incubated with buffer (CTL), a CD98 monoclonal antibody (CD98 mAb, 30 min preincubation, 0.2 µg), and HERV-K Env (30 nM) for 1 h. Qualitatively, HERV-K Env-induced colocalization with LysoTracker (erged, yellow) was blocked by CD98 mAb. Insets show single LysoTracker-positive (green) endolysosomes containing HERV-K Env (red). C, Quantitatively, HERV-K Env was significantly colocalized with LysoTracker-positive endolysosomes; Pearson's correlation coefficient was 0.51. This colocalization was blocked by CD98 mAb. An ANOVA with Tukey's post hoc multiple-comparisons test was used for analysis. Mean ± SD as well as individual data points were included on each bar. Each data point represented the mean fluorescence of 300 endolysosomes from ten cells performed independently from three cell-culture preparations for each group (n = 9,000). n = total number of endolysosomes for each group plotted. Cells were chosen randomly in the microscope's field of view containing 30 cells and no cells were intentionally excluded. Scale bar = 20 µm. C, F(4,20) = 173.1, p < 0.0001.

HERV-K Env was endocytosed via CD98 receptors in human cortical neurons (HCNs). A, Representative spinning-disk confocal microscope images of HCNs labeled for Alexa Fluor 488 microtubule-associated protein 2 (MAP2). B, Representative spinning-disk confocal microscope images of CD98 receptors on the surface of HCNs stained with CD98 mAb and Alexa Fluor 488 sary antibody (green) and Hoechst 33342-positive nuclei (blue). C, Representative spinning-disk confocal microscope images of HCNs stained for HERV-K Env labeled with a recombinant Alexa Fluor 647 anti-6X His-tag antibody (red), LysoTracker-positive endolysosomes (green), and Hoechst 33342-positive nuclei (blue). HCNs were incubated with buffer (CTL), a CD98 monoclonal antibody (CD98 mAb, 30 min preincubation, 0.2 µg) and HERV-K Env (30 nM) for 1 h. Qualitatively, HERV-K Env colocalized with LysoTracker-positive endolysosomes (Merged, yellow) and this was blocked by CD98 mAb. The insets demonstrate a single LysoTracker-positive endolysosome (green) containing HERV-K Env (red). D, Quantitatively, HERV-K Env was significantly colocalized with LysoTracker-positive endolysosomes; Pearson's correlation coefficient was 0.50. This colocalization was blocked by CD98 mAb. An ANOVA with a Tukey's post hoc multiple-comparisons test was used for analysis. Mean ± SD as well as individual data points were included on each bar. Each data point represented the mean fluorescence of 300 endolysosomes from ten cells performed independently from three cell-culture preparations for each group (n = 9,000). n = total number of endolysosomes for each group plotted. Cells were chosen randomly in the microscope's field of view with 30 cells used for experimentation per group and no cells were intentionally excluded. Scale bar = 20 µm. D, F(3,16) = 59.46, p < 0.0001.
We next determined whether HERV-K Env endocytosis was mediated by endocytic pathways other than CD98 in SH-SY5Y cells. HERV-K Env endocytosis was not significantly affected by 2 h pretreatments of cells with the inhibitor of clathrin-dependent endocytosis dynasore (100 and 200 µM), the inhibitor of macropinocytosis 5-(N-methyl-N-isobutyl) amiloride (500 µM), or the inhibitor of caveolae-dependent pinocytosis (methyl β-cyclodextrin (1 mM) (data not shown). Thus, HERV-K Env clathrin-independent endocytosis was only blocked by CD98 mAb; the IgG1 control did not affect HERV-K Env endocytosis (data not shown).
HERV-K Env-induced endolysosome deacidification was blocked by a CD98 monoclonal antibody
Having shown that HERV-K Env was endocytosed and because arginine-rich proteins can deacidify endolysosomes, it was important to next determine the effects of HERV-K Env on endolysosome pH. HERV-K Env deacidified endolysosome pH quickly and concentration dependently in SH-SY5Y cells; peak effects were observed within 30 min of treatment (Fig. 3A). Controls including buffer, K01 antibody-inactivated HERV-K Env (30 nM), and heat-inactivated HERV-K Env (30 nM) did not significantly change endolysosome pH (Fig. 3B). Significant increases in endolysosome pH were observed with 30 nM (p < 0.001), 50 nM (p < 0.0001) and 100 nM (p < 0.0001) HERV-K Env (Fig. 3C). When calculated on the basis of hydrogen ion concentration [H+], these concentration-dependent changes corresponded to significant decreases in endolysosome [H+] by 10% at 30 nM (p < 0.0001), 19% at 50 nM (p < 0.0001), and 24% at 100 nM (p < 0.0001) HERV-K Env (Fig. 3D). Pretreatment of SH-SY5Y cells and HCNs for 30 min with CD98 mAb (0.2 µg) significantly blocked (p < 0.0001) HERV-K Env-induced endolysosome deacidification; CD98 mAb (0.2 µg) by itself had no effect on endolysosome pH and endolysosome [H+] (Figs. 3E,F, 4A–C). Figure insets show the pH of single LysoTracker-positive endolysosomes (Fig. 4A).

HERV-K Env-induced endolysosome deacidification was blocked by CD98 monoclonal antibody. A, HERV-K Env concentration dependently (10–100 nM) deacidified endolysosome pH in SH-SY5Y cells. HERV-K Env-induced changes in endolysosome pH were shown in real time (arrow indicates time of HERV-K Env application). B, Controls included water alone (buffer), preincubation of HERV-K Env with the K01 antibody for 2 h at 4°C (antibody-inactivated HERV-K Env), and heat-inactivated HERV-K Env (1 h at 100°C) did not significantly change endolysosome pH. C, HERV-K Env concentration dependently increased peak responses of endolysosome pH over 30 min. D, HERV-K Env significantly reduced [H+] concentration dependently. E, Pretreatment of SH-SY5Y cells with CD98 mAb (0.2 µg) blocked HERV-K Env-induced endolysosome deacidification. F, HERV-K Env (30 nM) significantly decreased [H+] and these decreases were blocked by CD98 mAb. Individual data points as well as mean ± SD values were included on each bar. An ANOVA with a Tukey's post hoc multiple-comparisons test was used for analysis. Each data point represented the mean pH measurement of 300 endolysosomes from ten cells performed independently from three cell-culture preparations for each group (n = 9,000). n = the total number of endolysosomes per group. Cells were chosen randomly in the microscope's field of view with 30 cells used for experimentation per group and no cells were intentionally excluded. B, F(2,12) = 1.356, p = 0.2944. C, F(4,20) = 106.2, p < 0.0001. D, F(4,20) = 294.4, p < 0.0001. E, F(3,16) = 36.17, p < 0.0001. F, F(3,16) = 28.47, p < 0.0001.
HERV-K Env-induced endolysosome deacidification was blocked by CD98 mAb in human cortical neurons (HCNs). A, Representative spinning-disk confocal microscope images of HCNs stained with pH-sensitive and endolysosome-specific LysoSensor (DND-189, green), LysoTracker-positive endolysosomes (red), and Hoechst 33342-positive nuclei (blue). HCNs were incubated with buffer (CTL), a CD98 monoclonal antibody (CD98 mAb, 30 min preincubation, 0.2 µg), and HERV-K Env (30 nM) for 1 h. Qualitatively, HERV-K Env significantly decreased LysoSensor fluorescence colocalized with LysoTracker-positive endolysosomes (Merged, yellow) and this was blocked by CD98 mAb. The insets demonstrate a single LysoTracker-positive endolysosome (red) containing LysoSensor (green). B, Quantitatively, HERV-K Env significantly deacidified endolysosome pH with peak responses over 30 min. Pretreatment with CD98 mAb (0.2 µg) blocked HERV-K Env-induced endolysosome deacidification. C, HERV-K Env significantly reduced [H+] concentration dependently. Individual data points as well as mean ± SD values were included on each bar. An ANOVA with Tukey's post hoc multiple-comparisons test was used for analysis. Each data point represented the mean pH measurement of 300 endolysosomes from ten cells performed independently from three cell-culture preparations for each group (n = 9,000). n = the total number of endolysosomes per group. Cells were chosen randomly in the microscope's field of view with 30 cells used for experimentation per group and no cells were intentionally excluded. Scale bar = 20 µm. B, F(3,16) = 47.89, p < 0.0001. C, F(3,16) = 13.13, p = 0.0001.
HERV-K Env-induced decreases in concentrations of endolysosome Fe2± were blocked by the endolysosome iron chelator DFO and by CD98 monoclonal antibody
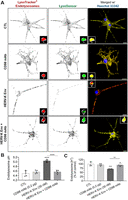
Because deacidification of endolysosomes induces the release of divalent cations from endolysosomes (Qian and Tang, 1995; Christensen et al., 2002; Kurz et al., 2011), we next determined the extent to which HERV-K Env affected concentrations of endolysosome Fe2+ ([Fe2+]el). FeRhoNox-1 is a “turn-on” fluorescence stain that is specific to endolysosome Fe2+ as we have previously determined (Halcrow et al., 2022). HERV-K Env (30 nM) decreased FeRhoNox-1 fluorescence staining for Fe2+ in SH-SY5Y cells and in HCNs after a 1 h incubation time, effects that were blocked by CD98 mAb (0.2 µg) and by DFO (Figs. 5A, 6A). DFO by itself significantly (p < 0.0001) decreased FeRhoNox-1 fluorescence staining for Fe2+ (Figs. 5A,C, 6A,C), but the effects were not additive with HERV-K Env (Figs. 5A,C, 6A,C). Using our previously published quantitation method (Halcrow et al., 2022), HERV-K Env significantly (p < 0.0001) decreased [Fe2+]el from 47.6 µM to 15.6 µM in SH-SY5Y cells and from 39.9 µM to 14.9 µM in HNCs (Figs. 5B,C, 6B,C). Pretreatment of cells with DFO (50 µM) or CD98 mAb (0.2 µg) for 1 h blocked significantly (p < 0.0001) HERV-K Env-induced decreases in [Fe2+]el (Figs. 5B,C, 6B,C). No additional inhibition of HERV-K Env-induced decreases in [Fe2+]el were observed when DFO was coadministered (Figs. 5C, 6C). Pretreatment of cells with CD98 mAb blocks HERV-K Env cell entry, therefore, HERV-K Env cannot deacidify endolysosomes and induce the release endolysosome Fe2+. Pretreatment of cells with DFO chelates endolysosome iron and causes a decrease in endolysosome Fe2+ within endolysosomes; therefore, the treatment of cells with HERV-K Env after DFO results in no Fe2+ being released from endolysosomes as demonstrated by no additional significant decrease in FeRhoNox-1 fluorescence intensity (Figs. 5C, 6C). CD98 mAb (0.2 µg) alone significantly increased [Fe2+]el in SH-SY5Y cells (p < 0.0001) and in HCNs (p = 0.0047) (Figs. 5B, 6B). Figure insets show MFI for FeRhoNox-1 staining (red) in single LysoTracker-positive (green) endolysosomes (Figs. 5A, 6A).

HERV-K Env-induced decreases in levels of endolysosome Fe2± were blocked by the endolysosome iron chelator deferoxamine and a CD98 monoclonal antibody. A, Representative spinning-disk confocal microscope images of SH-SY5Y cells incubated with buffer (CTL), deferoxamine (DFO) (1 h preincubation, 50 µM), HERV-K Env (30 nM), and a CD98 monoclonal antibody (CD98 mAb, 30 min preincubation, 0.2 µg) for 1 h and stained for endolysosome Fe2+ (FeRhoNox-1, red), endolysosomes (LysoTracker, green) and nuclei (Hoechst 33342, blue). The insets demonstrate a single LysoTracker-positive endolysosome (green) containing FeRhoNox-1 stain (red). B, C, Quantitatively, DFO (50 µM) and HERV-K Env (30 nM) significantly decreased FeRhoNox-1 mean fluorescence intensity (MFI); HERV-K Env in combination with DFO had no additive effect. CD98 mAb (0.2 µg) significantly increased FeRhoNox-1 MFI, and CD98 mAb blocked HERV-K Env-induced decreases in FeRhoNox-1 MFI. An ANOVA with Tukey's post hoc multiple-comparisons test was used for analysis. Mean ± SD as well as individual data points were included on each bar. Each data point represented the mean fluorescence of 300 endolysosomes from ten cells performed independently from three cell-culture preparations for each group (n = 9,000). n = total number of endolysosomes for each group plotted. Cells were chosen randomly in the microscope's field of view with 30 cells used for experimentation per group and no cells were intentionally excluded. Scale bar = 20 µm. B, F(3,16) = 136.9, p < 0.0001. C, F(3,16) = 114.0, p < 0.0001.

HERV-K Env-induced decreases in levels of endolysosome Fe2± were blocked by the endolysosome iron chelator deferoxamine and a CD98 monoclonal antibody in human cortical neurons (HCNs). A, Representative spinning-disk confocal microscope images of cultured HCNs incubated with buffer (CTL), deferoxamine (DFO) (1 h preincubation, 50 µM), HERV-K Env (30 nM), and a CD98 monoclonal antibody (CD98 mAb, 30 min preincubation, 0.2 µg) for 1 h and stained for endolysosome Fe2+ (FeRhoNox-1, red), endolysosomes (LysoTracker, green) and nuclei (Hoechst 33342, blue). The insets demonstrate a single LysoTracker-positive endolysosome (green) containing FeRhoNox-1 stain (red). B, C, Quantitatively, DFO (50 µM) and HERV-K Env (30 nM) significantly decreased FeRhoNox-1 mean fluorescence intensity (MFI); HERV-K Env in combination with DFO had no additive effect. CD98 mAb (0.2 µg) significantly increased FeRhoNox-1 MFI, and CD98 mAb blocked HERV-K Env-induced decreases in FeRhoNox-1 MFI. An ANOVA with Tukey's post hoc multiple-comparisons test was used for analysis. Mean ± SD as well as individual data points were included on each bar. Each data point represented the mean fluorescence of 300 endolysosomes from ten cells performed independently from three cell-culture preparations for each group (n = 9,000). n = total number of endolysosomes for each group plotted. Cells were chosen randomly in the microscope's field of view with 30 cells used for experimentation per group and no cells were intentionally excluded. Scale bar = 20 µm. B, F(3,16) = 42.0, p < 0.0001. C, F(3,16) = 61.49, p < 0.0001.
HERV-K Env-induced increases in concentrations of cytosolic Fe2± and ROS were blocked by DFO and CD98 monoclonal antibody
We showed previously (Halcrow et al., 2021) that released stores of endolysosome Fe2+ were sufficient to increase levels of cytosolic Fe2+ ([Fe2+]cyt) and ROS. Accordingly, we next investigated the extent to which HERV-K Env affected levels of cytosolic Fe2+ and ROS in SH-SY5Y cells (Fig. 7A–G). HERV-K Env concentration dependently (30–100 nM) (Fig. 7A) and significantly (p < 0.0001) increased levels of cytosolic ROS (Figs. 7A,C,E,G) and [Fe2+]cyt (p < 0.0001) after a 1 h incubation time (Fig. 7B,D,F). DFO (50 µM) alone significantly (p < 0.0001) decreased [Fe2+]cyt and a 1 h pretreatment with DFO significantly (p < 0.0001) blocked HERV-K Env-induced increases in [Fe2+]cyt as well as increases in cytosolic ROS (Fig. 7D,E). A 30 min pretreatment with CD98 mAb (0.2 µg) significantly (p = 0.0015) blocked HERV-K Env-induced increases in [Fe2+]cyt as well as significantly (p < 0.0001) blocked HERV-K Env-induced increases in cytosolic ROS (Fig. 7B,C). CD98 mAb (0.2 µg) treatments alone had no significant effects on [Fe2+]cyt and cytosolic ROS (Fig. 7B,C). Additional controls including buffer, K01 antibody-inactivated HERV-K Env and heat-inactivated HERV-K Env; none affected levels of Fe2+ and ROS (Fig. 7F,G).
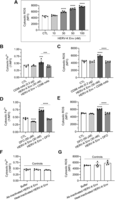
HERV-K Env-induced increases in cytosolic Fe2± and ROS levels were blocked by the endolysosome iron chelator deferoxamine and a CD98 monoclonal antibody. Cytosolic levels of Fe2+ were measured by the quenching dye PhenGreen SK (PGSK) and data were transformed and illustrated as the reciprocal of mean fluorescence intensity (1/MFI). Cytosolic ROS levels were measured using CM-H2DCFDA, and data were represented as MFI of CM-H2DCFDA staining. A, HERV-K Env concentration dependently (10–100 nM) increased cytosolic ROS in SH-SY5Y cells. B, C, Pretreatment (30 min) with CD98 mAb (0.2 µg) blocked HERV-K Env-induced increases in levels of cytosolic Fe2+ and ROS. CD98 mAb (0.2 µg) alone did not affect cytosolic Fe2+ and ROS levels. D–E, Preincubation of SH-SY5Y cells for 1 h with DFO (50 µM) significantly decreased levels of cytosolic Fe2+ and blocked HERV-K Env-induced increases in levels of cytosolic Fe2+ and ROS. F–G, Controls included buffer, preincubation of HERV-K Env with the K01 antibody for 2 h at 4°C (antibody-inactivated HERV-K Env), and heat-inactivated HERV-K Env (95°C for 15 min) did not significantly change levels of cytosolic Fe2+ and ROS. An ANOVA with Tukey's post hoc multiple-comparisons test was used for analysis. Mean ± SD as well as individual data points were included on each bar. Each data point represented the mean fluorescence from 10,000 cells performed independently from five cell-culture preparations for each group (n = 50,000). n = total number of cells for each group plotted. 50,000 cells were used for experimentation per group and no cells were intentionally excluded. A, F(4,20) = 161.2, p < 0.0001. B, F(3,16) = 9.4, p = 0.0008, C, F(3,16) = 48.99, p < 0.0001. D, F(3,16) = 228.6, p < 0.0001. E, F(3,16) = 57.6, p < 0.0001. F, F(2,12) = 1.01, p = 0.3936. G, F(2,12) = 2.934, p = 0.0917.
HERV-K Env-induced increases in levels of mitochondrial Fe2± and ROS were blocked by DFO and CD98 monoclonal antibody
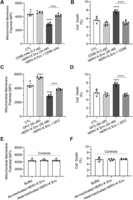
Because endolysosome Fe2+ stores when released are sufficient to increase levels of mitochondrial Fe2+ ([Fe2+]mito) and ROS, we next investigated the extent to which HERV-K Env affected levels of [Fe2+]mito and mitochondrial ROS in SH-SY5Y cells and HCNs (Figs. 8A–E, 9A–C, 10A–C). Mitochondrial Fe2+ levels were measured using rhodamine B 4-[(2,2′-bipyridin-4-yl) aminocarbonyl] benzyl ester (RDA). Because RDA is a quenching dye, higher iron levels cause a decrease in RDA fluorescence. For ease of interpretation and to demonstrate clearly the HERV-K Env-induced increases in mitochondrial iron, the reciprocal of RDA's 1/MFI was used (Fig. 9B,C). HERV-K Env concentration dependently (30–100 nM) and significantly (p < 0.0001) increased levels of mitochondrial ROS in SH-SY5Y cells after a 1 h incubation time (Fig. 8A). Qualitatively, in HCNs HERV-K Env (30 nM) increased levels of mitochondrial Fe2+ and ROS, effects that were blocked by 1 h pretreatments with CD98 mAb (0.2 µg) and DFO (50 µM) (Figs. 9A, 10A); Figure insets demonstrate in single MitoTracker-positive mitochondria (green) the MFI of RDA or MitoSox (Red) (Figs. 9A, 10A). Quantitatively, HERV-K Env (30 nM) significantly (p < 0.0001) increased [Fe2+]mito and significantly (p < 0.0001) increased levels of mitochondrial ROS in SH-SY5Y cells after a 1 h incubation time (Figs. 8B–E) and in HCNs (Figs. 9B,C, 10B,C). A 30 min pretreatment with CD98 mAb (0.2 µg) significantly (p < 0.0001) blocked HERV-K Env-induced increases in [Fe2+]mito as well as mitochondrial ROS in SH-SY5Y cells and HCNs after a 1 h incubation time (Figs. 8B,C, 9B, 10B). CD98 mAb (0.2 µg) treatments alone did not significantly affect [Fe2+]mito nor levels of mitochondrial ROS (Figs. 8B,C, 9B, 10B). DFO (50 µM) alone did not affect [Fe2+]mito, but a 1 h pretreatment with DFO significantly (p < 0.0001) blocked HERV-K Env-induced increases in [Fe2+]mito as well as increases in mitochondrial ROS in SH-SY5Y cells and HCNs after a 1 h incubation time (Figs. 8D,E, 9C, 10C).

HERV-K Env-induced increases in mitochondrial Fe2± and ROS levels were blocked by the endolysosome iron chelator deferoxamine and CD98 monoclonal antibody. Mitochondrial Fe2+ levels were measured by the quenching dye rhodamine B-[(2,2′-bipyridine-4-yl)-aminocarbonyl]benzyl ester (RDA) and data were transformed and illustrated as the reciprocal of mean fluorescence intensity (1/MFI). Mitochondrial ROS levels were measured using MitoSOX and data were expressed as the MFI of MitoSOX staining. A, HERV-K Env concentration dependently (10–100 nM) increased levels of mitochondrial ROS in SH-SY5Y cells. B, C, Pretreatment for 30 min with CD98 mAb (0.2 µg) blocked HERV-K Env-induced increases in mitochondrial Fe2+ and ROS levels. D, E, Preincubation of SH-SY5Y cells for 1 h with DFO (50 µM) blocked HERV-K Env-induced increases in mitochondrial Fe2+ and ROS levels. An ANOVA with Tukey's post hoc multiple-comparisons test was used for analysis. Mean ± SD as well as individual data points were included on each bar. Each data point represented the mean fluorescence from 10,000 cells performed independently from five cell-culture preparations for each group (n = 50,000). n = total number of cells for each group plotted. 50,000 cells were used for experimentation per group and no cells were intentionally excluded. A, F(4,20) = 72.6, p < 0.0001; (B) F(3,16) = 18.3, p < 0.0001; (C) F(3,16) = 18.9, p < 0.0001; (D) F(3,16) = 20.94, p < 0.0001, (E) F(3,16) = 15.7, p < 0.0001.
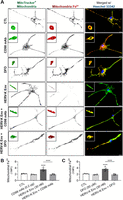
HERV-K Env-induced increases in mitochondrial Fe2± levels were blocked by the endolysosome iron chelator deferoxamine and CD98 monoclonal antibody in human cortical neurons (HCNs). Mitochondrial Fe2+ levels were measured by the quenching dye rhodamine B-[(2,2′-bipyridine-4-yl)-aminocarbonyl]benzyl ester (RDA) and data were transformed and illustrated as the reciprocal of mean fluorescence intensity (1/MFI). A, Representative spinning-disk confocal microscope images of cultured HCNs incubated with buffer (CTL), deferoxamine (DFO) (1 h preincubation, 50 µM), HERV-K Env (30 nM), and CD98 monoclonal antibody (CD98 mAb, 30 min preincubation, 0.2 µg) for 1 h and stained for mitochondrial Fe2+ (RDA, red), mitochondria (MitoTracker, green), and nuclei (Hoechst 33342, blue). The insets demonstrate a single MitoTracker-positive mitochondrion (green) containing RDA stain (red). B, Quantitatively, pretreatment for 30 min with CD98 mAb (0.2 µg) blocked HERV-K Env-induced increases in mitochondrial Fe2+ levels. C, Preincubation of HCNs for 1 h with DFO (50 µM) blocked HERV-K Env-induced increases in mitochondrial Fe2+ levels. An ANOVA with Tukey's post hoc multiple-comparisons test was used for analysis. Mean ± SD as well as individual data points were included on each bar. Each data point represented the mean fluorescence from 300 mitochondria from 10 cells performed independently from three cell-culture preparations for each group (n = 9,000). n = total number of mitochondria for each group plotted. 30 cells were used for experimentation per group and no cells were intentionally excluded. Scale bar = 20 µm. B, F(3,16) = 34.59, p < 0.0001; (C) F(3,16) = 34.74, p < 0.0001.

HERV-K Env-induced increases in mitochondrial ROS levels were blocked by the endolysosome iron chelator deferoxamine and a CD98 monoclonal antibody in human cortical neurons (HCNs). Mitochondrial ROS levels were measured using MitoSOX and data were expressed as the MFI of MitoSOX staining. A, Representative spinning-disk confocal microscope images of cultured HCNs incubated with buffer (CTL), deferoxamine (DFO) (1 h preincubation, 50 µM), HERV-K Env (30 nM), and CD98 monoclonal antibody (CD98 mAb, 30 min preincubation, 0.2 µg) for 1 h and stained for mitochondrial ROS (MitoSox, red), mitochondria (MitoTracker, green), and nuclei (Hoechst 33342, blue). The insets demonstrate a single MitoTracker-positive mitochondrion (green) containing MitoSox stain (red). B, Quantitatively, pretreatment for 30 min with CD98 mAb (0.2 µg) blocked HERV-K Env-induced increases in mitochondrial ROS levels. C, Preincubation of cultured HCNs for 1 h with DFO (50 µM) blocked HERV-K Env-induced increases in mitochondrial ROS levels. An ANOVA with Tukey's post hoc multiple-comparisons test was used for analysis. Mean ± SD as well as individual data points were included on each bar. Each data point represented the mean fluorescence from 300 mitochondria from 10 cells performed independently from three cell-culture preparations for each group (n = 9,000). n = total number of mitochondria for each group plotted. 30 cells were used for experimentation per group and no cells were intentionally excluded. Scale bar = 20 µm. B, F(3,16) = 21.51, p < 0.0001; (C) F(3,16) = 28.11, p < 0.0001.
HERV-K Env-induced mitochondrial membrane potential depolarization and cell death were blocked by the endolysosome iron chelator DFO and a CD98 monoclonal antibody
We next determined effects of HERV-K Env on mitochondrial membrane potential (Δψm) after a 1 h incubation time and cell death after a 24 h incubation time in SH-SY5Y cells. HERV-K Env (30 nM) decreased CMXROS fluorescence staining indicative of Δψm depolarization at a 1 h timepoint (Fig. 11A,C). A 30 min pretreatment with the CD98 mAb (0.2 µg) blocked significantly (p < 0.0001) HERV-K Env-induced depolarization of Δψm (Fig. 11A). CD98 mAb (0.2 µg) alone did not significantly affect Δψm (Fig. 11A). Cells pretreated for 1 h with the endolysosome-specific iron chelator DFO (50 µM) significantly (p < 0.0001) blocked HERV-K Env-induced Δψm depolarization; DFO alone significantly (p < 0.0001) increased (polarization) Δψm (Fig. 11C). Initial experiments with SH-SY5Y cells were conducted to determine concentration-dependent effects of HERV-K Env (10–100 nM) on cell viability. Statistically significant increases in cell death were observed starting at 30 nM HERV-K Env; ∼8% at 30 nM, ∼19% at 50 nM, and ∼37% at 100 nM (data not shown). All subsequent experiments used the concentration of 30 nM HERV-K Env because it was the lowest concentration that produced statistically significant increases in cell death (Fig. 11B,D). Pretreatment with the CD98 mAb (0.2 µg) for 30 min blocked significantly (p < 0.0001) HERV-K Env-induced cell death (Fig. 11B). Cells pretreated for 1 h with DFO (50 µM) significantly (p < 0.0001) blocked HERV-K Env-induced cell death (Fig. 11D). CD98 mAb (0.2 µg) and DFO (50 µM) alone had no significant effects on cell death compared to controls (Fig. 11B,D). Additional controls including buffer, K01 antibody-inactivated HERV-K Env, and heat-inactivated HERV-K Env did not significantly affect Δψm and did not significantly affect cell death (Fig. 11E,F).
HERV-K Env-induced depolarization of mitochondrial membrane potential and cell death were blocked by the endolysosome iron chelator deferoxamine and a CD98 monoclonal antibody in SH-SY5Y cells. Mitochondrial membrane potential (Δψm) was measured with CMXROS fluorescence dye that decreases with depolarization. Cell death of SH-SY5Y cells was measured with propidium iodide 24 h posttreatment. A, HERV-K Env significantly decreased CMXROS fluorescence (depolarization), and pretreatment (30 min) with CD98 monoclonal antibody (CD98 mAb, 0.2 µg) prevented HERV-K Env-induced deceases in CMXROS fluorescence. B, HERV-K Env-induced cell death was blocked by 30 min pretreatment with CD98 mAb. C, HERV-K Env significantly depolarized Δψm and DFO (50 µM) pretreatment for 1 h blocked HERV-K Env-induced decreases in CMXROS fluorescence. DFO alone significantly increased CMXROS fluorescence (polarization). D, Cell death was significantly increased by HERV-K Env; DFO (50 µM) pretreatment for 1 h blocked HERV-K Env-induced cell death. E, F, Controls included buffer, preincubation of HERV-K Env with the K01 antibody for 2 h at 4°C (Ab-inactivated HERV-K Env), and heat-inactivated HERV-K Env (15 min at 95°C) did not significantly change CMXROS fluorescence or cell death. An ANOVA with Tukey's post hoc multiple-comparisons test was used for analysis. Mean ± SD and individual data points were included on each bar. Each data point represented the MFI from 10,000 cells performed independently from five cell-culture preparations for each group (n = 50,000). n = total number of cells for each group plotted. No cells were intentionally excluded. A, F(3,20) = 73.9, p < 0.0001; (B) F(3,18) = 39.3, p < 0.0001; (C) F(3,20) = 165.3, p < 0.0001; (D) F(3,16) = 34.3, p < 0.0001. (E) F(2,15) = 0.07684, p = 0.9264; (F) F(2,12) = 0.255, p = 0.7791.
HERV-K Env-induced increases in lipid peroxidation (ferroptosis) were blocked by the endolysosome-iron chelator DFO and a CD98 monoclonal antibody
Because ferrous iron can induce cell death by ferroptosis, we next determined the effects of HERV-K Env on lipid peroxidation in SH-SY5Y cells 24 h after addition of treatments (Figs. 12, 13). Qualitatively, HERV-K Env (30 nM) increased lipid peroxidation in SH-SY5Y cells; effects were blocked by pretreatment for 30 min with CD98 mAb (0.2 µg) and by pretreatment for 1 h with DFO (50 µM) (Figs. 12A, 13A). Quantitatively, pretreatment with CD98 mAb (0.2 µg) for 30 min blocked significantly (p < 0.0001) HERV-K Env-induced lipid peroxidation 24 h after addition of treatments (Fig. 12B). Cells pretreated for 1 h with DFO (50 µM) significantly (p < 0.0001) blocked HERV-K Env-induced lipid peroxidation (Fig. 13B). Additional controls including buffer, K01 antibody-inactivated HERV-K Env, and heat-inactivated HERV-K Env did not significantly affect lipid peroxidation 24 h after addition of treatments (Fig. 12C).

HERV-K Env-induced lipid peroxidation was blocked CD98 monoclonal antibody in SH-SY5Y cells. For determination of ferroptosis cell death, C11-BODIPY 581/591 was used as a measure of lipid peroxidation. A, Qualitatively, HERV-K Env (30 nM) increased lipid peroxidation fluorescence staining (green); these increases were blocked by pretreatment (30 min) with CD98 monoclonal antibody (CD98 mAb, 0.2 µg). B, Quantitatively, lipid peroxidation changes in C11-BODIPY 581/591 fluorescence were significantly (p < 0.0001) increased by HERV-K Env (30 nM); these increases were blocked by pretreatment (30 min) with CD98 monoclonal antibody (CD98 mAb, 0.2 µg). C, Controls included buffer, preincubation of HERV-K Env with the K01 antibody for 2 h at 4°C (antibody-inactivated HERV-K Env), and heat-inactivated HERV-K Env (15 min at 95°C) did not significantly change or induce lipid peroxidation. An ANOVA with Tukey's post hoc multiple-comparisons test was used for analysis. Each data point represents the mean fluorescence of 30 cells performed independently five times for each group (n = 150). n = total number of cells for each group plotted. Cells were chosen randomly in the microscope's field of view and no cells were intentionally excluded. Scale bar = 20 µm. B, F(3,16) = 21.0, p < 0.0001; (C) F(2,12) = 0.117, p = 0.8906.
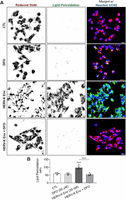
HERV-K Env-induced lipid peroxidation was blocked by the endolysosome iron chelator deferoxamine in SH-SY5Y cells. For the determination of ferroptosis cell death, C11-BODIPY 581/591 was used as a measure of lipid peroxidation. A, Qualitatively, HERV-K Env (30 nM) increased lipid peroxidation fluorescence staining (green); these increases were blocked by pretreatment (1 h) with DFO (50 µM). B, Quantitatively, lipid peroxidation was significantly (p < 0.0001) increased by HERV-K Env (30 nM); these increases were blocked by pretreatment (1 h) with DFO (50 µM). An ANOVA with Tukey's post hoc multiple-comparisons test was used for analysis. Each data point represents the mean fluorescence of 30 cells performed independently five times for each group (n = 150). n = total number of cells for each group plotted. Cells were chosen randomly in the microscope's field of view and no cells were intentionally excluded. Scale bar = 20 µm. B, F(3,16) = 32.2, p < 0.0001.
HERV-K Env-induced increases in apoptosis were blocked by the endolysosome-iron chelator DFO and a CD98 monoclonal antibody
To further verify the type of HERV-K Env-induced cell death, we determined HERV-K Env effects on apoptosis in SH-SY5Y cells 24 h after addition of treatments using the Apopxin Green staining method where CytoCalcein (blue) indicates live cells and labeled phosphatidylserine (PS, green) transferred to the outer leaflet of the plasma membrane indicates initial/intermediate stages of apoptosis. The PS sensor has green fluorescence upon binding to the membrane PS. Qualitatively, HERV-K Env (30 nM) increased staining for PS 24 h posttreatment; effects were blocked by pretreatment for 30 min with CD98 mAb (0.2 µg) and by pretreatment for 1 h with DFO (50 µM) (Figs. 14A, 15A). Quantitatively, apoptotic cell death in SH-SY5Y cells (Figs. 14B, 15B) was increased to about 8% by HERV-K Env (30 nM); pretreatment with the CD98 mAb (0.2 µg) for 30 min blocked significantly (p < 0.0001) HERV-K Env-induced apoptosis (Fig. 14B). Cells pretreated for 1 h with DFO (50 µM) significantly (p < 0.0001) blocked HERV-K Env-induced apoptosis 24 h after addition of treatments (Fig. 15B). Additional controls including buffer, K01 antibody-inactivated HERV-K Env, and heat-inactivated HERV-K Env did not significantly affect apoptosis 24 h after addition of treatments (Fig. 14C). Cell death was determined to be mainly by apoptosis although increases in lipid peroxidation (ferroptosis) were observed (Figs. 12–15).

HERV-K Env-induced apoptosis was blocked by CD98 monoclonal antibody in SH-SY5Y cells. For the determination of apoptotic cell death, Apopxin Green staining was used as a measure of apoptotic body release. Images were analyzed using Imaris software and show staining of Apopxin Green which labels phosphatidylserine (PS) on the cell surface of apoptotic cells (green), and CytoCalcein Violet labels the cytoplasm of living cells (blue). A, Qualitatively, HERV-K Env (30 nM) increased apoptotic body release (Apopxin Green), and these increases were blocked by pretreatment (30 min) with CD98 monoclonal antibody (CD98 mAb, 0.2 µg). B, Quantitatively, apoptotic cells as indicated by Apopxin green staining were significantly (p < 0.0001) increased by HERV-K Env (30 nM); these increases in Apopxin green staining were blocked by pretreatment (30 min) with CD98 monoclonal antibody (CD98 mAb, 0.2 µg). C, Controls including buffer, preincubation of HERV-K Env with the K01 antibody for 2 h at 4°C (antibody-inactivated HERV-K Env), and heat-inactivated HERV-K Env (15 min at 95°C) did not significantly induce apoptosis. An ANOVA with Tukey's post hoc multiple-comparisons test was used for analysis. Each data point represents the mean fluorescence of 30 cells performed independently five times for each group (n = 150). n = total number of cells for each group plotted. Cells were chosen randomly in the microscope's field of view and no cells were intentionally excluded. Scale bar = 20 µm. B, F(3,16) = 24.76, p < 0.0001; (C) F(2,12) = 0.5139, p = 0.6108.
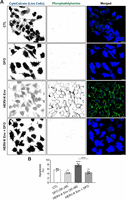
HERV-K Env-induced apoptosis was blocked by the endolysosome iron chelator deferoxamine in SH-SY5Y cells. Apopxin Green staining of apoptotic body release was used to determine apoptotic cell death. Images were analyzed using Imaris software and Apopxin Green staining labels phosphatidylserine (PS) on the cell surface of apoptotic cells (green); CytoCalcein Violet labels the cytoplasm of living cells (blue). A, Qualitatively, HERV-K Env (30 nM) increased apoptotic body release (Apopxin Green), and these increases were blocked by pretreatment (1 h) with DFO (50 µM). B, Quantitatively, apoptotic cells as indicated by Apopxin green staining were significantly (p < 0.0001) increased by HERV-K Env (30 nM); these increases were blocked by pretreatment (1 h) with DFO (50 µM). An ANOVA with Tukey's post hoc multiple-comparisons test was used for analysis. Each data point represents the mean fluorescence of 30 cells performed independently five times for each group (n = 150). n = total number of cells for each group plotted. Cells were chosen randomly in the microscope's field of view and no cells were intentionally excluded. Scale bar = 20 µm. B, F(3,16) = 52.24, p < 0.0001.
HERV-K Env-induced neuronal cell death in primary cultured human neurons was blocked by the endolysosome iron chelator DFO and a CD98 monoclonal antibody
Next, we determined cell death 24 h after addition of treatments in HCNs using PI staining (red) as well as neurite length using the MemBrite-positive cell surface staining kit (green). MemBrite Fix Cell Surface Staining is a fluorescent dye that binds to proteins on the surface of live cells, does not bind to lipids, and was used to measure retraction of neurites. Qualitatively, HERV-K Env (30 nM) increased PI staining and decreased MemBrite cell surface staining 24 h posttreatment; effects were blocked by pretreatment for 30 min with CD98 mAb (0.2 µg) and by pretreatment for 1 h with DFO (50 µM) (Figs. 16A, 17A). Quantitatively, HERV-K Env (30 nM) decreased neuronal cell viability by about 50% (Figs. 16C, 17C) and pretreatment with CD98 mAb (0.2 µg) for 30 min blocked significantly (p < 0.0001) HERV-K Env-induced decreases in neurite length and cell death 24 h after addition of treatments (Fig. 16B,C). Pretreatment with DFO (50 µM) for 1 h significantly (p < 0.0001) blocked HERV-K Env-induced decreases in neurite length and cell death (Fig. 17B,C). DFO (50 µM) alone significantly (p = 0.0005) increased neurite length and CD98 mAb (0.2 µg) alone had no effect on neurite length 24 h after addition of treatments (Fig. 16B, 17B).

HERV-K Env-induced cell death was blocked by CD98 monoclonal antibody in human cortical neurons (HCNs). Cell death was measured with propidium iodide (PI, red) 24 h posttreatment, and the plasma membrane was stained with MemBrite Fix 488 Cell Surface staining kit (green). A, Qualitatively, HERV-K Env (30 nM) increased PI fluorescence staining (red) and decreased and fragmented MemBrite Cell Surface fluorescence staining (green); the increases in PI staining were blocked by pretreatment (30 min) with CD98 monoclonal antibody (CD98 mAb, 0.2 µg). B, Quantitatively, HERV-K Env (30 nM) significantly (p < 0.0001) decreased the neurite length of HCNs; these decreases were blocked by pretreatment (30 min) with CD98 monoclonal antibody (CD98 mAb, 0.2 µg). C, Quantitatively, HERV-K Env (30 nM) significantly (p < 0.0001) increased HCN cell death; this increase was blocked by pretreatment (30 min) with CD98 monoclonal antibody (CD98 mAb, 0.2 µg). An ANOVA with Tukey's post hoc multiple-comparisons test was used for analysis. Each data point represents the mean fluorescence of 10 cells performed independently three times for each group (n = 30). n = total number of cells for each group plotted. Cells were chosen randomly in the microscope's field of view and no cells were intentionally excluded. Scale bar = 20 µm. B, F(3,16) = 64.46, p < 0.0001; (C) F(3,16) = 183.9, p < 0.0001.
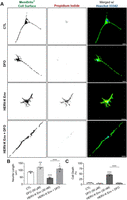
HERV-K Env-induced cell death was blocked by the endolysosome iron chelator deferoxamine in human cortical neurons (HCNs). Cell death was measured with propidium iodide (PI, red) 24 h posttreatment, and the plasma membrane was stained with MemBrite Fix 488 Cell Surface staining kit (green). A, Qualitatively, HERV-K Env (30 nM) increased PI fluorescence staining (red) and decreased and fragmented MemBrite Cell Surface fluorescence staining (green); the increases in PI staining were blocked by pretreatment (1 h) with DFO (50 µM). DFO alone (50 µM) increased neurite length in human cortical neurons. B, Quantitatively, HERV-K Env (30 nM) significantly (p < 0.0001) decreased the neurite length of HCNs; these decreases were blocked by pretreatment (1 h) with DFO (50 µM). DFO alone (50 µM) significantly (p < 0.0001) increased neurite length in HCNs. C, Quantitatively, HERV-K Env (30 nM) significantly (p < 0.0001) increased HCN cell death; this increase was blocked by pretreatment (1 h) with DFO (50 µM). An ANOVA with Tukey's post hoc multiple-comparisons test was used for analysis. Each data point represents the mean fluorescence of 10 cells performed independently three times for each group (n = 30). n = total number of cells for each group plotted. Cells were chosen randomly in the microscope's field of view and no cells were intentionally excluded. Scale bar = 20 µm. B, F(3,16) = 48.98, p < 0.0001; (C) F(3,16) = 379.4, p < 0.0001.
Discussion
HERVs are associated with the pathogenesis of neurodegenerative diseases including ALS (Li et al., 2022b); a disease characterized by motor neuron degeneration and cell death (Barber et al., 2006; Celestin et al., 2021). Implicated in the pathogenesis of ALS, the HERV-K subtype HML-2 envelope protein (HERV-K Env) is activated in the brain and spinal cord of people living with ALS and induces degeneration of motor neurons (Li et al., 2015, 2022b). Because HERV-K Env-induced neurotoxicity is mediated by mitochondrial dysfunction and cell death (Li et al., 2015; Steiner et al., 2022), it was important for us to determine mechanisms causing HERV-K Env-induced neurotoxicity.
Specific functional receptors control HERV-K Env-induced entry of retroviral particles into cells (Dewannieux et al., 2005; Hanke et al., 2009; Kramer et al., 2016). Similar to other amphotropic viruses, HERV-K Env through widely expressed receptors causes a broad range of effects in cells, tissues and organs (Kramer et al., 2016). CD98 was recently identified as a receptor that binds HERV-K Env (Wang et al., 2020; Steiner et al., 2022) and through which HERV-K is endocytosed (Kramer et al., 2016; Robinson and Whelan, 2016; Steiner et al., 2022). Colocalization between CD98 and HERV-K Env has been observed immunohistochemically (Wang et al., 2020), and CD98 appears to play a critical role in HERV-K Env-induced toxicity; an antibody against the CD98 receptor blocked HERV-K Env-induced cell death (Steiner et al., 2022). Therefore, HERV-K endocytosis via the CD98 receptor became a focus of this study for cellular entry, and we demonstrated that HERV-K Env colocalized with LysoTracker-positive endolysosomes; a process blocked by an antibody against the CD98 receptor. Thus, HERV-K Env cellular entry appears to be clathrin-independent and mediated by CD98 receptors (Figs. 1, 2, 18).
Once internalized, endolysosomes appear to play a significant role in HERV-K Env-induced intracellular effects. Endolysosomes are multifaceted organelles that have numerous physiological functions and are involved in the pathogenesis of many diseases (Colacurcio and Nixon, 2016; Halcrow et al., 2019; Zhang et al., 2021). Endolysosomes contain relatively high concentrations of redox-active iron, are master regulators of iron metabolism, and are central to iron trafficking, iron homostasis and redox signaling (Kurz et al., 2011; Rizzollo et al., 2021; Halcrow et al., 2022). Moreover, endolysosome iron homostasis is linked to the acidic nature of endolysosomes; deacidification of endolysosomes causes an efflux of endolysosome Fe2+ into the cytosol (Xu and Ren, 2015; Nash et al., 2019; Weber et al., 2020; Halcrow et al., 2021). HERV-K Env is an arginine-rich protein and arginine-rich proteins deacidify endolysosomes (Dewannieux et al., 2005; Ledder et al., 2017; Khan et al., 2020). We demonstrated here that HERV-K Env concentration-dependent deacidification of endolysosomes caused endolysosome Fe2+ to be released into the cytoplasm, and that an antibody against the CD98 receptor blocked those effects. Furthermore, HERV-K Env-induced decreases in levels of endolysosome Fe2+ were blocked by the endolysosome-specific iron chelator DFO. Thus, HERV-K Env cellular entry via CD98 receptor endocytosis into endolysosomes becomes a significant process that regulates downstream intracellular events.
Oxidative stress has long been linked to the pathogenesis of ALS (Barber et al., 2006; Barber and Shaw, 2010). Because ROS is generated by Fe2+ via Fenton-like chemistry (Fenton, 1894; Haber and Weiss, 1934; Barber et al., 2006), we next determined effects of HERV-K Env-induced endolysosome deacidification and endolysosome Fe2+ release on cytosolic and mitochondrial levels of Fe2+ and ROS. We demonstrated that HERV-K Env increased levels of cytosolic and mitochondrial Fe2+ and ROS, effects that were blocked by DFO and an antibody against the CD98 receptor. Thus, HERV-K Env endocytosis, endolysosome deacidification, and increased release of Fe2+ from endolysosomes appear to be sufficient to cause HERV-K Env-induced increases in levels of mitochondrial Fe2+ and ROS.
Depolarization of mitochondrial membrane potential is considered one of the earliest events leading to cell death (Vayssiere et al., 1994; Zamzami et al., 1995; Cohen, 1997), and motor neurons exposed to CSF from ALS patients caused mitochondrial membrane potential depolarization and cell death (Li et al., 2015; Sharma et al., 2016; Steiner et al., 2022). We showed that HERV-K Env induced about 8% cell death in SH-SY5Y cells and about 50% in human primary cortical neurons. Previously, HERV-K Env was found to kill about 25% of human neural stem cell derived neurons (Steiner et al., 2022). We next determined if HERV-K Env-induced mitochondrial membrane potential depolarization and cell death involved HERV-K Env endocytosis and endolysosome Fe2+ release. HERV-K Env-induced mitochondrial membrane potential depolarization and cell death were blocked by DFO and an antibody against the CD98 receptor. Thus, HERV-K Env-induced depolarization of mitochondrial membrane potential and cell death appear to be downstream of HERV-K Env endocytosis, HERV-K Env-induced deacidification of endolysosomes, and HERV-K Env-induced endolysosome Fe2+ release.
In our previous work (Halcrow et al., 2022), we found that [Fe2+]el in U87MG astrocytoma cells was 50.4 µM and in primary cultured rat cortical neurons to be 32.7 µM. Here we found that [Fe2+]el in SH-SY5Y neuroblastoma cells was 48.6 µM and in primary cultured HCNs was 39.9 µM. Previously it was reported that cancer cells contain high levels of Fe2+ (Torti and Torti, 2013) in cytosol and mitochondria (Ito et al., 2016), and our data demonstrate that [Fe2+]el levels in U87MG astrocytoma cells and SH-SY5Y neuroblastoma cells are significantly higher than [Fe2+]el levels in primary cultured rat and HCNs. No significant differences were noted between [Fe2+]el levels in U87MG astrocytoma cells and SH-SY5Y neuroblastoma cells, and between [Fe2+]el levels in primary cultured rat cortical neurons and primary cultured HCNs.
Endolysosome acidification is protective against endolysosome dysfunction and cytotoxicity (Folts et al., 2016; Yambire et al., 2019). Previously it was reported that HERV-K Env-induced neurotoxicity was blocked by retinoic acid receptor (RAR) agonists, glycogen synthase kinase-3 beta (GSK3β) inhibitors, cyclic adenosine monophosphate (cAMP) pathway activators, and some flavonoids. RAR agonists acidify endolysosomes (Rajawat et al., 2011; Kim et al., 2021). Inhibition of GSK-3β acidifies endolysosomes and enhances autophagy (Russi et al., 2021; Pan and Valapala, 2022). The activator of cyclic adenosine monophosphate (cAMP) pathway forskolin acidifies endolysosomes (Majumdar et al., 2007), and flavonoids acidify endolysosomes (Imanishi et al., 2002; Zhong et al., 2015). Further emphasizing endolysosome pH is oxygen-glucose deprivation (OGD), which induces neuronal stress via increased ROS, leads to a failure of autophagic flux by both impairment of endolysosome acidity as well as the increase in ROS levels (Song and Hwang, 2020; Singh and Chen, 2023). Thus, endolysosome acidification might be an effective strategy in blocking HERV-K Env-induced endolysosome deacidification and cytotoxicity.
Lysosome stress responses (LSR) have been implicated in a wide range of pathological states including neurodegenerative disorders and cancer (Reuser and Drost, 2006; Davidson et al., 2017; Lie and Nixon, 2019; Lakpa et al., 2021). Key features of LSR are lysosome deacidification and lysosome membrane permeabilization; processes shown to be triggered by a wide variety of drugs, viral proteins including HIV-1 Tat and gp120, and insults including nanoparticles and LDL cholesterol (Lakpa et al., 2021). However, mechanisms underlying the detrimental effects of insult-induced LSR vary widely as do the neuroprotective effects of lysosome re-acidification. Mechanisms identified here that control the toxic actions of HERV-K Env add additional insight into mechanisms responsible for insult-induced LSR and identify novel strategies specific to ALS that might be targeted.
Our studies demonstrated mechanistically in both SH-SY5Y human neuroblastoma cells and primary cultured HCNs that HERV-K Env was endocytosed via CD98 receptors, deacidified endolysosomes, decreased endolysosome Fe2+ levels, increased levels of cytosolic and mitochondrial Fe2+ and ROS, depolarized mitochondrial membrane potential, and induced cell death, effects that were blocked by DFO and an antibody against the CD98 receptor (Fig. 18). Increased understanding of HERV-K Env-induced inter-organellar signaling of Fe2+ and identifying and characterizing mechanisms underlying HERV-K Env-induced neurotoxicity may lead to the development of effective therapeutics against HERV-K Env-associated diseases.
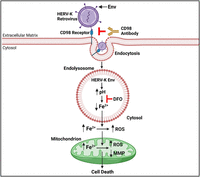
Mechanisms by which HERV-K Env induces cell death in SH-SY5Y cells and cultured human primary cortical neurons. HERV-K Env is endocytosed via CD98 receptors. HERV-K Env deacidifies the acidic lumen of endolysosomes and the deacidification decreases levels of endolysosome Fe2+. The Fe2+ released from endolysosomes is sufficient to increase levels of cytosolic Fe2+ and ROS, increase levels of mitochondrial Fe2+ and ROS, depolarize mitochondrial membrane potential, and increase cell death. An antibody against CD98 receptors or chelation of endolysosome Fe2+ with deferoxamine(DFO) blocks HERV-K Env-induced decreases in endolysosome Fe2+, increases in cytosolic and mitochondrial Fe2+ and ROS levels, and increases in cell death.
Availability of Data and Material
The data that support the findings of this study are available from the corresponding author upon reasonable request.
Footnotes
- Received May 5, 2023.
- Revision received January 8, 2024.
- Accepted February 10, 2024.
-
Research in the Geiger laboratory was supported by the National Institute of General Medical Sciences under award numbers P30GM100329 and U54GM115458, the National Institute of Mental Health under award number R01MH119000, the National Institute of Neurological Diseases and Stroke under award number 2R01NS065957, and the National Institute of Drug Abuse under award number 2R01DA032444. Research in the Nath Laboratory was supported by the Division of Intramural Research, NINDS, NIH (NS3130).
-
↵* D.N.K.Q. and N.K. contributed equally to this work.
-
J.P.S. and A.N. declare that GeNeuro has a joint patent with NINDS on the antibody to HERV-K envelope protein (US patent number 10,981,977). All remaining authors declare no competing financial interests.
- Correspondence should be addressed to Jonathan D. Geiger at jonathan.geiger{at}und.edu.
- Copyright © 2024 the authors




