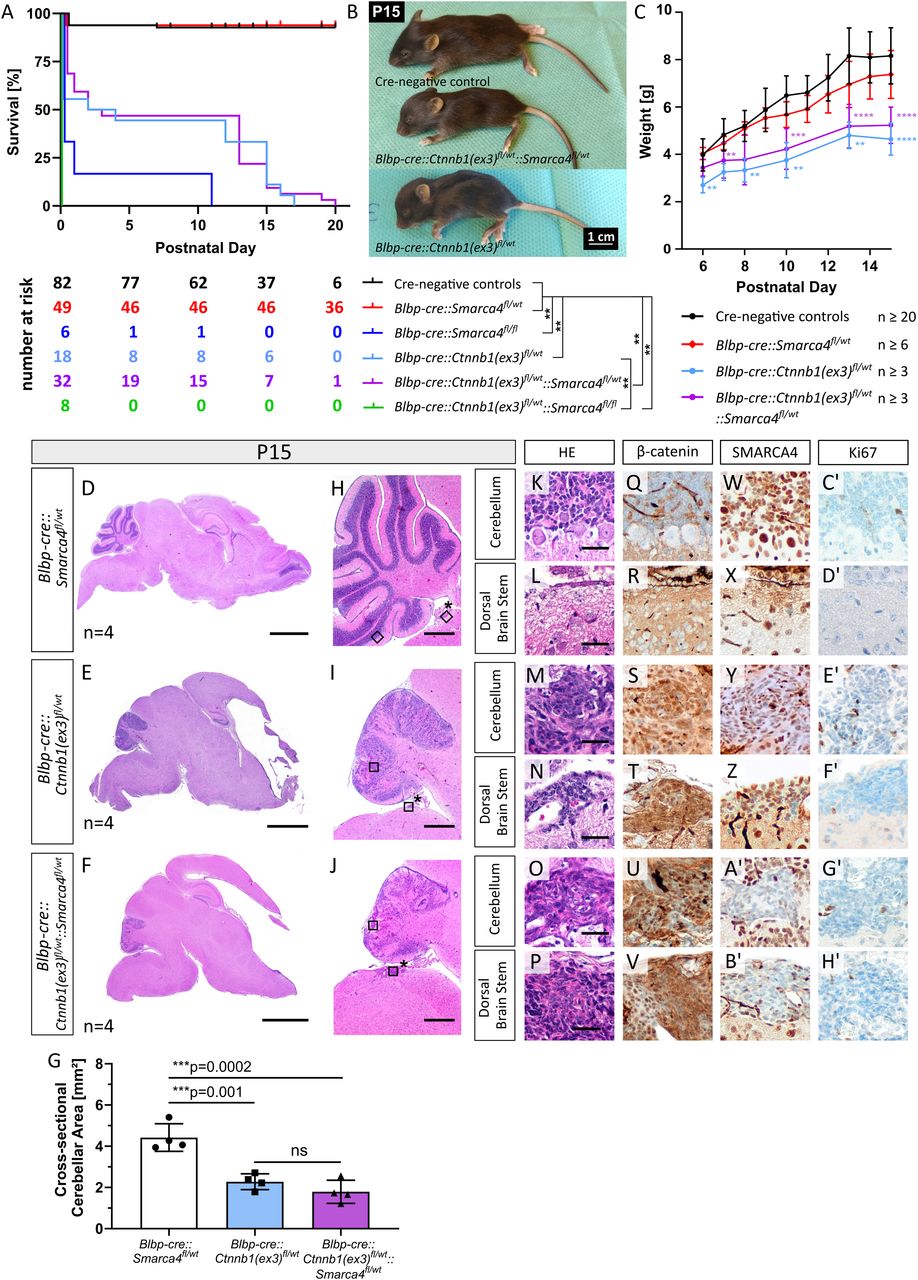
Early lethality and severe developmental phenotypes of Blbp-cre::Ctnnb1(ex3)fl/wt mice. A, Survival curves of different mouse genotypes stated in the legend beneath. All Blbp-cre::Ctnnb1(ex3)fl/wt::Smarca4fl/fl mutants died at birth or within the first day of life. The table beneath the graph depicts numbers at risk for the respective genotypes and postnatal days. Log-rank tests with Bonferroni’s correction were performed (see detailed statistical values in Extended Data Table 1-1). B, Macroscopic hydrocephalus and reduced size of mutant mice at sacrifice (P15). C, Significantly reduced weight of mutant mice compared with controls within the second week of life (**p ≤ 0.01, ***p ≤ 0.001, ****p ≤ 0.0001, see detailed statistical values and n values for each comparison in Extended Data Table 1-1). D–F, HE staining of sagittal brain sections reveals hydrocephalus and hypoplastic cerebella in Blbp-cre::Ctnnb1(ex3)fl/wt and Blbp-cre::Ctnnb1(ex3)fl/wt::Smarca4fl/wt mice compared with Blbp-cre::Smarca4fl/wt controls. The asterisk indicates the location where hindbrain lesions develop in mutant animals. G, Cross-sectional cerebellar area is significantly reduced in mutants as measured in HE sagittal sections of four mice each. H–J, HE stainings show defective lamination and foliation in the cerebella of both Blbp-cre::Ctnnb1(ex3)fl/wt and Blbp-cre::Ctnnb1(ex3)fl/wt::Smarca4fl/wt mice. K–H′, HE and IHC of aberrant cell accumulations in the cerebellum and dorsal brainstem of mutants (corresponding to black rectangles in H–J with and without asterisks, respectively). Cell accumulations show nuclear accumulation of β-catenin (S, T, U, V), partial loss of SMARCA4 only in Blbp-cre::Ctnnb1(ex3)fl/wt::Smarca4fl/wt mutants (A′, B′), and weak proliferation in both mutants at both locations (E′–H′). Scale bars in D and E, and F correspond to 2 mm; in H, I, and J to 500 µm; and in K–P to 50 µm (also applicable to panels Q–H′).


