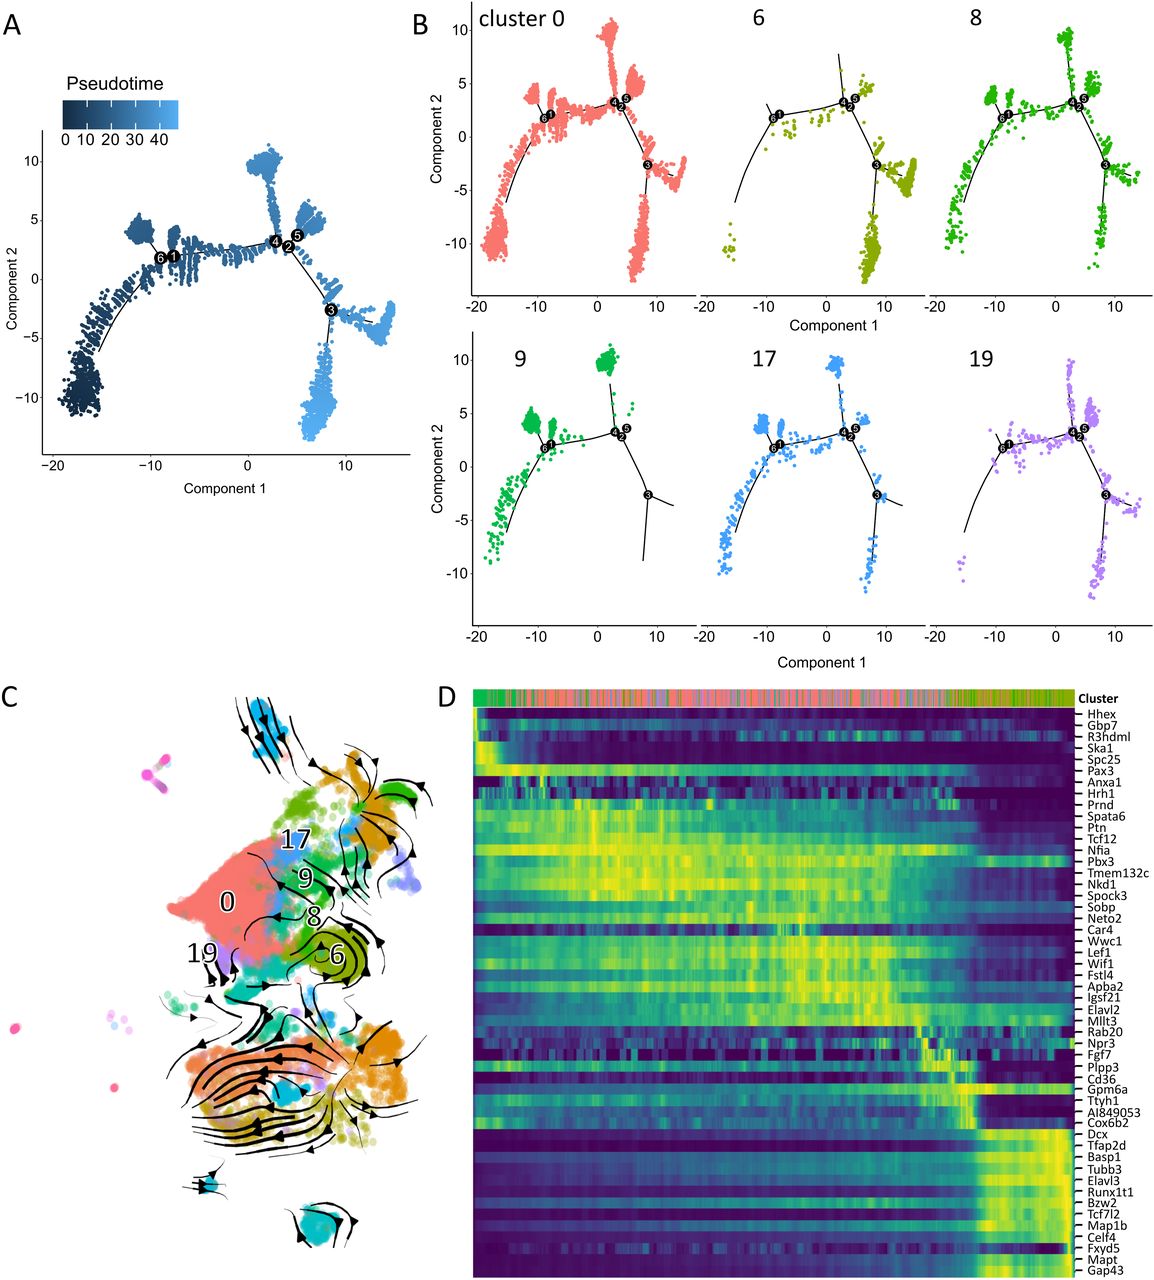
Single-cell trajectory and RNA velocity analysis of mutant cerebellum. A, B, Trajectory analysis of single cells from mutant (Blbp-cre::Ctnnb1(ex3)fl/wt::Smarca4fl/rec) E16.5 cerebella with (A) pseudotime of all cells shown or (B) cells of each cluster (according to UMAP in Fig. 11) depicted separately. Cells of Cluster 9 are rather situated at the beginning of the trajectory, Cluster 0 is distributed along the whole trajectory, and Cluster 6 forms the main cell population at the end of the trajectory. C, RNA velocity analysis according to RNA splicing applied as stream onto UMAP embedding of mutant cells (as shown in Fig. 11). Cells are transitioning from Cluster 9 to Cluster 0, within which there is less dynamic change. D, Cells are ordered according to their latent time in RNA velocity analysis, showing a transition from Cluster 9 to Cluster 6 via Cluster 0. Standardized expression of genes selected by fit-likelihood to the model is shown in the heatmap.


