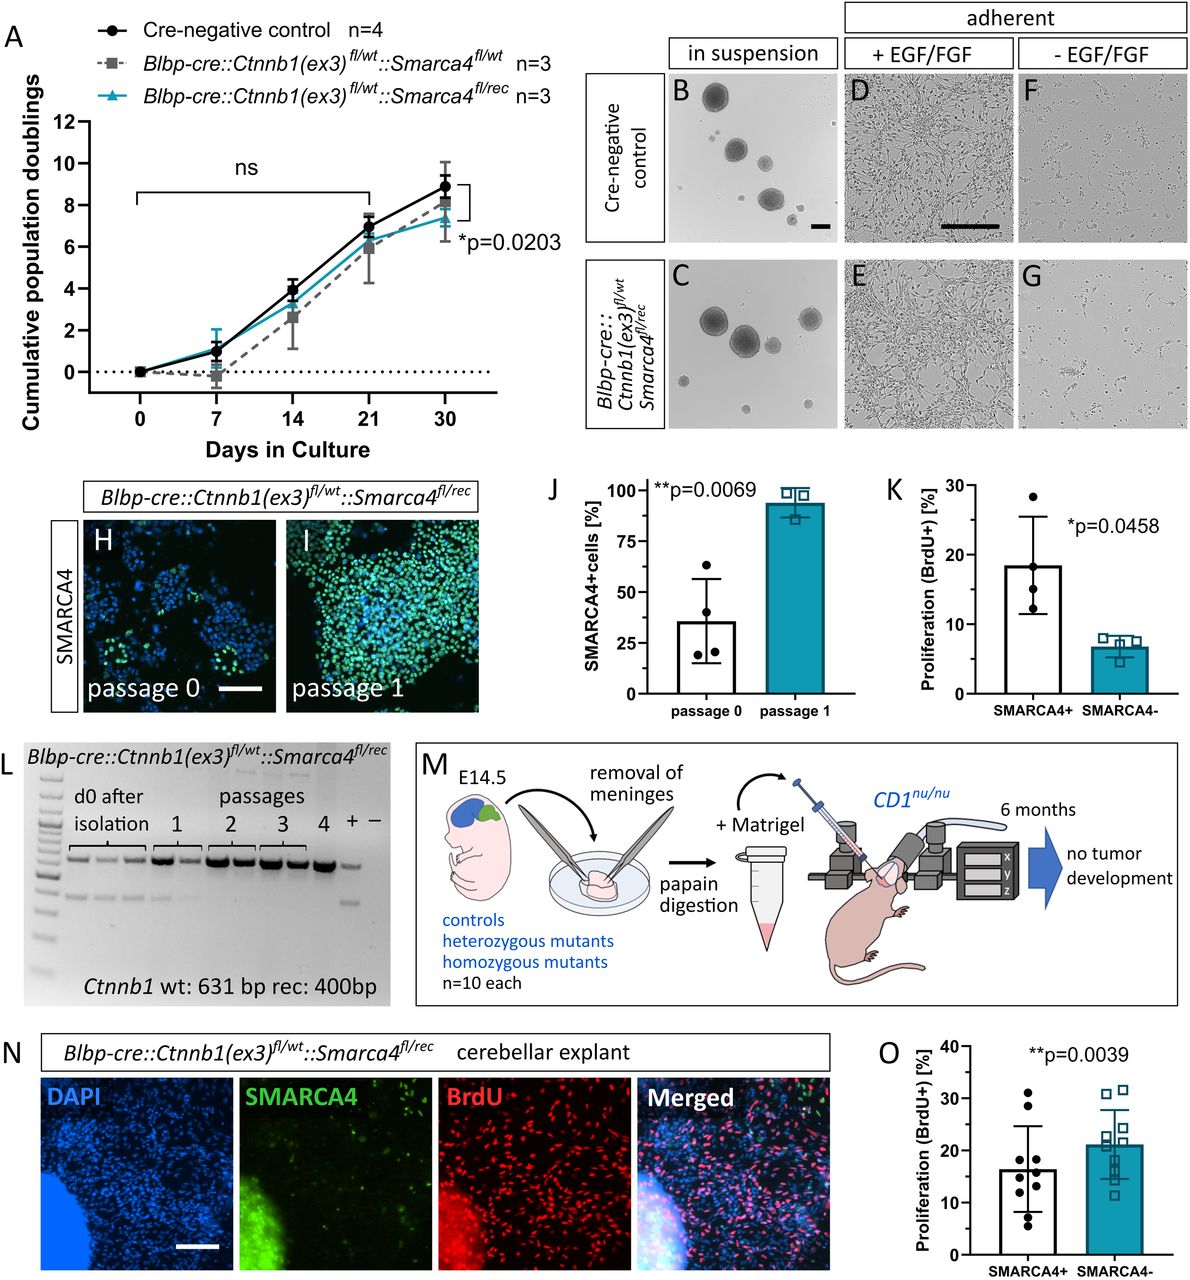
Mutant cerebellar cells show decreased growth in vitro and no tumorigenic potential after transplantation but increased proliferation when cultured as cerebellar explants. A, Cumulative PD of HPCs grown as neurospheres isolated at E14.5 from controls, heterozygous mutants (Blbp-cre::Ctnnb1(ex3)fl/wt::Smarca4fl/wt), and homozygous mutants (Blbp-cre::Ctnnb1(ex3)fl/wt::Smarca4fl/rec) with weekly passaging. No significant difference observed on Days 7, 14, and 21 in culture but slightly reduced cumulative PD in homozygous mutants vs controls at Day 30 (mean = 7.390 and 8.884, respectively; Tukey's multiple-comparisons test after two-way ANOVA, adjusted p = 0.023, q = 5.884, DF = 4.964). N corresponds to biological replicates . B, C, Morphologically, neurospheres of controls and homozygous mutants do not differ from each other (both Passage 0). D–G, Both mutant and control HPCs show adherent growth when seeded in PLO-coated wells after dissociation with a dependency on EGF/FGF for cell growth (both Passage 1, 4 d after seeding). H–J, SMARCA4 IF staining of neurosphere cytospins shows a loss of SMARCA4 at Passage 0 (Day 7) in the majority of cells, which is almost undetectable at Passage 1 (Day 14). J, Statistic evaluation of SMARCA4 IF stainings shows an increase of SMARCA4-positive cells in mutant HPC neurosphere cultures from Passage 0 to Passage 1. K, IF costaining of SMARCA4 and BrdU in mutant HPC neurospheres at Passage 0 reveals significantly reduced proliferation of SMARCA4-deficient cells. L, PCR for recombined Ctnnb1 with DNA isolated from mutant HPC neurosphere pellets at isolation and at Passages 1–4. M, Transplantation of E14.5 hindbrains (n = 10 of each control, heterozygous mutants, and homozygous mutants) into immunodeficient CD1nu/nu mice did not result in tumor development. N, SMARCA4 and BrdU IF costaining of Blbp-cre::Ctnnb1(ex3)fl/wt::Smarca4fl/rec E14.5 cerebellar explants at Day 4 of culture. O, SMARCA4-negative cells show significantly higher proliferation compared with SMARCA4-positive cells in Blbp-cre::Ctnnb1(ex3)fl/wt::Smarca4fl/rec cerebellar explant culture as evaluated by IF stainings (t = 3.697, DF = 9, p = 0.0049, paired t test). Scale bar in B corresponds to 200 µm (applicable to C), in D to 200 µm (applicable to E–G), and in H and N to 100 µm (applicable to I).


