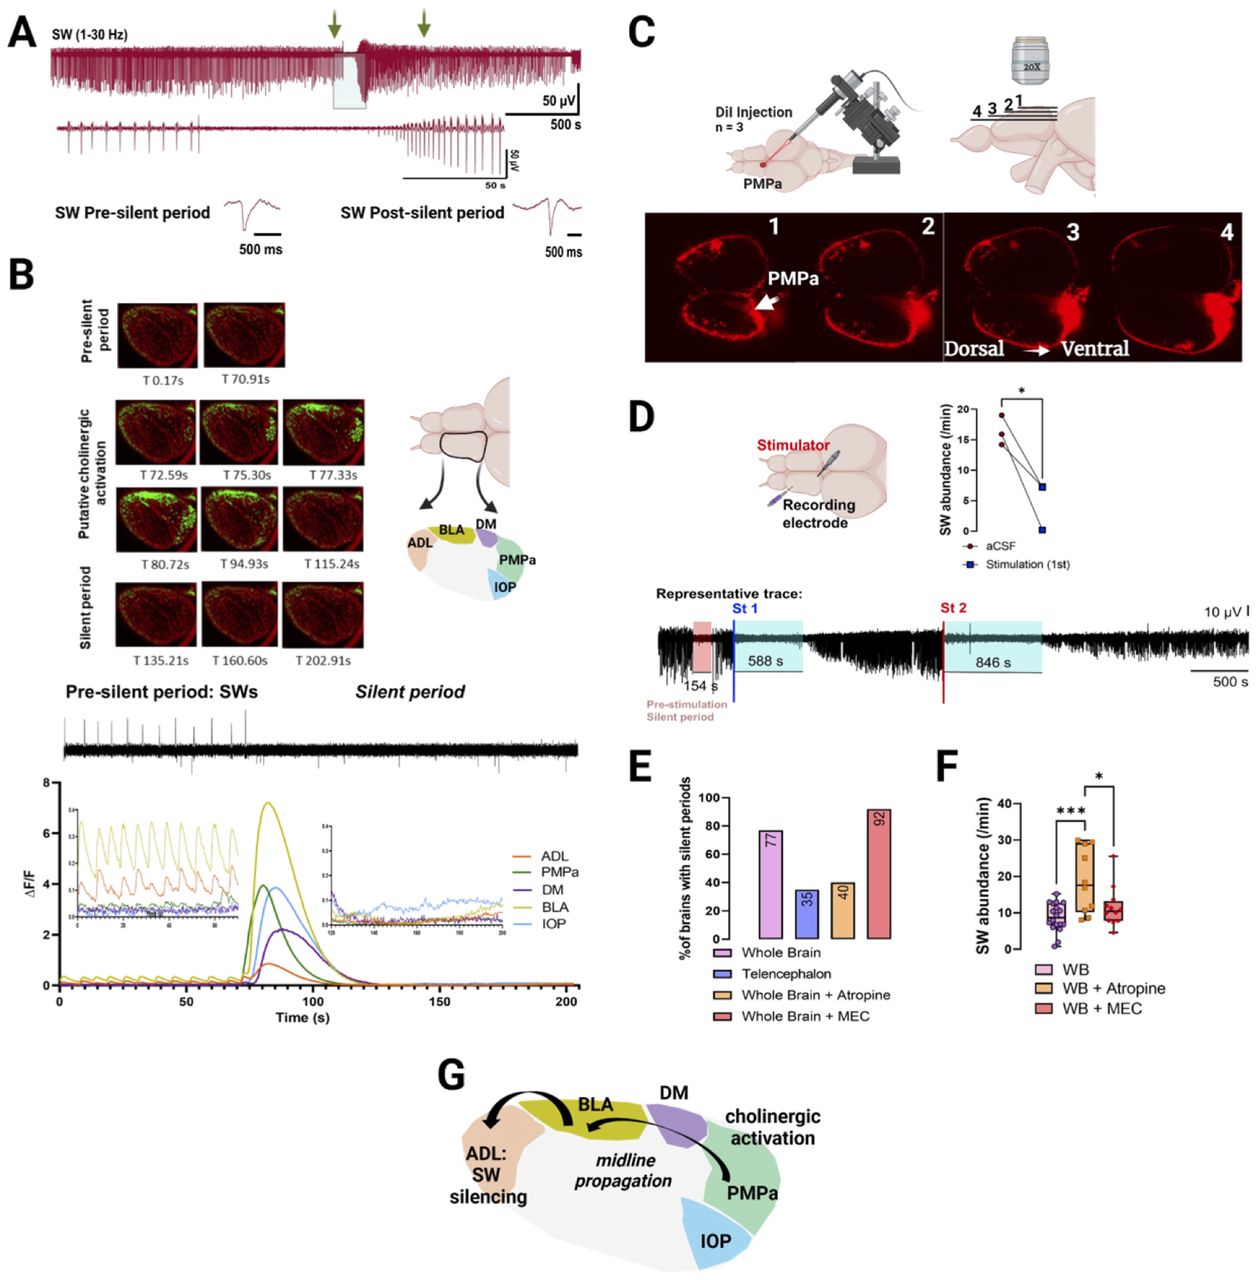
Cholinergic modulation of SW events. A, Representative trace showing a silent period event (light blue shaded area) lasting ∼80 s. Trace of the silent period is expanded below. The green arrows show the location from which an SW event before and after the silent period were taken and expanded. Morphology is unchanged. B, Top left, Representative time-lapse images of the left telencephalon undergoing a silent event. Top right, Representative diagram of the left zebrafish telencephalon demarcating the different brain areas (regional ROIs) participating and/or affected by the silent period: ADL (hippocampus homolog), BLA (basolateral amygdala), DM (dorsomedial lobe), PMPa (posterior pallial amygdaloid zone), and IOP (integrative olfactory pallium). Bottom, Representative alignment between LFP and ΔF/F of regional ROIs for one zebrafish. This pattern, however, was observed in at least three independent recordings (n = 3 fish). ADL and BLA show SW events and synchronized calcium transient signals during the presilent period that are abolished during the silent period event. C, Representative image of the dorsal telencephalon injected with DiI dye tracer in the PMPa region with confocal images taken at different depths (1 → 4 = dorsal → ventral). Representative images of DiI injected dorsal to ventral showing fibers going from the PMPa region to the dorsomedial pallium/BLA through the midline. The injection site is highlighted by the white arrow (n = 3). D, Representative diagram of the brain showing the placement of the stimulating electrode in the PMPa region and recording electrode in the ADL. Representative LFP trace showing an endogenously occurring silent period (red shaded area), followed by the return of LFP activity. First electric stimulation (St 1) leads to LFP activity suppression with returning events after 588 s. A second stimulation (St 2) leads to SW suppression for 846 s with returning events. Quantification of SW events accounting for the first 10 min after the first stimulation compared with baseline (n = 3 stimulated brains). E, Modulation of SW events by the cholinergic system. Percent represents the number of brains with at least one silent period over the total amount of brains recorded per treatment (nwhole brains = 18; natropine = 10; nMEC = 12). F, Quantified abundance after cholinergic modulation. G, Proposed working model of caudal-to-rostral inhibition of SW events based on cholinergic activation in the PMPa region (n = 3). Paired Student's t test, chi-square test, and one-way ANOVA with Tukey's multiple-comparisons test. *p < 0.05, **p < 0.005, ***p < 0.0005.


