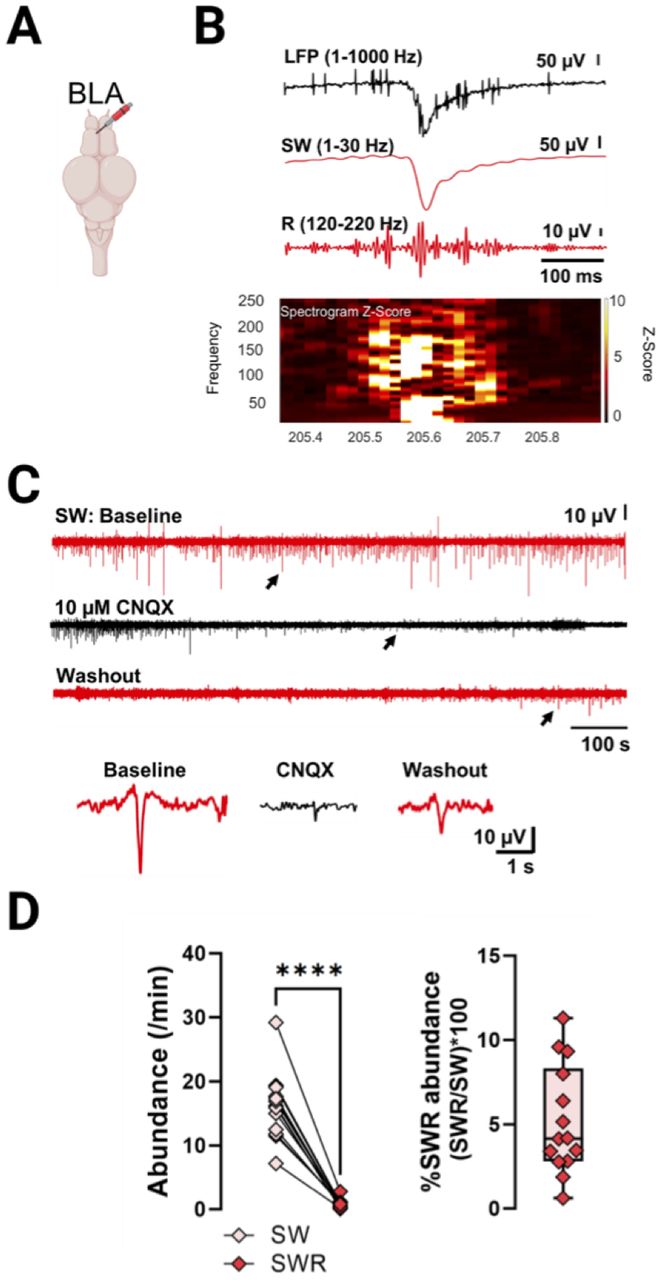
SWR complex in the BLA. A, Electrode placement in the BLA (frontomedial side). B, Representative SWR complex with frequency spectrogram shown. In this example the presence of extracellular spikes and embedded ripple can be seen. C, Example from a brain (n = 1) treated with 10 μM CNQX: top red trace is the baseline, black represents the addition of the drug, and the bottom red trace shows the washout step. Bottom panel, Representative events from baseline, CNQX exposure, and during washout. D, Left, Quantification of SW and SWR abundance. Right, Percentage of SW events with embedded ripples (n = 14). For all plots, individual data point represent an animal. Paired and unpaired Student's t tests. ****p < 0.0001.


