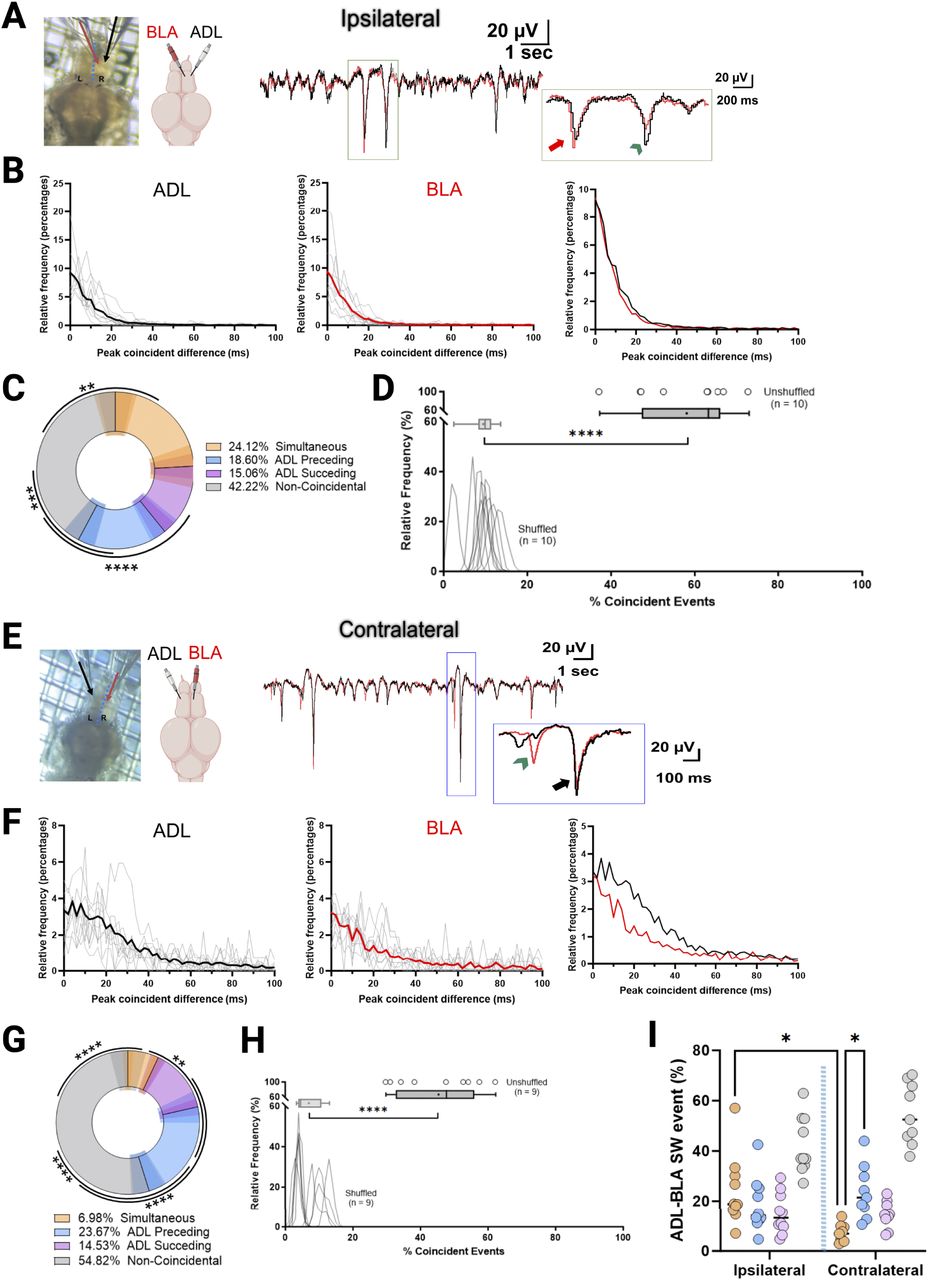
The ADL and BLA exhibit bidirectional communication. A, Left, Representation of ipsilateral electrode positioning in the BLA (red) and ADL (black). Right, Superimposed representative raw LFP trace showing a coincident event where the BLA precedes the ADL (red arrow) and one where the ADL precedes the BLA (green arrowhead) by ∼20 ms. B, Left and Middle, Relative frequencies (in percentage) of the peak coincident difference (ms) of spontaneous activity (SW) between ADL and BLA per brain analyzed (n = 10). Average is shown as thicker solid lines. Right, Plotted average. C, Quantification of the percent of events that were simultaneous (peak detection between −5 and 5 ms), ADL-preceding (peak detection between −100 and −5 ms), ADL-succeeding (peak detection 5–100 ms), and noncoincident (peak detection >100 ms; n = 10). Shaded areas represent the SEM for each group. One-way ANOVA with Tukey's multiple-comparisons tests was performed. D, Histogram of the percentage of coincident events (simultaneous, ADL-preceding, and ADL-succeeding) for both shuffled and unshuffled data. Peak events from the BLA were randomly shuffled (1,000 times) for each recording and the relative frequency plotted. The unshuffled percentage of coincident events per brain (true data points) is shown as dots with a relative frequency of 100%, similar fraction event coincidence values overlap—hard to see. E–H, The same as before but for the contralateral side. Green arrow shows a coincident event where ADL precedes the BLA by ∼90 ms, and the black arrow shows a simultaneous event. I, Quantification of events between ipsilateral and contralateral brain regions (dashed blue visually separates the regions on the graph). Two-way ANOVA with Tukey's multiple-comparisons tests. Only significance between same group from the ipsilateral and contralateral is shown. *p < 0.05, **p < 0.005, ***p < 0.0005, ****p < 0.0001. Paired Student's t test was performed on the percentage averages between the shuffled and unshuffled data.


