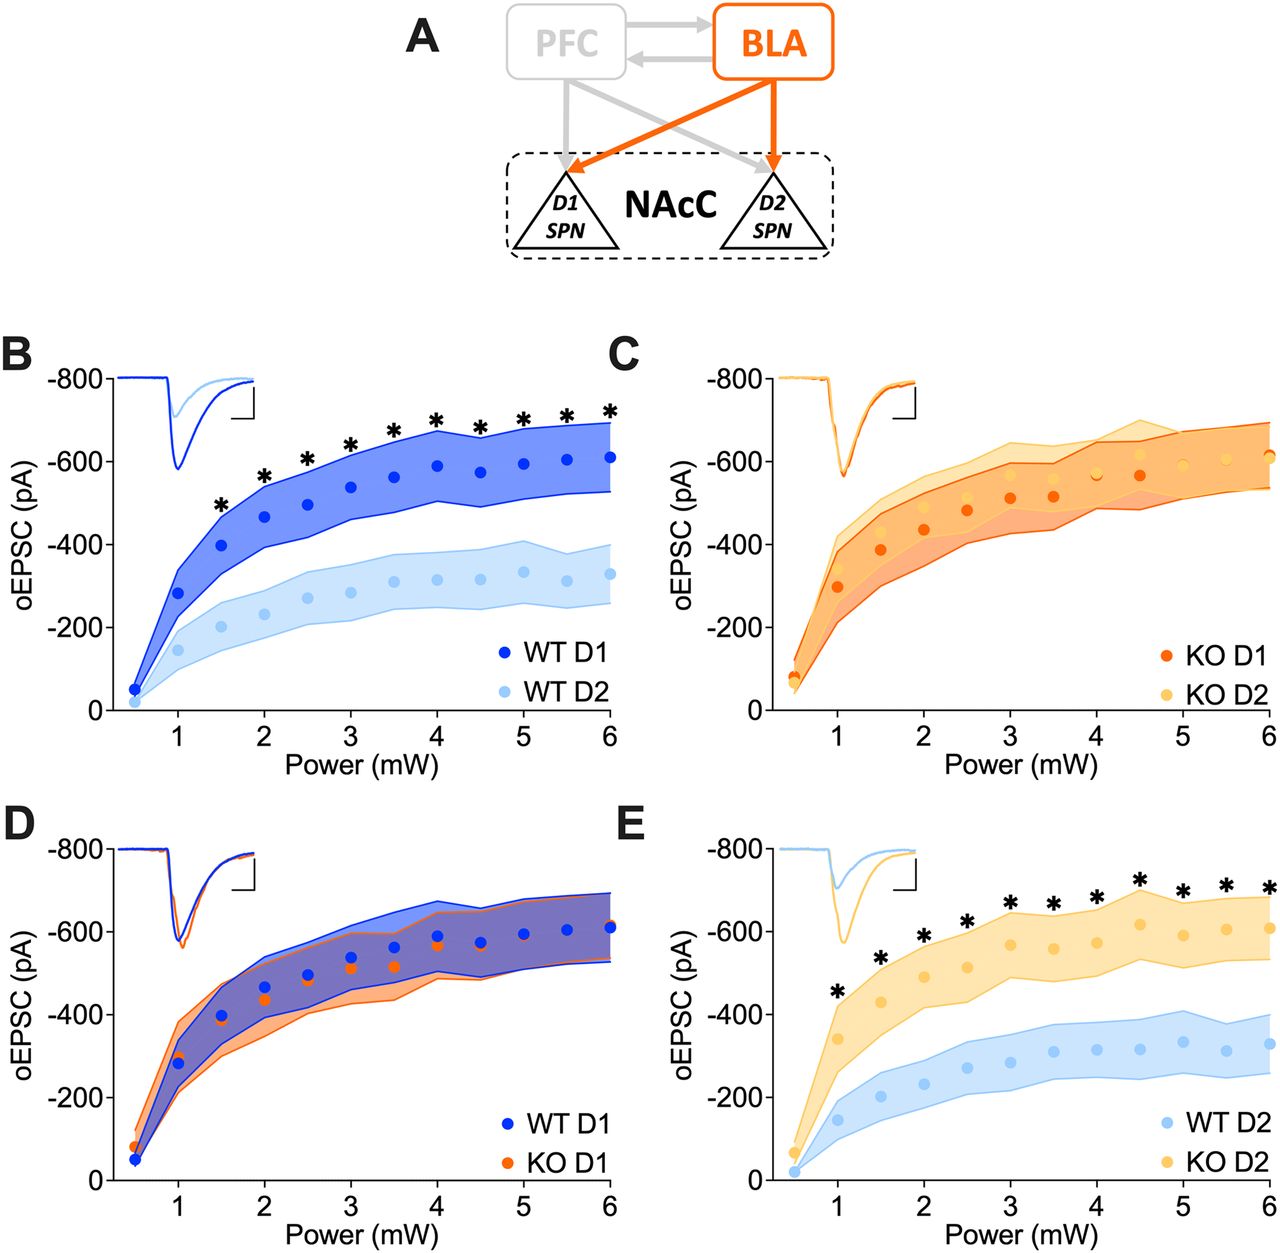
Increased glutamatergic transmission at BLA→D2 SPNs in FMRP-deficient mice. A, Schematic representation illustrating the interconnections between PFC-BLA-NAcC and emphasizing the specific BLA-NAcC (D1/D2 SPNs) pathway under scrutiny. B, C, Whole-cell recordings reveal that while in Fmr1 WT the BLA synaptic transmission in NAcC is stronger toward D1 than D2 SPNs, in KO it is equal. D, E, BLA→D2 SPN synaptic transmission is increased in the absence of FMRP but not that of BLA→D1 SPNs. B–E, A single dot represents group mean value at that stimulation intensity step. Data are shown as mean ± SEM in the XY plot. Unpaired t tests, *p values <0.05. Example trace in the top left; scale bar: 10 ms, 200 pA. WT D1 SPNs N = 14 (n = 18) in dark blue, WT D2 SPNs N = 13 (n = 16) in light blue, KO D1 SPNs N = 12 (n = 13) in dark orange, KO D2 SPNs N = 10 (n = 12) in light orange. Full statistics are provided in Extended Data Tables 2-1–2-4.


