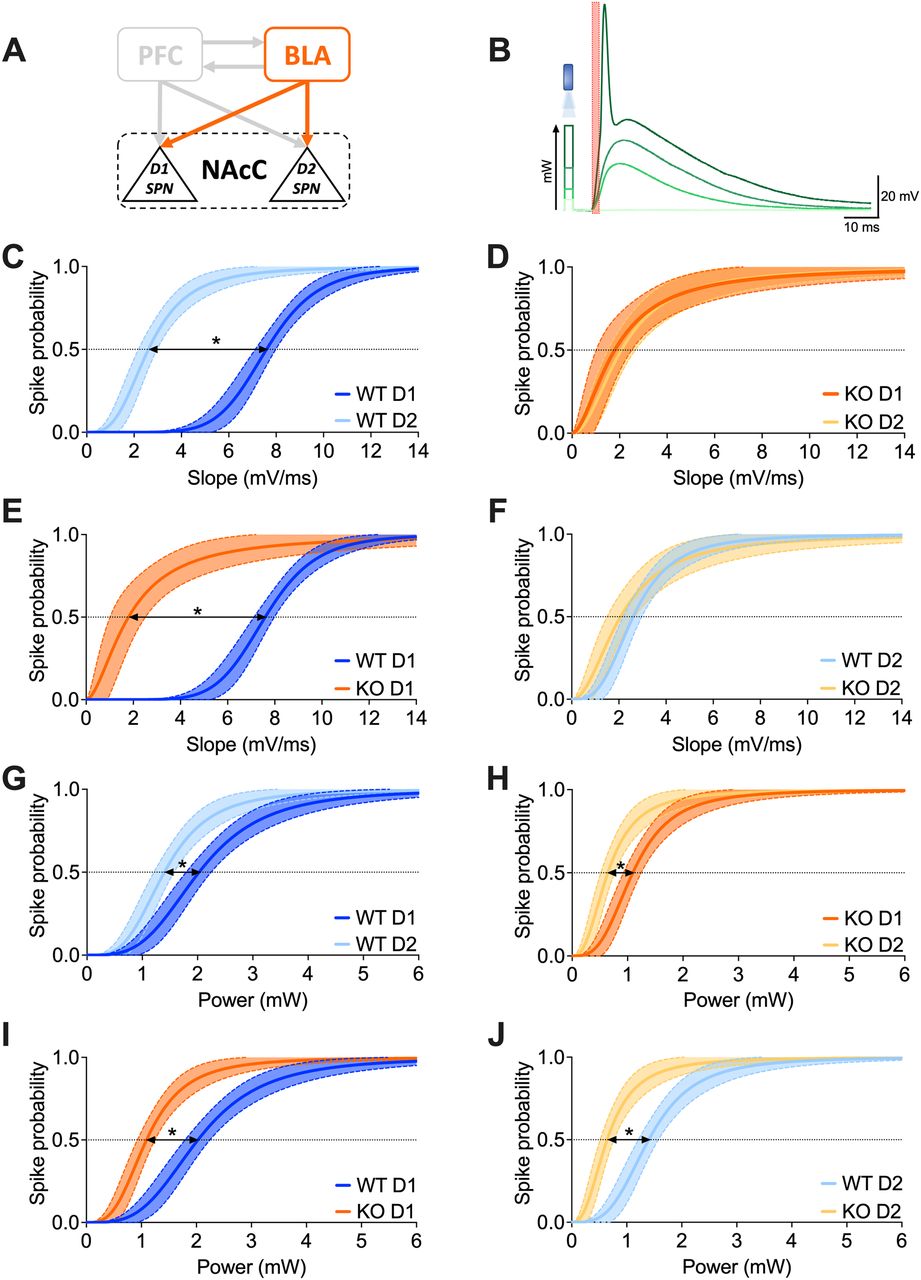
The firing probability of D1 and D2 SPNs stimulated from the BLA is higher in the absence of FMRP. A, Schematic representation illustrating the interconnections between PFC-BLA-NAcC and emphasizing the specific BLA-NAcC (D1/D2 SPNs) pathway under scrutiny. B, Example traces demonstrate that depolarization amplitude increases with optical stimulation intensity until the action potential threshold is reached; the red box indicates the slope extrapolation interval. C, D, In Fmr1 WT mice, stimulating BLA→NAcC synapses, there is a higher probability of triggering an action potential in D2 than in D1 SPNs given the same depolarization magnitude, whereas in KOs this discrepancy is absent. E, F, With equal depolarization magnitude, BLA→D1 SPNs but not in BLA→D2 SPNs synapses exhibit increased probability of firing in FXS mice compared with that in controls. G, H, D2 SPNs exhibit a higher propensity for firing compared with D1 SPNs under equivalent levels of BLA→NAcC optical stimulation in both WT and KO mice. I, J, In the absence of FMRP, both D1 and D2 SPNs show a higher probability of firing than control counterparts under the same level of BLA optical stimulation. C–J, Data are presented as nonlinear fitting regression curves ±95% CI in the XY plot. F test. Arrows with asterisks indicate statistical difference (p < 0.05) between half-maximal firing probability. WT D1 SPNs N = 6 (n = 8) in dark blue, WT D2 SPNs N = 5 (n = 8) in light blue, KO D1 SPNs N = 6 (n = 6) in dark orange, KO D2 SPNs N = 6 (n = 8) in light orange. Full statistics are provided in Extended Data Tables 5-1 and 5-2.


