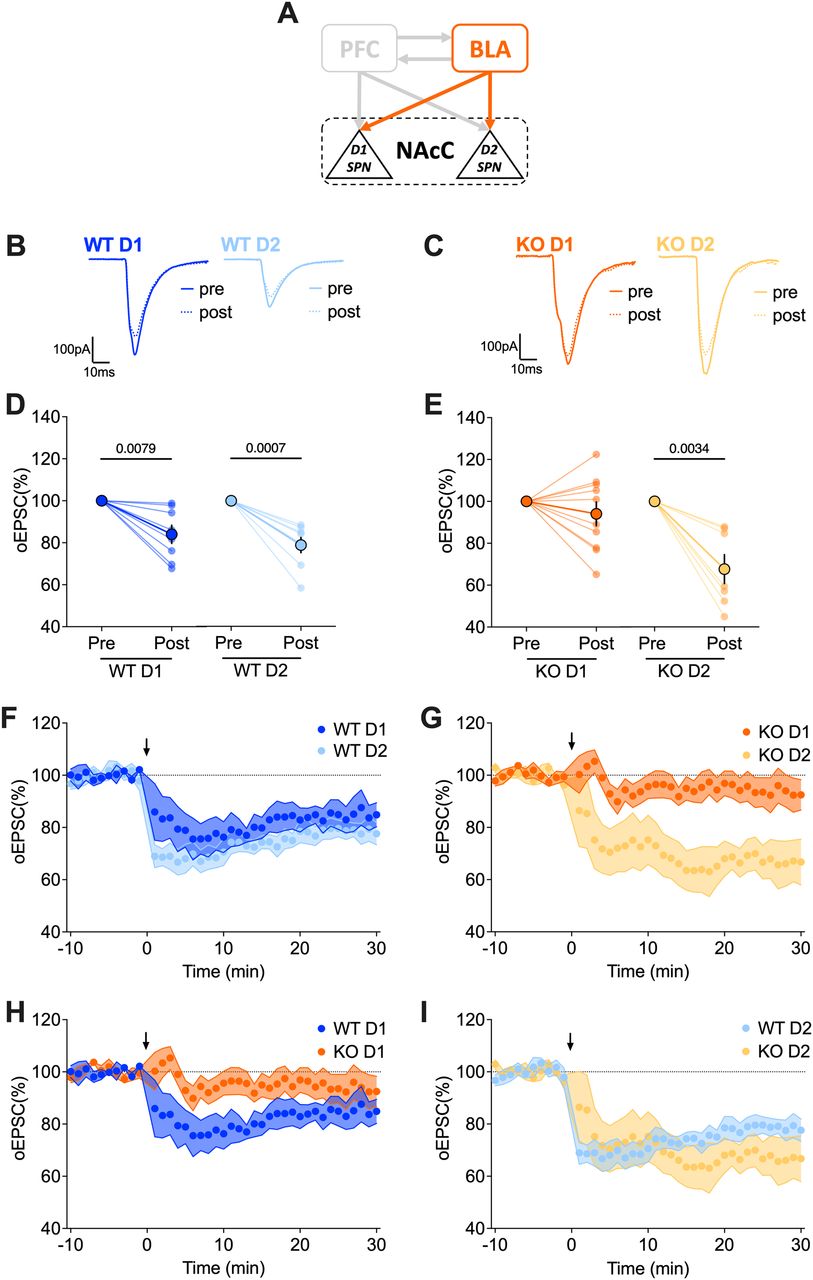
Lack of LTD in FXS mice is specifically observed in the BLA→D1 SPN pathway. A, Schematic representation illustrating the interconnections between PFC-BLA-NAcC and emphasizing the specific BLA-NAcC (D1/D2 SPNs) pathway under scrutiny. B, C, Example traces illustrate the difference between the baseline (solid line) and the response 20–30 min after 10′–10 Hz stimulation (dashed line). D, E, Pre-post analyses comparing oEPSCs at the baseline and 20–30 min after 10′–10 Hz stimulation reveal that LTD is specifically absent in BLA→D1 SPN synapses of Fmr1 KO mice. F–I, Average time courses of mean oEPSCs demonstrate the LTD induced by 10′–10 Hz stimulation (indicated by the arrow) at BLA-NAcC synapses per genotype (G, H) and cell type (I, J). D, E, Data are shown as pre-post individual experiments and group average ± SEM. Paired t test. P values <0.05 displayed in graphs. F–I, A single dot represents group mean value at that time point. Data are presented as mean ± SEM in an XY plot. D–I, WT D1 SPNs N = 8 (n = 9) in dark blue, WT D2 SPNs N = 8 (n = 9) in light blue, KO D1 SPNs N = 10 (n = 11) in dark orange, KO D2 SPNs N = 7 (n = 8) in light orange. Full statistics are provided in Extended Data Table 9-1.


