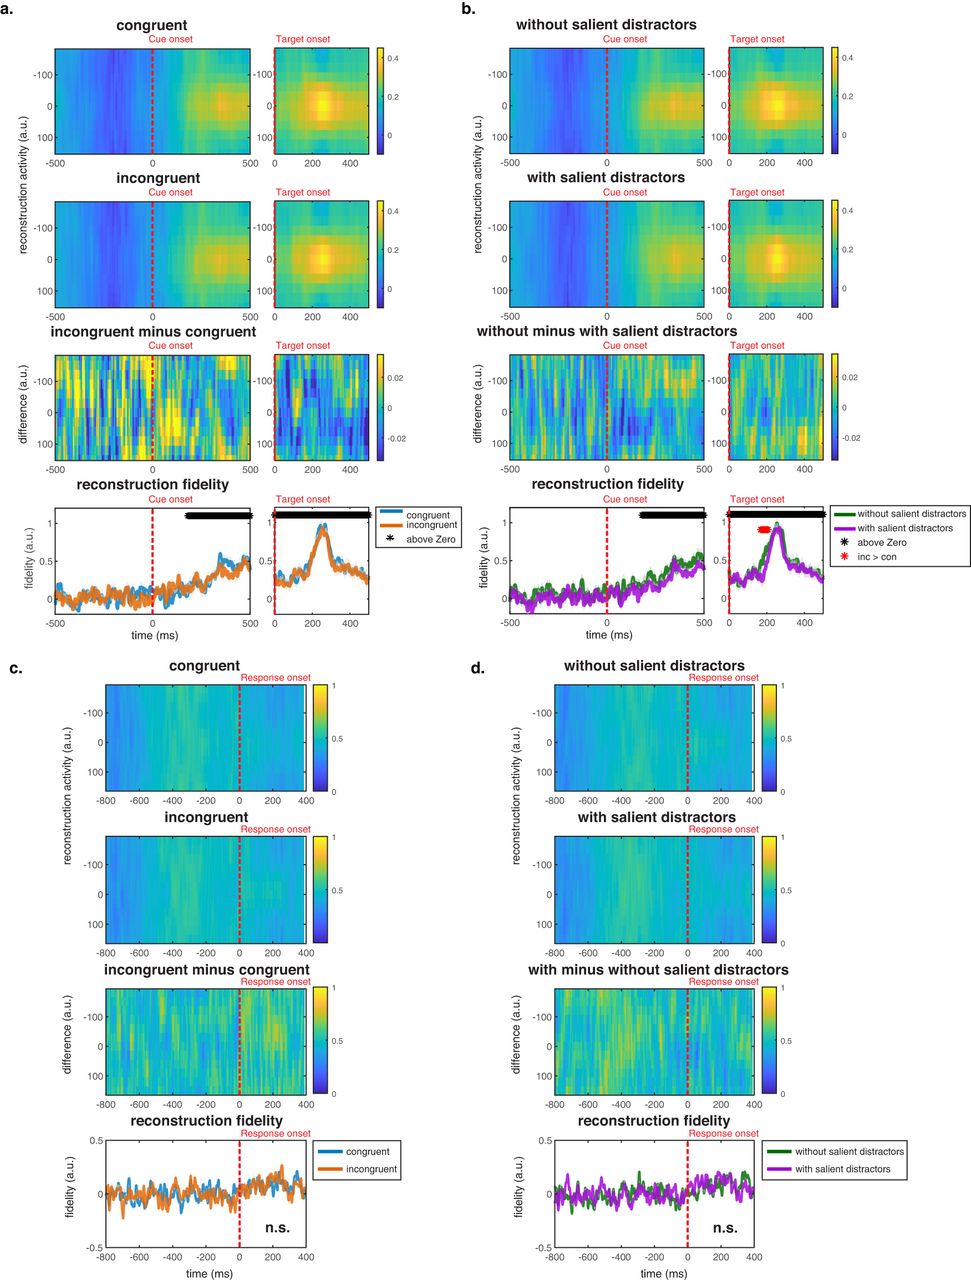
Spatial reconstructions based on visually evoked potentials (VEPs). a, b, Cue- and target-locked VEP-based reconstructions. c, d, Response-locked VEP-based reconstructions. The bottom panels represent the reconstruction fidelity of the VEP data. Black * signs on top of the fidelity curves indicate significant increases in reconstruction fidelity relative to zero. Red * signs represent significant main effects of distractor saliency on reconstruction fidelity. Multiple statistical comparisons were corrected using the cluster-based permutation method. Shaded areas represent the within-subject SEM of the fidelity values. “n.s.” indicates nonsignificant results, meaning they did not pass the corrected threshold of 0.05 based on the cluster-based permutation method.


