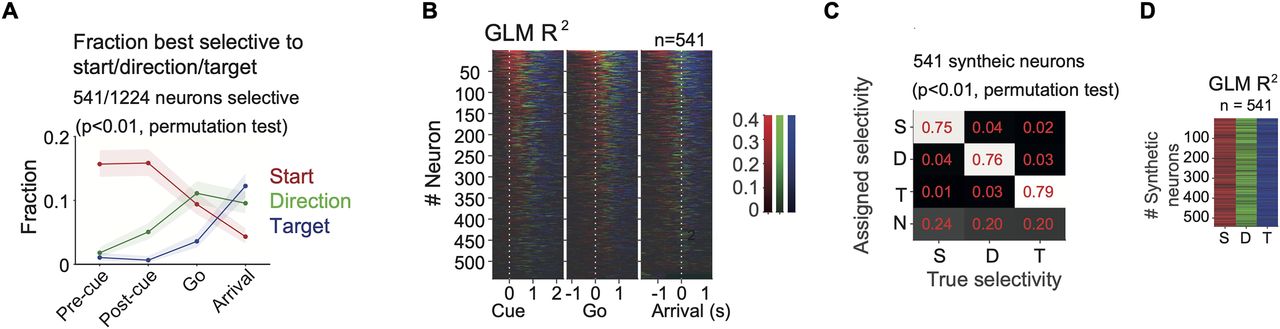
Temporal profile of the fraction of FOF neurons best selective to the start position, direction, and target position. A, The fraction of neurons best selective to the start position (red), the direction, (green) or the target position (blue) in four time windows. Shaded areas indicate the 95% binomial confidence intervals. “Pre-cue,” −300 to 0 ms to visual cue onset. “Post-cue,” 0–300 ms to visual cue onset. “Go,” 0 to 300 ms to go sound. “Arrival,” −150 to 150 ms to target poke as in Figure 1B. B, The R2 of GLMs among same neurons as in A in 300 ms causal sliding windows with 50 ms steps, aligned to the cue onset, go sound or target arrival. At each time point, the color represents the variable with the largest R2 and the saturation represents the R2 value. Neurons were sorted by the total mass of the R2s of start position, direction and target position for the three alignments respectively. C, Fraction of synthetic neurons most selective to each generative spatial variable. Each column represents 541 synthetic neurons that were designed to be selective to start position (S), direction (D), or target position (T), or nonselective (N). The vast majority of errors were false negatives (where a neuron was incorrectly labeled nonselective). D, The R2s of GLMs in synthetic neurons with specific spatial selectivity. Each column was a group of 541 synthetic neurons selective to start, direction or target, respectively. The color indicated the R2 of the model with the maximum R2, with the same scale as in B.


