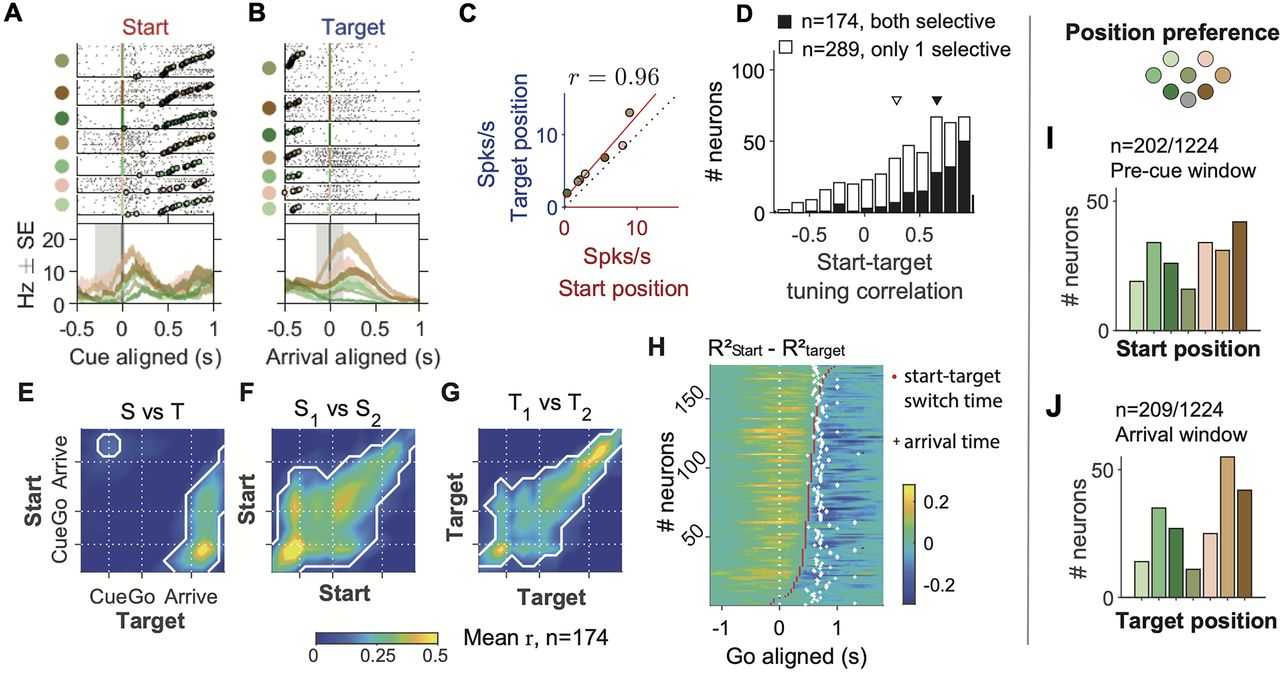
FOF neurons were tuned to specific positions. A, Raster plots and PETHs of an example neuron aligned to the cue, grouped by start position. The shaded gray area indicates
the time window to calculate the x-axis firing rate in C. The neuron was the same one as in Figure 3P–R. B, the same neuron aligned to target arrival, grouped by target position. C, The correlation between start position tuning and target position tuning in the example neuron. Red line denotes the total
least-square fit. r denotes the Pearson correlation between start and target tuning, which was termed start-target tuning correlation. D, The distribution of the start-target tuning correlation among start and (or) target selective neurons. Black bars are for
neurons selective to both start position and target position, and white bars are for neurons selective to only one of the
two variables (mean, [95% CI]: 0.66, [0.61, 0.70] for both selective and 0.29, [0.25, 0.34] for only 1 selective). Triangles
indicate the means of the two groups. E, The start-target tuning correlation in warped time windows aligned to the visual cue, the go sound and the arrival, averaged
across neurons with both start and target selectivity (n = 174). The white contours indicate the areas where correlation is significantly larger than 0 (p < 0.05 after Bonferroni correction). Different from C and D, these correlations were calculated between start tuning in half of the trials and target tuning in the other half of trials
and vice versa, and then averaged. F, Similar to E, but for the mean Pearson correlation between pairs of time windows for start position tuning in one half of trials versus
the start tuning in the other half. G, Similar to F, but for target position tuning. H, Time of transition from start position coding to target position coding in the 174 neurons. The color of the heat map indicates
the difference between R2s of the start position GLM and the target position GLM, calculated at causal sliding 300 ms time windows of 50 ms step size
aligned to the go sound. The red dots indicate the time of switching from <mml:math display="inline"><mml:msubsup><mml:mi>R</mml:mi><mml:mrow><mml:mrow><mml:mi mathvariant="normal">start</mml:mi></mml:mrow></mml:mrow><mml:mn>2</mml:mn></mml:msubsup></mml:math>Rstart2 higher to <mml:math display="inline"><mml:msubsup><mml:mi>R</mml:mi><mml:mrow><mml:mi>t</mml:mi><mml:mi>a</mml:mi><mml:mi>r</mml:mi><mml:mi>g</mml:mi><mml:mi>e</mml:mi><mml:mi>t</mml:mi></mml:mrow><mml:mn>2</mml:mn></mml:msubsup></mml:math>Rtarget2 higher. The white crosses indicate the averaged time of target poke for that session. I, The number of neurons preferring each start position in the “pre-cue” time window, among cells that had significant start
position selectivity in the “pre-cue” window (p < 0.01, permutation test for the start position GLM). J, The number of cells preferring each target position in the “arrival” time window, among cells that have significant target
position selectivity in that window (p < 0.01, permutation test for the target position GLM).


