Beyond Barrels: Diverse Thalamocortical Projection Motifs in the Mouse Ventral Posterior Complex
- Mario Rubio-Teves1,
- Pablo Martín-Correa1,
- Carmen Alonso-Martínez1,
- Diana Casas-Torremocha1,
- María García-Amado1,
- Nestor Timonidis2,
- Francesco J. Sheiban3,
- Rembrandt Bakker2,4,
- Paul Tiesinga2,
- César Porrero1,*, and
- Francisco Clascá1,*
- 1Department of Anatomy & Neuroscience, Autónoma de Madrid University, Madrid E28029, Spain
- 2Department of Neuroinformatics, Donders Centre for Neuroscience, Radboud University Nijmegen, Nijmegen 6525 AJ, The Netherlands
- 3NearLab, Department of Electronics, Information and Bioengineering, Politecnico di Milano, Milan 20133, Italy
- 4Inst. of Neuroscience and Medicine (INM-6) and Inst. for Advanced Simulation (IAS-6) and JARA BRAIN Inst. I, Julich Research Centre, Jülich 52428, Germany
-
Author contributions: M.R.-T., C.P., and F.C. designed research; M.R.-T., P.M.-C., D.C-T., and C.P. performed research; N.T., F.J.S., R.B., and P.T. contributed unpublished reagents/analytic tools; M.R.-T., M.G.-A., N.T., R.B., C.P., and F.C. analyzed data; M.R.-T., C.P., and F.C. wrote the paper.
Abstract
Thalamocortical pathways from the rodent ventral posterior (VP) thalamic complex to the somatosensory cerebral cortex areas are a key model in modern neuroscience. However, beyond the intensively studied projection from medial VP (VPM) to the primary somatosensory area (S1), the wiring of these pathways remains poorly characterized. We combined micropopulation tract-tracing and single-cell transfection experiments to map the pathways arising from different portions of the VP complex in male mice. We found that pathways originating from different VP regions show differences in area/lamina arborization pattern and axonal varicosity size. Neurons from the rostral VPM subnucleus innervate trigeminal S1 in point-to-point fashion. In contrast, a caudal VPM subnucleus innervates heavily and topographically second somatosensory area (S2), but not S1. Neurons in a third, intermediate VPM subnucleus innervate through branched axons both S1 and S2, with markedly different laminar patterns in each area. A small anterodorsal subnucleus selectively innervates dysgranular S1. The parvicellular VPM subnucleus selectively targets the insular cortex and adjacent portions of S1 and S2. Neurons in the rostral part of the lateral VP nucleus (VPL) innervate spinal S1, while caudal VPL neurons simultaneously target S1 and S2. Rostral and caudal VP nuclei show complementary patterns of calcium-binding protein expression. In addition to the cortex, neurons in caudal VP subnuclei target the sensorimotor striatum. Our finding of a massive projection from VP to S2 separate from the VP projections to S1 adds critical anatomical evidence to the notion that different somatosensory submodalities are processed in parallel in S1 and S2.
Significance Statement
Projections from the ventral posterior (VP) nucleus of the rodent thalamus to the primary somatosensory (S1) cortex are a paradigm in developmental and systems neuroscience. However, beyond the subset of axons that relay information from individual whiskers to S1, VP pathways remain poorly characterized. Here, we combined micropopulation tracing and single-cell labeling to produce a full account of the pathways arising from VP in male mice. We identify several VP subnuclei, each characterized by a specific thalamocortical axon wiring motif. Importantly, we show that the second somatosensory area (S2) is robustly and topographically innervated by specific populations of VP neurons, indicating that, at least for some somatosensory submodalities, S2 may be primary in function and hierarchically equivalent to S1.
Introduction
Thalamocortical pathways from the rodent ventral posteromedial nucleus (VPM) to the primary somatosensory cortex (S1) region that represents the mystacial vibrissae (“whiskers”; S1wk) are a key model in modern neuroscience (reviews in: O’Reilly et al., 2021; Staiger and Petersen, 2021; Deschênes and Kleinfeld, 2022). The development (Bandiera and Molnar, 2022), plasticity (Frangeul et al., 2016), synaptic circuitry (Holtmaat and Lee, 2023), and functional properties (Castro-Alamancos and Connors, 1997; Bruno, 2023; Oberlaender, 2023) of VPM–S1wk axons have been extensively analyzed, and their structures have been used to model the interactions between the thalamus and cortex (Markram et al., 2015; Borges et al., 2022).
Within VPM, the neurons innervating S1wk are typically arranged in elongated, cytochrome oxidase (CyO)-rich clusters (“barreloids”), which relay each information from an individual whisker (Van der Loos, 1976; Land et al., 1995; Haidarliu et al., 2008). Neurons in the dorsomedial portions of these barreloids innervate one and the same cortical column (Agmon et al., 1995; Land et al., 1995), arborizing focally in discrete Layer (L)4 cell clusters known as “barrels.” In contrast, neurons located ventrolaterally in the barreloids innervate the cortex in a more spread manner and may target both the second somatosensory area (S2) and/or the dysgranular zones of S1wk (Pierret et al., 2000; Bokor et al., 2008; Noseda et al., 2011; Zhang et al., 2021). Moreover, the two barreloid neuron populations may relay different signals (Yu et al., 2006; Alloway, 2008; Diamond et al., 2008).
Information on thalamocortical pathways from other ventral posterior (VP) complex territories is far more limited. Neurons in the lateral VP nucleus (VPL) are reportedly organized in clusters or “lamellae.” The VPL neurons relay to the cortex information from different postcranial zones of the body in rough topographic fashion (McAllister and Wells, 1981; Francis et al., 2008; Liao and Yen, 2008; Yamawaki et al., 2021). Likewise, specific clusters of neurons in the parvicellular VPM subnucleus (VPMpc) relay somatic, visceral, or gustatory information from the mouth and pharynx to the insular cortex and adjacent zones of S1 and S2 (Cechetto and Saper, 1987; Nakashima et al., 2000).
The wiring pattern of VP pathways has been investigated at the single-cell level only for VPM-to-S1wk axons (Gheorghita et al., 2006; Oberlaender et al., 2012). Many VP thalamocortical morphologies have been recently made available online in data repositories produced by high-throughput morphology reconstruction pipelines (Winnubst et al., 2019; Peng et al., 2021), but they have not yet been analyzed in the context of somatosensory systems function. Moreover, distortions inherent to the process of registering cell morphologies to a standard 3D brain template preclude a reliable correlation with small-sized yet important tissue compartments such as layers, sublayers, barreloids, lamellae, etc.
Hence, questions such as the origin and prevalence of VP projections reaching area S2 (Spreafico et al., 1987; Pierret et al., 2000; Liao and Yen, 2008; Noseda et al., 2011; Zhang et al., 2021), or the dysgranular domains of S1 (Bokor et al., 2008; Furuta et al., 2009) or the striatum (Erro et al., 2001, 2002; Alloway et al., 2006; Noseda et al., 2011; Smith et al., 2012; Hunnicutt et al., 2016), remain open. It is also unclear if these projections originate from separate cell populations, or from the same cells, through branched axons. Overall, the actual range of variation in nonbarrel axon morphologies is unknown. Elucidating these questions is key for modeling thalamocortical interactions as well as the flow of information across the rodent somatic and motor cortical areas (Theyel et al., 2010; El-Boustani et al., 2020; Hubatz et al., 2020; Clascá, 2023).
Here, we combined retrograde and anterograde micropopulation and single-cell labeling to reveal and compare the axon morphologies from neurons of different VP subnuclei in adult mice. Our results reveal important differences in the wiring of axons from the various VP subnuclei and indicate that rodent S2 is wired with the thalamus as a primary sensory area.
Material and Methods
Animals
Experiments were performed on adult (60–120 d old, 25–35 g body weight) wild-type C57BL/6 male mice. The choice of only male animals was intended to eliminate a possible confounding source of structural variability, as required for the single-cell and axonal varicosity high-resolution measurements performed in the study. All animals were bred at the Autónoma de Madrid University and housed under standard colony conditions, with food and water available ad libitum under a 12/12 h light/dark cycle. All experimental protocols were approved by the university Ethics Committee and the competent Regional Government agency (PROEX 175/16 and 179.3/21), in accordance with the European Community Council Directive 2010/63/UE. The results reported here are based on a total of 292 mice (15 for retrograde tracing experiments, 9 for immunohistochemistry experiments, 77 for anterograde micropopulation tracing experiments, and 191 for single-neuron transfection experiments). Due to the absence of contralateral thalamocortical projections, all experiments were carried out on both hemispheres to minimize the number of animals used.
Anesthetic procedures
Anesthesia was induced with an intraperitoneal (i.p.) injection of ketamine (0.075 mg/g body weight) and xylazine (0.02 mg/g body weight) in saline, at the start of the surgery, and maintained throughout the procedure by administering isoflurane 0.5–1% in oxygen through the gas anesthesia mask of a stereotaxic apparatus for small rodents (David Kopf Instruments, 923-B) and placed on top of a water-headed pad (Gaymar T-Pump, Stryker) adjusted at 37°C. The anesthesia level was monitored by checking the absence of withdrawal reflexes while keeping spontaneous ventilation. A subcutaneous (s.c.) bolus of saline (1 ml) was administered every hour for rehydration. Buprenorphine hydrochloride (0.075 mg/kg body weight, s.c.) was administered for postsurgical analgesia, complemented with ibuprofen (0.012 mg/ml) added to water bottles for the duration of the survival period.
At the time of sacrifice, animals were killed by an overdose of sodium pentobarbital (0.09 mg/g, i.p.) in saline vehicle.
Surgical procedure
With the animal's head positioned on the stereotaxic apparatus, its scalp was shaved, soaked in iodinated povidone, sectioned at the midline, and retracted to expose the skull. A small craniotomy was drilled in the parietal bone, and the subsequent injections were made at stereotaxic coordinates obtained from the Paxinos and Franklin (2019) mouse brain atlas. After the injection, the micropipette was left in place for 10 min before removal, wound disinfection, and suture. The animals were recovered on the water-heated pad before being returned to their cages, where they remained until the time of their killing.
Retrograde tracing experiments
Retrograde tracers were injected in the somatosensory areas: FluoroGold [FG; hydroxystilbamidine methanesulfonate, H-22845, Invitrogen Fluorochrome; 0.75% w/v in 0.1 M phosphate buffer (PB)], Fast Blue (FB; diamidino compound 253/50, Polysciences Europe; 0.1% w/v in 0.1 M cacodylate buffer; pH 7.4), and RetroBeads (Red RetroBeads, LumaFluor; Fig. 1a–c). The tracers were injected with borosilicate glass micropipettes [TW100F-4; World Precision Instruments (WPI); 10–15 μm inner tip diameter for FG and FB pipettes; 45 μm for RB pipettes]. Only one tracer was injected on each hemisphere. FG was delivered by means of nanoiontophoresis (Midgard Precision Current Source catalog #51590, Stoelting) by applying 3–4 μA positive continuous current cycles (7 s on/off) for 3–5 min. FB and RB were pressure injected using a precision electrovalve system (Picospritzer II, Parker Hannifin). To allow for the retrograde transport of the tracer, animals were killed 7 d after the surgery.

Neuronal labeling methods used to visualize the thalamocortical projections. a–c, Selective cortical injections of retrograde tracers. The panels show a representative injection of RetroBeads in area S2 (panel a) and the resulting labeling in the thalamus (panels b and c). d–f, Labeling of focal thalamic neuron “micropopulations” by means of iontophoretic injections of 10 kDA BDA. Panel d shows a representative injection site (black precipitate) in VP. Panels e and f show a coronal brain section containing a plexus of labeled thalamocortical arborizations in the cortex. Note that the injection site and the labeled axon in this experiment match those of the retrograde tracing experiment shown in panel a. CyO counterstain. g–m, Single-neuron labeling by means of Sindbis-Pal-eGFP mRNA electroporation (Porrero et al., 2016). g, Schematic diagram of the electroporation setup and injection parameters. h, Epifluorescence image of a fresh, water-mounted coronal section of the thalamus showing an isolated VPMc cell expressing high levels of eGFP. i, j, Higher magnification detail of the same cell before (panel i) and after (panel j) anti-GFP nickel-enhanced DAB IHC. k, Representative tissue section containing numerous fragments of a thalamocortical arborization. Pial surface is to the top. Layers (L) are indicated along the left border of the image (white arrowheads). l, Detail of an axon branch showing a terminal varicosity ending (black arrowhead) as well as numerous en passant varicosities (white arrowheads). m, Higher magnification of a nonvaricose axon segment in L6. Thionin counterstain. Scale bars: 1 mm (a, e), 250 μm (b, d, f, h), 100 μm (c, i, j, k), 5 μm (l, m). Abbreviations: Ins, insular areas; ml, medial lemniscus; PF, parafascicular nucleus; Po, posterior nucleus; S1wk, primary somatosensory area (whisker region); S2, secondary somatosensory area; VPL, ventral posterolateral nucleus; VPM, ventral posteromedial nucleus; VPMpc, parvicellular part of VPM.
Nanoiontophoretic biotinylated dextran amine (BDA) injections
To trace the axons from focal micropopulations of neurons, we injected lysine-fixable biotinylated dextran amine (BDA, 10 kDA; Invitrogen) 3% w/v in 0.01 M PB, pH 7.4 (Fig. 1d–f). Borosilicate glass micropipettes (TW100F-4, WPI) with an inner tip diameter of 5–10 μm were used. A silver electrode was inserted in the micropipette and connected to a Microiontophoresis Dual Current 260 source (WPI) which was used to deliver positive current cycles in the nanoampere range (300–500 nA, 1 s on/off) for 40 min. Animals were killed 7 d after the surgery.
Single-neuron electroporation
Isolated thalamic neurons were transfected by in vivo RNA electroporation (Porrero et al., 2016) of a Sind-Pal-eGFP RNA construct (Furuta et al., 2001; Kuramoto, 2019; Fig. 1g–m). The Sindbis viral subgenomic promoter drives high levels of eGFP expression, whereas the palmitoylation signal targets its transport to the axon membrane. Micropipettes were pulled from borosilicate glass capillaries (1B150F-4, WPI; inner tip diameter, 15–20 μm), backfilled with an RNA stock solution (1.8–2 g/l in 0.5 M NaCl) and mounted onto a holder (WPI) with both a pressure port and an electrode connection. A solution of 50–100 nl was injected by applying air pulses (10 ms) using a Picospritzer II, immediately followed by two trains of negative current square pulses (200 Hz, 50 V, 1 s) applied with a CS20 stimulator (Cibertec). Animals were allowed 58–60 h of postinjection survival before killing.
Tissue processing
At the time of killing, animals were killed as described above and perfused transcardially with 50 ml of saline (12 ml/min), followed by 50 ml of 4% paraformaldehyde (diluted in 0.1 M PB, pH 7.4; 4 ml/min). Brains were removed from the skull and postfixed overnight at 4°C in the same solution. The fixative was subsequently replaced by a cryoprotectant solution (30% sucrose in 0.1 M PB) for 48 h. Serial 50-μm-thick coronal sections were obtained on a freezing microtome (SM 2400; Leica).
For the retrograde tracing experiments, sections were divided in two separate, alternating series. The first was directly mounted onto gelatin-coated glass slides, air dried, dehydrated in graded ethanol, defatted in xylene, coverslipped with DePeX (SERVA Electrophoresis), and designated for analysis under an epifluorescence light microscope (Eclipse 80i; Nikon). The second series was histochemically stained for CyO activity (Wong-Riley et al., 1978), to allow the consistent recognition of nuclei and area borders.
In the anterograde tracing experiments, the two series of coronal sections were initially processed together to visualize the axonal BDA labeling. Endogenous peroxidase activity was blocked by incubation with H2O2 (0.66%) in 0.1 M PB for 15 min, followed by incubation in avidin–biotin–peroxidase (ABC, 1:100; Vectastain Elite, Vector Laboratories) dissolved in 0.1 M PB with 2% Triton X-100 (Sigma-Aldrich). After washing, peroxidase activity was made visible using the glucose oxidase-3,3′-diaminobenzidine (DAB; Sigma-Aldrich) nickel sulfate-enhanced method (Shu et al., 1988). One series (1:2 sections) was then counterstained with CyO histochemistry. The second series was counterstained with thionin after mounting. Finally, both series were dehydrated, defatted, and coverslipped as described above.
In the single-neuron labeling experiments, the sections containing the injection site were water mounted immediately after sectioning and observed under the epifluorescence microscope (excitation, 450–490 nm; emission, 515–565 nm) to check the presence of transfected neurons. In the cases in which a fluorescently labeled cell soma was observed in the thalamic regions of interest, all the sections were processed using metal-enhanced immunohistochemistry to amplify and stabilize the signal, thus making it readily visible in bright-field microscopy at relatively low magnifications (Fig. 1i,j). After endogenous peroxidase blocking, sections were incubated with rabbit anti-GFP serum (1:500, overnight; EXBIO), followed by a biotinylated goat anti-rabbit serum (1:100, 2 h; Sigma-Aldrich) and avidin–biotin–peroxidase kit (1:100, 2 h). Labeling was then visualized using the nickel sulfate-enhanced method (see above). The sections were mounted, lightly counterstained with thionin, dehydrated, and coverslipped.
Nine further mouse brains were used for calbindin, vesicular glutamate transporter type 2 (vGLUT2), GABA, or GAD65/67 immunolabeling on sections taken in the coronal, sagittal, or horizontal planes. In these brains, two alternate series of sections were obtained for each plane. One series was incubated in the endogenous peroxidase blocking solution, in the corresponding primary (overnight; Table 1) and secondary (2 h; Table 1) antibodies, and in the avidin–biotin–peroxidase kit (1:100, 2 h). Peroxidase was exposed using the glucose oxidase-3,3′-DAB without nickel sulfate enhancement, and the sections mounted as described above. The second series was stained for CyO.
Antibodies used in the study
Area delineation and nomenclature
To ensure consistency in tissue compartment identification, we used stereotaxically aligned serial sectioning and applied CyO and/or thionin counterstaining to all sections. Thalamic nuclei were delineated following Paxinos and Franklin (2012) mouse brain atlas borders. Cortical area borders were identified based on Paxinos and Franklin (2012, 2019). For experiments registered to the Allen Mouse Brain Common Coordinate Framework (CCF), somatosensory cortical areas were mapped following the standard CCF delineation (Wang et al., 2020). The two atlases coincide on most major area boundaries, although their nomenclatures are different. As a compromise, we kept the area S1 and S2 denominations (Paxinos and Franklin, 2019), with the CCF subarea delineations. In addition, we delineated some subareas within S2 based on the somatotopic map described by Carvell and Simons (1986).
Discrepancies between the two atlases in somatosensory area delineation are relatively minor. For example, Paxinos and Franklin draw a caudal “S1 upper lip region” interposed between the whisker barrel field and S2, whereas in the CCF, this region is part of S2. Regarding this point, we followed the CCF delineation, which is consistent with cytoarchitecture, as well as with earlier editions of the Paxinos and Franklin atlas (Paxinos and Franklin, 2001). Similarly, Paxinos and Franklin (2019) uses a cytoarchitectonic delineation for the insular areas (granular, dysgranular, agranular), whereas the CCF uses a different, cytoarchitectonic–functional delineation (gustatory, visceral, agranular) for these areas. In this case, we followed Paxinos and Franklin, except for the flatmaps generated after CCF registration (see below).
Registration of experiments to the Allen Mouse Brain CCF
The anterograde tracing micropopulation experiments were registered to the Allen Mouse Brain CCF (Wang et al., 2020). To do so, the sections in the CyO-stained series containing the injection volume and the cortical projections were scanned on Neurolucida (version 2017, MBF Bioscience) at 10× magnification (Eclipse 80i; Nikon). The scans consisted of x,y-mosaics of z-stacks of bright-field images, for which minimum-intensity projection images were generated. These were downsampled and reformatted so that they could be registered using a custom pipeline that we have already described elsewhere (Timonidis et al., 2024), which is largely inspired by the QUINT workflow (Puchades et al., 2019; Yates et al., 2019; Carey et al., 2023). The downsampled image series, segmentation masks, and registration files are available at EBRAINs Collaboratory (https://search.kg.ebrains.eu/instances/cc39e60c-f95e-4b3d-80c3-1ce703e0f4d6).
Generation of pixel density curves
To generate the density curves for each of the projection patterns, cortical column images from the micropopulation experiments were analyzed using a custom script to measure. The selected images were aligned parallel to the cortical column axis and to the bottom border of cortical L4 and cropped to ensure consistent dimensions. In CyO-counterstained sections, the black, high-contrast BDA axonal labeling was consistently segmented from the background using ilastik (Berg et al., 2019). For the rostral third of VPM (VPMr), caudal third of VPM (VPMc), ventrolateral VPM (VPMvl), rostral half of VPL (VPLr), and caudal half of VPL (VPLc), two images from three different experiments were used, for a total of six images; for anterodorsal VP (VPad) and VPMpc (in which the number of CyO-counterstained experiments available was smaller), four images from two different experiments were used. For each row in the segmented images, the total labeled pixel count was extracted and then normalized by dividing it by the total number of labeled pixels.
Generation of cortical flatmaps
To better understand the distribution and topography of VP projections to the somatosensory cortices, all tracing experiments were plotted onto cortical flatmaps. Retrograde and single-neuron tracing experiments were mapped to a flatmap of the cortex generated by isometrically mapping the pial surface contours measured on Paxinos and Franklin (2012) mouse brain atlas sections (Casas-Torremocha et al., 2022; Fig. 2a–c). Micropopulation anterograde tracing experiments registered to the CCF were mapped to a flat representation of the cortex (Harris et al., 2019). This was done by projecting the voxels to which the segmentation of their axons was mapped onto the pial surface of the cortex, following the direction of the cortical streamlines (perpendicular lines connecting equivalent points in the inner and outer surfaces of the isocortex; Wang et al., 2020; Timonidis et al., 2024; Fig. 2d).

Cortical flatmaps based on the atlases of Paxinos and Franklin or the Allen CCF. a–c, Generation of an isometric surface map of the mouse somatosensory areas (shaded in green). This map was constructed by aligning all the pial contours of Paxinos and Franklin (2012) coronal section diagrams as parallel lines along the dorsal watershed of the cerebral hemisphere (dashed black line in panels a and c). The magenta dot indicates the bregma; the magenta dashed line indicates the 0.0 coronal level. A coronal section at the bregma level is shown in panel b. The resulting cortical flatmap is shown in panel c. For reference, the position of the frontal and caudal poles of the cerebral hemisphere is indicated by yellow asterisks. d, Cortical flatmap visualization of the Mouse Brain CCF (Wang et al., 2020). For cross-reference, the same graphic conventions as in panel c are represented onto the flatmap. Abbreviations: Ins, insular areas; M1, primary motor area; S1, primary somatosensory area; S1dz, dysgranular region of S1; S1fl, forelimb region of S1; S1hl, hindlimb region of S1; S1m, mouth region of S1; S1sn, snout region of S1; S1tr, trunk region of S1; S1wk, whisker region of S1; S2, second somatosensory area; Str, striatum; V1, primary visual area; VPL, ventral posterolateral nucleus; VPM, ventral posteromedial nucleus; VPMpc, parvicellular part of VPM.
Single-neuron reconstruction
Single neurons were reconstructed using Neurolucida on live images captured by a bright-field microscope (Eclipse 80i, Nikon). The outer contour of every section and the neuron arborizations it contained were traced independently. Axonal arborizations were traced under the 40× objective, whereas dendritic arborizations were traced under the 60× or the 100× immersion oil objectives. Layer borders were identified based on the thionin counterstaining and drawn as closed contours. After tracing a whole neuron, the thickness of the section was systematically sampled across the whole series and averaged, which resulted in a mean thickness of 20–25 μm. This was approximately half of the 50 μm thickness at which the sections were originally cut, which was likely the result of dehydration (Carlo and Stevens, 2011) prior to mounting. This linear artifact was corrected by applying the appropriate shrinkage correction factor (section step/average thickness) on Neurolucida. Estimates of axonal length per area and layer were then obtained from these shrinkage-corrected individual sections on Neurolucida Explorer (MBF Bioscience).
Varicosity size and intervaricosity distances
Axonal varicosities (putative synaptic boutons; Table 8-1) and intervaricosity distances (Table 2) were measured live on the microscope using Neurolucida. To ensure consistency and minimize potential sources of variability, all measurements were performed by the same researcher. The regions of interest (ROIs) were drawn as contours using a low-power objective lens (4×). After switching to a 100× immersion oil objective, varicosities were sampled by overlaying a virtual grid on top of the contour and randomly selecting one of its 25 × 25 μm squares. The maximum projection contour was traced along the sharpness horizon of the equator of the varicosities contained throughout the depth of the selected square as a closed contour, with the aid of additional computer magnification (2–3×). To avoid sampling bias, the bottom and left borders of the squares were considered exclusion borders, and any varicosity that came in contact with them was not included in the sampling of that square. The analysis of intervaricosity distances followed a similar sampling scheme, measuring instead the shrinkage-corrected 3D cable length between every pair of varicosities contained within the square. For both types of analyses, 50 elements were measured on every ROI in three different sections, for a total number of 150 varicosities in each experiment. At least three experiments were measured for all categories, except for VPad, VPMpc, and posterior nucleus (Po; n = 2).
Mean path length (in microns) between centroids of axonal varicosities
Maximum projection areas in different varicosity samples were statistically compared using the Kruskal–Wallis test followed by Dunn's post hoc test for multiple comparisons. The Kolmogorov–Smirnov test was used to compare the frequency distribution of sizes between classes. The threshold level of significance was set at *p < 0.005, **p < 0.01, ***p < 0.001, and ****p < 0.0001. Both statistical analyses were computed using GraphPad Prism 8 (GraphPad Software). As an additional tool for comparison across cell types and axonal targets, we applied hierarchical cluster analysis using the Euclidean distance following Ward's method for the mean, median, standard deviation, and range of all varicosity sizes.
Results
Retrograde tracer injections restricted to S2 label large numbers of neurons in caudal VP
Fragmentary evidence from the literature indicates the existence of some direct projections from the VP complex to area S2. However, the abundance of the cells from which this projection originates and their distribution within VP is unclear. To visualize the position of VP cells projecting to S2, we performed selective retrograde tracer injections restricted to that area (Figs. 1a, 3a).
Injections confined to S2 labeled large numbers of VP neurons (Figs. 1a–c, 3b). In VP, the labeled cells were invariably located in the ventrocaudal third of VPM and caudal VPL, in a region that is largely nonoverlapping with that containing retrogradely labeled neurons after injections in S1. Retrograde tracer deposits within S2 at different anterior–posterior levels of the area indicated some degree of topographical order in this projection: rostral injections labeled VP cells that were more medially and rostrally located than the cells labeled by caudal S2 injections (Fig. 3, red, blue, orange). Overall, these experiments demonstrate that area S2 is massively innervated from caudal VP.
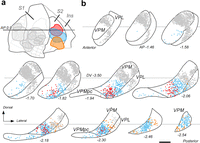
Neurons in the caudal third of VP massively innervate the second somatosensory cortex (S2). a, Representation on the cortical flatmap of retrograde tracer injections in S1 and in S2. Three retrograde tracer deposits in S2, with no involvement of S1, are represented in different colors. For comparison, several retrograde tracer injections in S1 are represented in gray. b, Position of the retrogradely labeled cell somata in VP. Diagrams depicting a series of coronal sections of the VP complex are shown from anterior (top-left) to posterior (bottom-right). Cell somata (dots) labeled in different experiments are plotted using the same colors as in panel a; each dot represents a labeled cell. In this diagram, VP subdivisions are identified using the standard denominations in Paxinos and Franklin (2019). AP levels are indicated under each section. Scale bar: 250 μm (b). Abbreviations: GI, granular insular area; S1, primary somatosensory area; S2, second somatosensory area; Str, striatum; VPL, ventral posterolateral nucleus; VPM, ventral posteromedial nucleus; VPMpc, parvicellular part of VPM.
Complementary calcium-binding protein expression patterns distinguish caudal from rostral VP
To investigate if the VP territory innervating area S2 correlates with differences in calcium-binding protein (parvalbumin and calbindin) expression levels, we examined in situ hybridization (ISH) images in coronal and parasagittal sections (Lein et al., 2007). We found that both proteins are expressed at moderate levels in nonoverlapping, complementary distribution patterns (Fig. 4a–d). The caudal third of VPM containing the neurons retrogradely labeled from S2 injections shows high levels of calbindin but no parvalbumin expression. In sharp contrast, the anterior part of VPM expresses parvalbumin but no calbindin. VPMpc and, to a lesser extent, VPL do not express parvalbumin but show substantial calbindin expression.

Complementary calcium-binding protein expression patterns delineate some subnuclei within VPM and VPL. a–d, ISH for parvalbumin (Pvalb gene; a, c) or calbindin D28k (Calb1; b, d) mRNAs shown in parasagittal (a, b) or coronal (c, d) section images segmented and false colored by object pixel intensity. The black arrowheads in panels a and b indicate the coronal levels shown in c and d, respectively. Data from the Allen Institute Mouse Brain Mouse ISH Atlas (Lein et al., 2007). Experiment numbers are #869 (a), #75457488 (b), #868 (c), and #79556672 (d). Warm (red) and cold (blue) colors are used to represent normalized intensity levels of expression (scale in panel b). e–j, Calbindin D28k-IHC patterns of the VP complex. (e, f) Parasagittal sections taken at a medial (e) or a lateral (f) VP level. g, h, Coronal sections at a rostral (g) or caudal (h) level. i, j, Horizontal sections taken at a dorsal (i) or a ventral (j) VP level. Note the consistent differences in staining between the rostral and caudal VPM. For cross-reference, black arrowheads in parasagittal and horizontal sections indicate the AP level of the coronal planes shown in panels g and h. k–o, vGLUT2 IHC patterns of the VP complex shows similar density and size of puncta (putative presynaptic brainstem terminals) in rostral and caudal VP. Three coronal section images of the thalamus at different AP levels are shown (k–m). Panels n and o show a high-magnification detail of the labeled puncta. These samples are taken from the regions indicated with the white squares in panels k and m. Scale bars: 500 μm (a–j); 250 μm (k–m), 25 μm (n, o). Abbreviations: eml, external medullary lamina; D, dorsal; LGd, dorsal lateral geniculate nucleus; LP, lateral posterior nucleus; LD, laterodorsal nucleus; M, medial; ml, medial lemniscus; PF, parafascicular nucleus; Po, posterior nucleus; R, rostral; TRN, thalamic reticular nucleus; VL, ventral lateral nucleus; VM, ventromedial nucleus; VPL, ventral posterolateral nucleus; VPM, ventral posterior medial nucleus; VPMpc, parvicellular part of VPM; ZI, zona incerta.
To confirm if such gene expression differences correlate with protein levels, we also performed immunohistochemistry (IHC) with specific antibodies against calbindin D-28k or parvalbumin on coronal, sagittal, or horizontal tissue sections (Fig. 4e–j). Observations in coronal and parasagittal sections immunostained for calbindin closely matched the ISH patterns; horizontal sections provided additional evidence for the difference between rostral and caudal VP subnuclei (Fig. 4i,j). Parvalbumin immunostaining, however, was less informative because of the uniformly high immunostaining across the VP neuropil, reflecting the high expression levels of this protein in thalamic reticular nucleus (TRN) cells (Fig. 4a,c).
As an additional exploration of the possible differences between the rostral and caudal parts of the VP complex, we examined the local abundance and apparent size of vGLUT2 immunoreactive puncta (Fig. 4k–o). vGLUT2 is selectively localized to neurotransmitter vesicle pools in presynaptic glutamatergic terminals and a general marker of highly active excitatory pathways (C. C. Lee and Sherman, 2011). This analysis revealed no obvious differences in vGLUT2 puncta abundance or size between rostral and caudal VP (Fig. 4n,o).
Micropopulation-level mapping reveals that different parts of VP innervate the cortex with different tangential and laminar projection patterns
In view of the spatial segregation of the neurons projecting to S1 and/or S2, we decided to re-examine in detail the tangential and laminar organization of the thalamocortical pathways originating from different portions of the VP complex.
To visualize the axonal pathways originated from small focal groups of VP neurons (“micropopulations”), we made low-intensity iontophoretic microinjections of BDA (one injection per hemisphere) and analyzed the labeled thalamocortical projections in serial stereotaxically aligned coronal sections counterstained with CyO (Fig. 1d–f).
Each injection produced a single, dense cluster of heavily labeled cell somata and neurites (Figs. 3a,f,j,n and 4a,e,j,n). Most clusters were generally under 250 µm diameter and thus selectively involved a very small fraction of the VP volume without any leakage in the micropipette track or in adjacent nuclei. Based on the number of labeled axons crossing the striato-pallidal boundary, we estimate that the injections usually labeled between 5 and 150 thalamocortical axons; for reference, the mouse VP complex has been estimated to contain ∼129,000 neurons (Erö et al., 2018). In the cortex, these experiments labeled focal dense focal plexuses of thalamocortical axons with Golgi-like detail. In most experiments, retrogradely labeled pyramidal cell somata were scant or absent. For an unbiased, high-precision mapping and comparison of the tangential position of the labeled axons on the cortical hemisphere, we registered the serial section images from each experiment to the Allen Mouse Brain CCF (Wang et al., 2020) using a neuroinformatics pipeline we have recently published (Timonidis et al., 2024).
Analysis of the tangential spread and laminar distribution of the labeled thalamocortical arborizations in a large number of microinjection experiments (n = 109) revealed seven different axonal projection motifs, which were always observed after injections in specific portions of the VP complex. Representative labeling experiments for each one of these motifs is shown in Figures 5 and 6. The position of the injections and their summed cortical labeling is illustrated in Figure 7.

BDA microinjections in different VPM domains reveal specific thalamocortical arborization patterns. a, A representative BDA deposit in the dorsal (“barreloids”) portion of rostral VPM (VPMr; case dex4i). b, Plotting of the axonal labeling in the cortex produced by automated segmentation. Labeled axons (in magenta) are shown in serial coronal section diagrams, from rostral (left) to caudal (right). c, Representation of the cortical labeling in the CCF cortical flatmap. d, Cortical column image showing thalamocortical axon labeling in S1wk; the pial surface is at the top, and the white matter at the bottom. Layer (L) borders are marked by white dashed lines. Note that BDA-labeled axons are concentrated on a dense single focus that matches the contour of an individual “barrel” as revealed by CyO. e, Density plot showing the average normalized pixel count per pixel row of the segmented labeling, measured from a total of six images from three different VPMr BDA injection experiments targeting S1wk (see Materials and Methods). The continuous curved line indicates the mean value, and the shaded area the standard deviation. f, A representative BDA deposit in the ventral portion of VPMr (case 16i). g, h, Serial coronal section diagrams (panel g) and CCF cortical flatmap (panel h) showing axonal labeling limited to the mouth representation zone in S1 (S1mo). i, Columnar sample image of the labeling in S1mo. Note that in this case, the labeled arborizations are more widespread, but still localized to S1mo. j, Density plot representing average normalized pixel count in S1mo (magenta). k, A representative BDA deposit in caudal VPM (VPMc) (case 21i). l, m, Serial coronal section diagrams (panel l) and CCF cortical flatmap (panel m) showing axonal labeling limited to S2. n, Columnar sample image of the labeling in S2. Note that in this case, the labeled arborizations are more widespread and localized to the anterior half of S2 that is known to represent the animal's snout and mouth. o, Density plot representing average normalized pixel count in S2. p, A representative BDA deposit in ventrolateral VPM (VPMvl; case 61d). q, r, Serial coronal section diagrams (panel q) and on the CCF cortical flatmap (panel r), showing axonal labeling. Note that the labeled axons target both the S1wk and S2. s, Columnar sample images of the thalamocortical axon labeling in S1wk and S2. t, Density plots representing average normalized pixel count in S1wk (blue) or S2 (magenta). All sections were counterstained for CyO. Scale bars: 250 μm (a, f, k, p), 1 mm (b, g, l, q), 125 μm (d, i, n, s). Abbreviations: S1, primary somatosensory area; S1fl, forelimb region of S1; S1hl, hindlimb region of S1; S1tr, trunk region of S1; S1dz, dysgranular region of S1; S1wk, whisker region of S1; S1sn, snout region of S1; S1mo, mouth region of S1; S2, second somatosensory area; GU, gustatory area; VISC, visceral area.

BDA microinjections in different VP domains reveal specific thalamocortical arborization patterns. a, A representative BDA deposit in rostral VPL (VPLr; case 39i). b, c, Serial coronal section diagrams (panel b) and CCF cortical flatmap (panel c) showing the distribution of labeled axons in the hindlimb representation of S1 (S1hl). d, Cortical column image showing thalamocortical axon labeling in S1hl. e, Density plot showing the average normalized pixel count per pixel row of the segmented labeling, measured from a total of four images from two different VPLr BDA injection experiments targeting S1 (see Materials and Methods). The continuous curved line indicates the mean value, and the shaded area the standard deviation. f, A representative BDA deposit in caudal VPL (VPLc; case 83d). g, h, Serial coronal section diagrams (panel g) and CCF cortical flatmap (panel h), showing the distribution of labeled axons. Note that in this case, the labeled axons are localized to both the forelimb representation zone in S1 (S1fl) and S2. i, Cortical column image showing thalamocortical axon labeling in S1fl. j, Cortical column image showing thalamocortical axon labeling in S2. k, Density plots representing average normalized pixel count in S1 (magenta) or S2 (blue; 6 images from 3 different experiments). l, Coronal section of the thalamus showing the center of a representative BDA deposit in anterodorsal VP (VPad; case 104d). m, n, Serial coronal section diagrams (panel m) and CCF cortical flatmap (panel n) showing the distribution of labeled axons in the narrow, “dysgranular” zone of S1 (S1dz). o, Cortical column image showing labeled thalamocortical axons in S1dz. p, Density plot representing average normalized pixel count in S1dz (4 images from 2 different experiments). q, Coronal section of the thalamus showing the center of a BDA deposit in the parvicellular subnucleus of VPM (VPMpc; case 10i). r, s, Serial coronal section diagrams (panel r) and CCF cortical flatmap (panel s), showing the distribution of labeled axons. t, Cortical column image showing labeled thalamocortical axons in the DI area. Note that in this case, in addition to the middle layers, labeled axons arborize in L1 (arrowhead). u, Density plot representing average normalized pixel count in Ins (4 images from 2 different experiments). All sections were counterstained for CyO. Scale bars: 250 μm (a, f, l, q), 1 mm (b, g, m, r), 125 μm (d, i, j, o, t). Abbreviations and graphic conventions as in Figure 5.

High-density mapping of micropopulation projection patterns reveals seven projection motif-specific subnuclei within VP. a, The contour of each of the injection sites in each of the valid BDA microdeposits is represented on a series of coronal section diagrams of the VP complex (Paxinos and Franklin, 2012). Stereotaxic coronal levels (caudal to bregma) from anterior (top-left) to posterior (bottom-right) are indicated under each diagram. Each deposit is shown on a single level, corresponding to its center. Deposits are labeled and color coded according to the cortical labeling motif they produced. Experiments illustrated in Figures 5 and 6 are highlighted in bold typeface. An asterisk (*) is used to indicate the cases in which terminal arborization labeling was present in the striatum. The portions of VP containing deposits with the same projection motif are shaded in a paler tone of the same color. b, Images of the BDA injections for all the experiments plotted on panel a. The name and coronal level of each experiment are indicated on the top-left and bottom-right, respectively. c–i, The cortical labeling from all the BDA injections located in each of the various VP subnuclei identified in this study is shown plotted on the Paxinos and Franklin flatmap. Labeling is color coded as the corresponding injection experiments in panel a. The number of experiments overlaid is indicated on the top right. c’–i’, Representation of the labeling on the CCF cortical flatmap of the same experiments. Abbreviations as in Figure 5. Scale bar: 500 μm (a), 250 μm (b).
Micropopulation labeling experiments in the trigeminal division of the VP complex (VPM)
Our high-density micropopulation sampling of the trigeminal (medial) portion of VP (VPM) consistently revealed the existence of three markedly distinct patterns, each originating in discrete portions of VPM. As a rule, axons labeled by these deposits were confined to the trigeminal subareas of S1 (mouth, snout, whiskers), S2, or both (Fig. 7a,c–i,c’–i’).
As expected from the literature, BDA microdeposits in the VPMr (Fig. 5a) labeled a single, narrow focus of varicose axonal arborizations located within the trigeminal representation of S1 (Figs. 5a–j and 7a,c,c’). The most profuse arborizations were localized to L4 and lower L3. Much sparser arborizations were also observed in L6a. Virtually no axonal branch entered L1. The dorsal portion of VPMr contains clusters of cells arranged in an isomorphic representation of the whiskers, usually referred to as “barreloids” (Haidarliu and Ahissar, 2001). The L4 arborizations labeled by injections in this region were segregated into one or more adjacent, discrete foci which matched the CyO-defined contours of the S1 barrels (Fig. 5a–e). In contrast, axons labeled by deposits in ventral regions of VPMr, outside the barreloid domain, targeted the same layers, but they were distributed more evenly in L4 and did not form discrete foci (Fig. 5f–l).
In striking contrast, axons labeled by deposits in the VPMc were mostly confined to S2, sometimes extending into GI as well (Figs. 5l and 7a,d,d’). Their terminal arborizations were also varicose and concentrated in L4 (Fig. 5k–o).
In addition, deposits situated in an intermediate level of VPM, which we refer henceforth as VPMvl (Figs. 5p–t, 7a,e,e’), produced yet another markedly different pattern of thalamocortical axon labeling. Note that we apply the term VPMvl to this subnucleus following Pierret et al. (2000), independently of its relative position compared with other VP subnuclei. In this case, the axonal arborizations extended more widely, always involving both S1 and S2 with highly specific patterns for each area. In S2, axonal terminal arborizations concentrated in Layer 4 as a dense, evenly distributed focal plexus. In contrast, the labeled axons arborized widely in the trigeminal domain of S1. They showed a marked tendency to concentrate in a narrow stratum located at the lower border of L4, at the base of the barrels observable with CyO staining. In addition, the axons left numerous but scattered branches in L2 and L3, which extended to the lower half of L1 (Fig. 5s,t).
The large numbers of microinjection experiments involving slightly different domains of the above three VPM subnuclei allowed us to correlate the position of thalamocortical axons with the location of the BDA deposits. This analysis (Fig. 8) showed a highly topographic arrangement of the VPM projections. Dorsal, intermediate, and ventral VPMr axons targeted the whisker, snout, and mouth domains of S1, respectively (Fig. 8a). Thalamocortical projections to S2 from VPMc showed a clear, albeit more fuzzy, topographical correspondence (Fig. 8b). On its part, thalamocortical projections from the VPMvl subnucleus showed only a crude anterior–posterior topography (Fig. 8c).

Projections from the various VPM subnuclei follow specific somatotopy patterns. a, BDA deposits in different portions of the VPMr subnucleus innervate different somatotopic domains of S1. On the left, injection sites are color coded according to the specific S1 territory (S1mo, S1sn, S1wk) where their labeled axons terminate. On the right, using the same color code, an overlay of the projections labeled from all injections within a particular VPMr portion is represented on the CCF cortical flatmap. Coronal levels (AP) for the rostral and caudal limits of VPMr are indicated. b, Deposits in different portions of the VPMc subnucleus innervate different somatotopic domains of S2. Injection sites (left) are color coded according to the specific S2 territory (S2mo, S2sn, S2wk) where their labeled axons terminate (flatmap on the right). c, Deposits in VPMvl subnucleus (left) simultaneously innervate S1 and S2. Dorsal and ventral VPMvl portions target, respectively, posterior or anterior parts of these two areas (flatmap on the right). Other conventions as in Figure 5. Scale bar: 500 μm.
Although it was not the main focus of our study, our exploration with BDA microinjections also included two experiments in the parvicellular subnucleus of the complex (VPMpc; Fig. 7a,i,i’). The labeling in these cases was markedly different from deposits in the nearby VPMc and VPLc subnuclei. The axons labeled by the VPMpc injections selectively targeted the dysgranular insular (DI) cortex while avoiding S1 and S2 (Fig. 6q–u).
Micropopulation labeling experiments in the spinal division of the VP complex (VPL)
BDA microdeposits confined to the spinal (lateral) portion of the VP complex (VPL) labeled focal thalamocortical arborizations in the spinal territories of S1, namely, the forelimb (S1fl), hindlimb (S1hl), trunk (S1tr), and/or dysgranular zones (S1dys) of S1, as well as in S2 (Fig. 7a,f–h).
Microdeposits of BDA in the VPLr produced a dense and focal single patch of labeling in S1 (Figs. 6a–e, 7a,g). The terminal axon branches mostly concentrated in L4, but many of them extended radially into L2/3. However, the labeled axons did not significantly arborize in S2. A second, less dense group of terminal axon branches was present in L6a (Fig. 6d,e).
In contrast, the axons labeled by BDA injections in the VPLc did not only target S1, but S2 at the same time (Figs. 6f–k, 7a,h). In both areas, the arborizations were most dense in L4 with a less clear focalization into restricted tangential domains (Fig. 6i–k).
Finally, a third markedly selective pattern of thalamocortical arborization was observed at the most rostral portions of VP (approximately between AP −1.20 and −1.34 mm; Fig. 7a,f). This is a narrow and poorly defined neuron “shell” at the convergence of the rostral VPL, the anterior pole of VPM, and the cerebellar-recipient ventrolateral nucleus (VL; Alonso-Martínez et al., 2023). Our two BDA injections in this zone, which we refer to as the VPad nucleus, labeled axons that arborized selectively along the narrow dysgranular zone that separates the spinal and trigeminal territories of S1 (Fig. 6l–p).
Caudal VP neurons originate a substantial thalamostriatal projection
Injections in some VP subnuclei but not in others labeled axonal arborizations in the striatum. These arborizations, branched orthogonally from the main axonal trunks crossing the striatum, were relatively diffuse and elongated and contained numerous en passant varicosities (“Type I” thalamostriatal projections; Deschênes et al., 1995; Fig. 9a–e). BDA microinjections in VPMc (13/39) and VPMvl (14/23) frequently labeled some thalamostriatal branches, in contrast with VPMr, which almost never labeled branches in the striatum (1/35; Fig. 7f). Injections in VPMpc (2/2) labeled, in addition to the most ventral part of the dorsolateral striatum, some varicose branches in the amygdalostriatal transition area and the lateral amygdaloid nucleus.

VPMc and VPMvl axons target the caudolateral striatum. a, Representative example of a BDA microinjection in VPMvl (case 81i). b, c, Anterogradely labeled axon arborizations are visible in the caudolateral Str, indicated by arrows in panel b and shown at higher magnification in panel c. d, High magnification image showing a thalamostriatal branch (indicated by a black arrowhead) emanating from an axonal trunk as the former traverses the internal capsule. e, Varicose thalamostriatal axon branches. Varicosities are indicated by white arrowheads. f, g, Nine examples of BDA injections that labeled thalamostriatal arborizations are shown as color-filled contours in panel f following the same color code as in Figure 8. For comparison, several equivalent VP injection experiments that did not produce thalamostriatal labeling are represented by gray-filled contours. The labeling produced by each of the nine experiments is shown in panel g on coronal sections of the Str from the Paxinos and Franklin (2019) mouse brain atlas using the same color code. The AP level caudal to bregma (in mm) is indicated on the bottom-left corner of each coronal image. Scale bars: 500 μm (a, f, g), 1 mm (b), 250 μm (c), 25 μm (d, e).
The striatal region targeted by VP axons is a relatively small zone of the lateral and caudal putamen. Comparison between experiments reveals a loose but consistent correspondence between the injection position in VPMc or VPMvl and the distribution of the labeled arborizations in the striatum (Fig. 9g).
VP axons targeting S1 and S2 show relatively large varicosities
The Golgi-like staining of the anterogradely labeled axons made it possible to consistently delineate their varicosities under 100× oil-immersion optics and measure their maximal projection area (Fig. 10a–c). The quantitative results from this analysis are shown in Figure 10d–f. Descriptive statistics are available in Table 10-1; results for the comparisons of Dunn's post hoc as well as for Kolmogorov–Smirnov tests are available in Table 10-2. Axonal varicosities from VPMr in L4 of the trigeminal sector of S1 (whisker, snout, and mouth domains) were larger than varicosities in all other projections analyzed (Fig. 10f, top). In contrast, both VPMc and VPMvl established significantly smaller varicosities in L4 of S2 (Fig. 10f, middle). The VPMvl varicosities at the base of the barrels (“L4base”) of trigeminal S1 were even smaller, whereas the same axons formed substantially larger varicosities in L2/3 of trigeminal S1 (Fig. 10f, bottom). The smaller set of varicosities measured in VP axons were those in the striatum (Fig. 10, bottom).

VP axon varicosity sizes vary among subnuclei/target territories. a, High-magnification image of BDA-labeled varicose branches from VPMr in a L4 “barrel” of the S1 whisker zone (S1wk). b, Varicose branches from VPMc in Layer 4 of S2. c, Varicose branches from VPMvl at the base of the same L4 “barrel” of S1wk shown in panel a. d, Comparison of varicosity size (maximal projection area, μm2) among the axons from the various subnuclei of VP terminating in different cortical territories. Most classes were composed of three experiments, but VPad, VPMpc, and VPLc were represented by only two since we did not have more “pure” labeling experiments in that specific subregion. For comparison, varicosities in BDA-labeled posterior nucleus (Po) axons in Layer 5a of S1 (open violin; data from Rodríguez-Moreno et al., 2020) are shown on the bottom. Median is indicated by a continuous black line and quartiles by dotted lines. A hierarchical cluster dendrogram illustrating the clustering of varicosity classes based on their mean, median, standard deviation, and range of the varicosity sizes is shown on the left. For mean varicosity values, see Table 8-1. e, Scatterplot representing the 95% confidence intervals (CI) of the mean varicosity size (maximal projection area, μm2) of the same VP projections shown in panel d, to ease their comparison. (f, top) Frequency (% of the total) distribution comparison among varicosity sizes from either VPMr axons terminating in S1wk–L4, VPMr axons terminating in S1sn/mo, VPMc axons terminating in S2–L4, or VPMvl axons terminating in S2–L4 (Kolmogorov–Smirnov test; * p < 0.05). (f, middle) Frequency distribution comparison among varicosity sizes from either VPLr axons terminating in S1–L4, VPLc axons terminating in S1–L4, or VPLc axons terminating in S2–L4. (f, bottom) Frequency distribution comparison among varicosity sizes from either VPMvl axon terminating in S1–L2/3 or VPMvl axons terminating at the base of S1–L4 barrels (S1–L4 base). For detailed descriptive statistics, see Table 10-1. For detailed significance values of Dunn's post hoc and Kolmogorov–Smirnov tests, see Table 10-2. For additional comparison, varicosity sizes of thalamostriatal VPMvl axons as well as Po S1-L5A axons (Rodríguez-Moreno et al., 2020) are included. Scale bar = 5 µm.
Table 10-1
Descriptive statistics of axon varicosity size (μm2) measurements. Download Table 10-1, XLSX file.
Table 10-2
Significance levels of the statistical tests performed to compare varicosity sizes (maximal projection areas) among axons from different VP subnuclei terminating in specific areas and layers of the cortex. Comparison of median values using the Kruskal–Wallis test followed by Dunn’s post-hoc test for multiple comparison (shaded in gray), or the frequency distribution using the Kolmogorov-Smirnov (K-S) test (open squares) are shown. Download Table 10-2, XLSX file.
A hierarchical cluster analysis identified two main groups of varicosities based on the statistical parameters of their distributions (Fig. 10d). A first high-level cluster encompassed the “large” varicosities from VPMr, VPad, VPLr, and VPMc, as well as the VPMvl varicosities in S1–L2/3 and S2–L4. A second cluster grouped together “smaller” varicosities of VPLc, VPMpc, and VPMvl varicosities at the base of the S1–L4 barrels as well as the thalamostriatal varicosities.
Single-cell labeling reveals the branching pattern and total length of individual VP axons
Micropopulation labeling experiments revealed a substantial diversity in the projections from different VP subnuclei, but could not resolve whether branches to different targets are the result of single axon branching or mixture of different cell types. Moreover, absolute measurements of axon length and varicosity numbers, which are critical for circuit modeling, can only be obtained from fully labeled individual cells.
To this end, we transfected individual thalamocortical projection neurons using the Sindbis pal-eGFP RNA, applied through in vivo electroporation (Furuta et al., 2001, Porrero et al., 2016; Fig. 1g). These experiments were labeled with GFP usually one neuron, or sometimes 2–4 neurons, per brain hemisphere (Fig. 1h,i). The fluorescent labeling was amplified by applying antibodies against GFP and avidin–peroxidase complex reaction enhanced by nickel sulfate (Fig. 1j). This high-sensitivity protocol produced sharp black Golgi-like staining of the whole axon up to its most distal tips (Fig. 1k). Under the microscope, labeling was continuous, and many varicosities (putative synaptic varicosities) were visible in the terminal branches (Fig. 1l), In contrast, axonal trunks were not varicose and continuously stained despite their myelin sheaths (Fig. 1m).
A total of 71 neurons were transfected and recovered after sectioning the corresponding brains. The dataset presented here consists of 21 cells that were completely stained and sufficiently separated from any other neuron labeled in the same experiment to allow the confident reconstruction of their morphology. Light thionin counterstain of the tissue sections provided cytoarchitectonic reference for delineating nuclei, area, and layer boundaries.
Most neurons shared a number of common features, such as their multipolar, bushy dendritic arbors and a thin and a varicose axonal collateral in the lateral zone of the TRN. Their axonal trunk extended along the internal capsule and, in some cases, it gave off a varicose striatal branch (see below). The pallial segment of the axon usually extended for a short distance parallel to the L6–white matter border. Axons crossed this border only once and emitted an arborization of variable complexity into the overlying L6 at or near the point of entry. Some axons extended in L6b for a variable distance to finally form a second arborization in another area. The branching patterns as well as the laminar distribution of the axons varied consistently between cells from different VP subnuclei. The morphologies of these neurons are individually illustrated in Figures 11⇓⇓–14. The tangential distribution of their axons across the somatosensory cortical areas varied according to the localization of the cell soma within VP in strict topographical order (Fig. 15). The length distribution per area and layer of each axon is analyzed and compared in Figure 16 (full data available on Table 16-1). The most remarkable differences between cells in different subnuclei are summarized below.

Single-cell morphology reconstruction of individually labeled VPMr neurons. a–j, Two-dimensional projection of Neurolucida reconstructions for 10 different VPMr neurons transfected with Sindbis pal-EGFP mRNA. The cell soma, dendrites, and nonvaricose segments of the axon are represented in white. Varicose segments of the axon are color coded as indicated in the legend. For reference, in each terminal territory, a simplified diagram representing a coronal section of the target cortical area is shown. Borders between areas in the cortex are represented by continuous lines. The borders between L1 and L2 or between L4 and L5 are represented by dashed lines. The coronal (AP) section level is indicated under each cortex diagram. Terminal arborizations extended in the AP dimension and were thus visible across multiple 50-µm-thick sections. As a reference, the number of sections in which each arborization was contained is indicated in italics. Scale bar: 500 μm.

Single-cell morphology reconstruction of individually labeled VPLr or VPad neurons. a, b, Neurolucida reconstructions of two individually labeled VPLr neurons transfected with Sindbis pal-EGFP mRNA. c, Reconstruction of an individually labeled VPad neuron. Scale bar: 500 μm. Conventions as in Figure 11.

Morphology reconstruction of individually transfected VPMc or VPLc neurons. a–c, Neurolucida reconstructions of four VPMc neurons transfected with Sindbis pal-EGFP mRNA. In panel c, note that Neuron 16 axon had a collateral branch to Str (white arrowhead). d–f, Reconstructions of three individually labeled VPLc neurons. Conventions as in Figure 11. Scale bar: 500 μm.

Morphology reconstruction of individually transfected VPMvl neurons. a, b, Neurolucida reconstructions of two different VPMvl neurons transfected with Sindbis pal-EGFP mRNA. In panel a, note that Neuron 20 had a collateral axonal branch to Str. Graphic conventions as in Figure 10. Scale bar: 500 μm.

Tangential distribution patterns of the intracortical arborizations from individually labeled VP neurons match the micropopulation data. a, Position and relative density of the labeled thalamocortical arborizations represented on serial section-generated flatmaps (Fig. 1e–g). The cortical arborization from an individual neuron axon is represented on each map. The position of the labeled arborizations in each coronal section is represented as color bars of variable intensity to indicate differences in the density of the labeling. Compare with the morphologies represented in Figure 11 (Neurons 1–10), Figure 12 (Neurons 11–13), Figure 13 (Neurons 14–19), or Figure 14 (Neurons 20–21). On the top of each map, the cortical regions containing labeled arborizations in the supragranular layers are indicated in black letters. Note that some of the neurons had, in addition, simpler arborizations in L6 of another area; these are indicated in parenthesis and gray italic letters under the corresponding map. Higher color saturation represents higher arborization density. Arborizations are colored according to the VP subdivision in which the soma was located. b, VP coronal section diagrams representing the position of the cell somata of the neurons. VP subdivisions are shaded in paler hues of the same colors as in panel a. Scale bar: 500 μm. Abbreviations: S2fl, forelimb region of S2; S2hl, hindlimb region of S2; S2tr, trunk region of S2; S2dz, dysgranular region of S2; S2wk, whisker region of S2; S2sn, snout region of S2; S2mo, mouth region of S2; other abbreviations as in Figure 5.

Variation in axonal length per area/layer among individually labeled VP neurons. Length measurements (in millimeters) for each of the 21 neurons analyzed in this study are represented as color bars following the code indicated at the legend. For each cell, a simplified dendrogram of the axon is represented under the bars. Horizontal segments at the top of each dendrogram are used to represent the main terminal arborization(s) which target L4–3. The length of thalamostriatal branches (Str) is indicated in brown. Note that all neurons left a collateral branch in TRN (data not shown). Small branch tips crossing from some of the arborizations for a short distance into adjacent cortical areas were not represented if they totaled <3% of the total length. Compare with the morphologies represented in Figure 11 (Neurons 1–10), Figure 12 (Neurons 11–13), Figure 13 (Neurons 14–19), or Figure 14 (Neurons 20–21). For every neuron, axon length measurements per cortical area and layer are available in Table 16-1. Abbreviations: GI, granular insular area; M1, primary motor area; Str, striatum; other abbreviations as in Figure 5.
Table 16-1
Axonal length (in microns) per layer and area, for each individually reconstructed neuron. Download Table 16-1, XLSX file.
Rostral VP neurons (VPMr, VPLr, and VPad)
Ten cells had their soma located in VPMr (Neurons 1–10; Fig. 11a–j). Their most peculiar trait was that they formed a single focal tuft of dense terminal axon branches within a single, small point in S1–L4 and deep L3. For example, axons from neurons located in the dorsal portion of VPMr arborized in the whisker domain of S1, targeting each individual barrel, whereas more ventrally located VPMr neurons arborized their axons at the snout or mouth domains of S1 (Fig. 15). The axons always left some short branches in L6a, under their L4 tuft. In some VPMr neurons (4/10), an additional, smaller arborization was present in S2. These were less profuse and confined to Layer 6b. These small arborizations were always localized in S2 territories that matched the trigeminal domain targeted in S1 by the axon main arborization (Fig. 15).
Two cells were labeled in VPLr (Neurons 11–12; Fig. 12a,b), and their branching morphology was basically the same as that of VPMr cells, the main difference being that they targeted the spinal domains of S1. It should be noted, however, that the neuron projecting to the hindlimb domain of spinal S1 (S1hl) had a markedly less compact terminal arborization (Neuron 12 in Fig. 12b).
Our dataset included one neuron in the small, anterodorsal shell of VP that we have identified as VPad (Neuron 13; Fig. 12c). Its specific trait was that it targeted selectively the narrow dysgranular band of the cortex interposed between the trigeminal and spinal domains of S1 (S1dz; Paxinos and Franklin, 2019; Staiger and Petersen, 2021). The axon terminal arborization extended preferentially along the anterior–posterior dimension of S1dz, while some of its branches entered into the adjacent S1wk or S1fl domains (Fig. 15).
Caudal VP neurons (VPMc and VPLc)
Three single VPMc cells were fully reconstructed and analyzed (Neurons 14–16; Fig. 13a–c). Their defining trait was that they selectively targeted the trigeminal domain of S2 and lacked any arborizations in S1. As for VPMr neurons, their main cortical arborization occupied L4, but some cells showed a wider variation in the spread of their terminal branches (Neurons 15–17; Fig. 15). In addition, Neuron 16 displayed a substantial collateral arborization into the striatum (Fig. 13c).
Three VPLc cells (Neurons 17–19; Fig. 13d–f) were analyzed. Their defining feature was that they targeted simultaneously S1 and S2, in typical multifocal fashion (Clascá, 2023). Both terminal arborizations were of relatively similar size and located in somatotopically matching territories in the two areas (Fig. 15).
Ventrolateral VPM neurons (VPMvl)
Two isolated VPMvl cells (Neurons 20 and 21; Fig. 14a,b) were reconstructed. A unique feature of these neurons was their simultaneous targeting of the whisker-related domains of S1 and S2 (Fig. 15) with markedly different arborization patterns in each area. In S2, the axons established an arborization that was similar in laminar distribution to that of VPMc and VPLc, although considerably less profuse. In contrast, the S1 arborization of these axons extended more widely and arborized as a narrow tangential plexus at the deep edge of L4, as well as in a more dispersed fashion in L2, with some tips extending into deep L1. Moreover, one of the VPMvl neurons displayed a multibranched collateral in the striatum.
Combined micropopulation and single-cell data identify seven different projection systems within mouse VP
Our study shows that the thalamocortical axon architectures from neurons in the mouse VP complex are more diverse than previously understood. These differences are summarized in Figure 17. In this figure, we also provide an average of the estimated total number of axonal varicosities in the cerebral cortex for each of the VP cell types. This number was calculated by combining the single-cell axon length measurements with the intervaricosity distances measured in the BDA micropopulation experiments, for each of the projection subtypes in their target cortical areas (Table 2).

Projection motif-specific subnuclei of the mouse ventral posterior complex. Highly simplified morphologies of the axonal trees of each VP subnucleus are shown side by side. The total number of experiments (micropopulations, mp; single neuron, sn) supporting the projection type is indicated under each subnucleus acronym. Dashed lines indicate branches that may or may not be present in particular individual neurons of the pathway. The total varicosity numbers were calculated by dividing the mean axon length from single-neuron reconstructions by the intervaricosity distances measured on BDA-labeled axons (Table 2). At the bottom of the figure, five representative coronal section diagrams of the VP complex depict the approximate location of the neuronal populations originating each pathway. These diagrams are aligned along the dorsoventral (DV) axis. Coronal (AP) level is indicated under each diagram. Note that VPMpc data are based only on BDA micropopulation experiments, as our dataset did not include valid single-cell labeling experiments in this subnucleus. Abbreviations: amyg, amygdala; DI, dysgranular insular area; Dys, dysgranular region of S1; GI, granular insular area; INS, insular cortex; S1, primary somatosensory area; S2, second somatosensory area; TRN, thalamic reticular nucleus.
Neurons in VPMr, VPLr, and VPad share a similar morphology, but differ in the specific functional sector (trigeminal, spinal or dysgranular) of area S1 that they innervate. These axons typically target each a single small point in the cortex, where they arborize heavily and focally in L4–3 with additional branches in L6a. VPMr neurons are thus the ones that support the widely studied pathway from the “dorsomedial” VPM to the barrel cortex. This “monofocal” morphology is found in other low-convergence topographic thalamocortical projection neurons of the visual and auditory systems (Clascá, 2023).
Projection neurons in VPMc also show a typical monofocal morphology; however, their axons innervate area S2 and strictly avoid S1. Moreover, a fraction of them sends a branch to the sensorimotor striatum, consistent with previous bulk-labeling connection observations in rats (Erro et al., 2001, 2002; Alloway et al., 2006). Such branches arborize diffusely in the caudolateral putamen, a region known to process sensory–motor information from the face and mouth (Hintiryan et al., 2016).
Axons from VPMvl typically branch to innervate S1 and S2. In S1, they form a widespread arborization that targets both the base of the L4 barrels and, in a looser fashion, also L2–L1. In S2, they form a small arborization centered in L4–3. This description is largely consistent with previous observations in rats (Pierret et al., 2000; Bokor et al., 2008) and mice (Zhang et al., 2021); however, we did not see these axons specifically targeting the septa, although the axons that targeted the medial (“E”) S1 barrel row often extend branches into the adjacent S1dz. In addition, many VPMvl axons send small branches to the sensorimotor striatum.
VPLc axons typically form two widely separate branches, one in the posterolateral zone of S2 and another in spinal S1. In both areas, terminal arborizations are most dense in L4–3. The position of these arborizations seems to match the known representation of the same body part in both areas (S1, Chapin and Lin, 1984; S2, Carvell and Simons, 1986; 1987).
Finally, axons from VPMpc innervate each single zone in the cortex centered in the insular cortex and may spread to adjacent portions of S1 and S2. These arborizations are centered in L1 and L3–L5. VPMpc axons frequently give off branches to the striatum and/or to the amygdala as well.
Overall, the strong congruence between single-cell and micropopulation labeling patterns strongly reinforces each other and implies that, in most VP subnuclei, all neurons share the same axon wiring motif (Fig. 17). However, we cannot rule out that, in addition to the typical S1 + S2-targetting neurons, VPMvl may also contain some cells targeting only S2. In any case, our data demonstrate that the caudal portion of VPM that we identify as VPMc consists exclusively of neurons that specifically target S2 and do not project to S1 (Fig. 1d–f).
While the defining features of a wiring motif are consistently found in all neurons of a particular subnucleus, other features seem to be present only in some of its cells. For example, all cells in VPMc innervate densely and focally S2–L4, but not all of them have a branch to the striatum. Likewise, all VPMr neurons innervate focally S1–L4, but only some leave a small branchlet in S2–L6b. Such low-level cell-to-cell variability, reported by previous single-cell labeling studies of thalamocortical cells (Kuramoto et al., 2009; Ohno et al., 2012; Nakamura et al., 2015; Unzai et al., 2017), may, to a large extent, reflect the emergent, dynamic nature of axonal navigation and targeting (Clascá et al., 2016).
Discussion
We investigated thalamocortical projection motifs across the mouse VP complex. By combining population and single-neuron axon labeling, we identified several motifs, each arising from separate portions of VP (Fig. 17). Single-cell transfection labeling revealed the complete axon morphology of individual neurons, while micropopulation iontophoretic injections provided an “average” profile of the projections from a small, local neuron cluster.
The consistent results of a large number of micropopulation and single-cell data strongly support the identification of several VP projection motifs. The evidence for most of these morphotypes is robust and congruent with previous literature as well as single-cell morphology databases for most of these morphotypes (Winnubst et al., 2019; Peng et al., 2021). Because of our small sample of VPad experiments, however, the identification of this projection as a separate subtype awaits further anatomical and functional studies. Regardless, our data may be relevant for the design and interpretation of functional and computational modeling studies, as well as for the definition of cortical area hierarchies in mice.
Structural variation in VP pathways may be related to somatic topography or to sensory submodalities
The variation observed in VP axon architectures (Fig. 17) may, in part, relate to differences in the spatial resolution of sensory inputs from different parts of the body, to specific axonal adaptations for the relay of particular somatic sensory submodalities, or to both. For example, axons in some subnuclei (VPMr, VPLr, VPMc) target a single point in the cortex with high topographic order and minimal convergence. Hence, they preserve the segregation of inputs from separate points of the body and replicate it in the cortex (Woolsey, 1952; Waite, 1973; McAllister and Wells., 1981; Chapin and Lin, 1984; Carvell and Simons, 1986). Inputs from the forelimb, wrist, handpad, or digits are relayed to S1 through discrete VPLr “lamellae” (McAllister and Wells, 1981; Francis et al., 2008). Likewise, signals from the lips, face, or whiskers are relayed to S1 through specific VPMr “barreloids” (Van der Loos, 1976; Land et al., 1995, Haidarliu and Ahissar, 2001; Haidarliu et al., 2008). Even within the relatively small VPMpc, inputs from the tongue and oral cavity mucosa are partially segregated and relayed through specific pathways (Cechetto and Saper, 1987; Nakashima et al., 2000).
Orthogonal to the above somatotopic order, there is a rostrocaudal segregation in the VP of sensory modalities from any given region (Fig. 18). For example, proprioceptive, mechanosensory, or nociceptive spinal cord inputs are relayed, respectively, through rostral, intermediate, or caudal VPL (Francis et al., 2008). Likewise, single-whisker mechanoreceptive inputs are preferentially conveyed through the dorsomedial and rostral part of the VPM barreloids (Veinante and Deschênes, 1999; Haidarliu et al., 2008), while multiwhisker (Veinante et al., 2000), nociceptive (Guy et al., 2005), or visceral head inputs (Nomura and Ogawa, 1985; Cechetto and Saper, 1987) are relayed through more caudal/peripheral VPM. A similar rostrocaudal segregation has been reported in the somatosensory thalamus of other mammals (Berkley, 1980; Yokota et al., 1983a,b; Craig et al., 1994; Davidson et al., 2008).

Summary diagram of the pathways linking VP subnuclei with S1 and S2. Arrows indicate, in highly simplified form, the different thalamocortical pathways originated from specific subnuclei of the VP complex (bottom) with cortical areas S1 and S2 (top). On the right, two dashed-lines arrow profiles indicate the preferential sources of subcortical inputs to the rostral (top arrow) or caudal (bottom arrow), as described in the literature. Abbreviations: A, anterior; DCN, dorsal column nuclei; Dys, dysgranular region of S1; M, medial; PrV, principal nucleus of the trigeminal complex; SpVc, caudal part of the spinal nucleus of the trigeminal complex; SpVi, interpolar part of the spinal nucleus of the trigeminal complex.
Exceptions to the predominant point-to-point projection logic may reflect adaptations for the relay of particular sensory submodalities. For example, functional studies indicate that the VPMvl neurons simultaneously innervating S1 and S2 specifically receive multiwhisker trigeminal signals about contact with an object during the whisking cycle (Yu et al., 2006), as well as a small contingent of direct pyramidal L5 collateral projections (Liao et al., 2010; Sumser et al., 2017; Prasad et al., 2020). Thus, computations carried out by VPMvl neurons may have a more complex, integrative character than those of other VP neurons (Groh et al., 2014).
Likewise, VPLc neuron axons branch to innervate the separate representations of the postcranial body in S1 and S2. In both areas, they arborize focally in the middle cortical layers. The region that we identify here as VPLc receives abundant spinal inputs (Barraclough et al., 2024), particularly from dorsal horn laminae I–II (Gauriau and Bernard, 2004), and may thus preferentially relay thermalgesic and coarse tactile inputs, which are relevant for social and affective aspects of touch (Albe-Fessard et al., 1985; Bohic and Abraira, 2022; Leva et al., 2024; Taub et al., 2024).
Although VPMc neurons innervate area S2 in point-to-point fashion, some of them leave a branch in the sensorimotor striatum. VPMc receives caudal spinal trigeminal nucleus inputs and conveys thermalgesic and coarse tactile inputs from the face (Guy et al., 2005; Taub et al., 2024). Together, VPLc and VPMc resemble the caudalmost portions of primate VP, a region reportedly involved in the relay of thermalgesic information (Apkarian and Hodge 1989; Craig et al., 1994; Davidson et al., 2008) to primate areas S2 and granular insular (Burton and Jones 1976; Mufson and Mesulam, 1984).
An additional indication of functional differences between caudal and rostral VP relates to differences in calcium-binding protein expression. We find noteworthy that the caudal VP subnuclei express moderate levels of calbindin and no parvalbumin, while the rostral VP subnuclei express moderate levels of parvalbumin and no calbindin (Fig. 3; Chon et al., 2019). These complementary patterns bear some resemblance to those described in primate VP, where lemniscal and spinothalamic-recipient domains selectively express parvalbumin or calbindin, respectively (Rausell et al., 1992).
Lastly, our data suggest the existence of a specific subnucleus, VPad, whose axons selectively target S1dz (Fig. 17). Responses to movements of the limbs around joints and the stretch of muscle receptors have been recorded in an equivalent thalamic region in rats (Francis et al., 2008) as well as in S1dz (Chapin and Lin, 1984; Welker et al., 1984; Alonso et al., 2023). Rodent rostral VP and S1dz have been compared, respectively, to the superior VP nucleus and area 3a of primates (Chapin and Lin, 1984; Francis et al., 2008; T. Lee and Kim, 2012; Kim and Lee 2013). Future studies should clarify how VPad inputs to S1dz interact with signals from the caudal Po (Koralek et al., 1988; Frangeul et al., 2014; Osaki et al., 2022), or VPMvl, as noted above.
Differences in axon varicosity size among VP projections
In thalamocortical axons, synapses are preferentially located to varicosities (White et al., 2004; Rodríguez-Moreno et al., 2020). Correlation between varicosity size and postsynaptic effects is not strictly linear (Shepherd et al., 2002; Acsády, 2022; Koster and Sherman, 2024) although, in general, larger varicosities are present in fast-firing, highly-effective (“driver”) pathways (Sherman and Guillery, 2002; Theyel et al., 2010). Using 3D electron microscopy, we have shown that VPMr varicosities in S1wk–L4 are multisynaptic and have large active zones and neurotransmitter vesicle pools (Rodríguez-Moreno et al., 2018). Together with high spatial convergence, these features are believed to contribute to the high efficacy of their synapses (Bruno and Sakmann, 2006; Viaene et al., 2011). Here, we show that most VP axon varicosities in S1 and S2 are medium to large in size (Fig. 10). Comparison with the S1 varicosities from the higher-order Po nucleus showed the latter to be much smaller. Our findings thus seem consistent with reports showing that somatosensory inputs can drive S2 neuron firing effectively and with short latencies (Carvell and Simons, 1986; Hubatz et al., 2020).
Thalamocortical wiring identifies area S2 as a primary sensory cortex
The pathways carrying signals from all sensory modalities (except olfaction) terminate selectively on the neurons of the so-called “first-order relay” thalamic nuclei (Sherman and Guillery, 1996). In turn, neurons in these nuclei innervate densely and in topographic fashion the middle layers of one or more “primary” cortical areas (Jones, 2007; Polley and Takesian, 2022). These areas are the initial cortical sites for processing sensory input, playing a crucial cortical role in perceiving and interpreting sensory stimuli, and relay the output of their computations to other “higher” cortical areas.
Here, we show that area S2 receives massive and topographic projections from caudal VP, which arborize selectively on its middle cortical layers (Figs. 17 and 18). Spinothalamic and caudal trigeminothalamic pathways, which convey coarse tactile and thermalgesic signals, terminate densely in caudal VP (Pierret et al., 2000; Guy et al., 2005; Barraclough et al., 2024). Functional studies have shown similar onset latencies in both S1 and S2 following spinal or trigeminal stimulation (Kwegyir-Afful and Keller, 2004; Liao and Yen, 2008; Hubatz et al., 2020). Some of these studies explicitly concluded that somatosensory processing in S1 and S2 is parallel instead of hierarchical. Here, we provide anatomical evidence to support this notion.
In addition to VP, some somatosensory signals may reach S2 via Po projections (Theyel et al., 2010; Ohno et al., 2012; El-Boustani et al., 2020). However, Po neuron signals are powerfully filtered by both excitatory cortical L5 (Reichova and Sherman, 2004; Mo and Sherman, 2019; Sampathkumar et al., 2021; Mo et al., 2024) and inhibitory subcortical pathways (Bokor et al., 2005; Lavallée et al., 2005). Thus, their output conveys a more complex, combinatorial type of information (Groh et al., 2014; Ahissar and Oram, 2015; Casas-Torremocha et al., 2022).
Future studies should clarify the specific roles played by the various VP pathways targeting S1 and S2. In any case, the presence of a separate, topographic, and massive VP projection to S2 provides anatomical evidence that, in consonance with some previous functional studies (Liao and Yen, 2008; Goldin et al., 2018; Hubatz et al., 2020; Taub et al., 2024), S2 may act as the primary area for the processing of some somatosensory submodalities.
Footnotes
- Received June 11, 2024.
- Revision received July 29, 2024.
- Accepted August 20, 2024.
-
The authors gratefully acknowledge Drs. Takeshi Kaneko and Takahiro Furuta (Kyoto University) for their generous gift of the Sind-Pal-eGFP construct and to Dr. Cristian Smerdou for the preparation of this reagent used in the single-neuron labeling experiments. Discussions by Dr. Lucía Prensa, Dr. Pablo Rubio-Garrido, and Dr. Enrique Gonzalo-Martín are also acknowledged. Ms. Begoña Rodriguez and Ms. Marta Callejo are acknowledged for their excellent technical help. This work was supported by the FLAG-ERA grant NeuronsReunited (cofunded by the Netherland's NWO Grant 680-91-318 to P.T. and Spain's AEI Grant PCI2019-111900-2 to F.C.) and by Spain's Grant MCINN PID2020-115780GB-I00 to F.C.
-
↵*C.P. and F.C. share senior authorship.
-
The authors declare no competing financial interests.
- Correspondence should be addressed to Francisco Clasca at francisco.clasca{at}uam.es.
- Copyright © 2024 the authors




