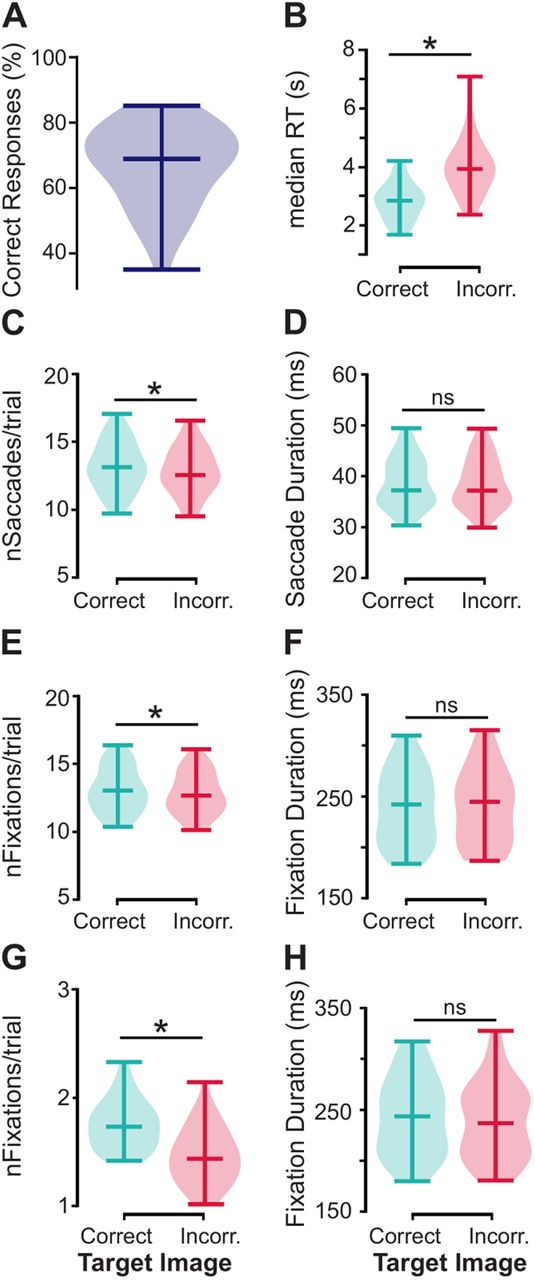
The behavioral performance was predicted by how often the images were visited. A, Percentage of correct responses regarding identifying the image that had changed, i.e., target image, B, The median reaction times (RT) were significantly longer for incorrect compared with correct trials (two-tailed paired t test: t(35) = −11.4, p < 0.001, Cohen's d = 1.43, CI95% = [−1.41, −0.98]). C, The number of saccades per trial was significantly higher for correct compared with incorrect trials (two-tailed paired t test: t(35) = 6.8, p < 0.001, Cohen's d = 0.21, CI95% = [0.26, 0.49]). D, The mean saccade durations (i.e., eyes in flight) did not differ between correct and incorrect trials. E, The number of fixations per trial was significantly higher for correct compared with incorrect trials (two-tailed paired t test: t(35) = 5.2, p < 0.001, Cohen's d = 0.16, CI95% = [0.15, 0.35]). F, The average fixation durations on each object were similar between correct and incorrect trials. The fixation metrics were further computed for the target images specifically. G, The number of fixations per trial for the target image was significantly higher for correct compared with incorrect trials (two-tailed paired t test: t(35) = 8.3, p < 0.001, Cohen's d = 1.16, CI95% = [0.22, 0.36]). F, No significant difference between correct and incorrect trials for the fixation durations on target images. The horizontal bar in the violin plots indicates the median value in B, and the mean value in (A), C–F. Dark blue plot, all trials. Cyan plots, correct trials. Pink plots, incorrect trials. ns, nonsignificant. *p < 0.001.


