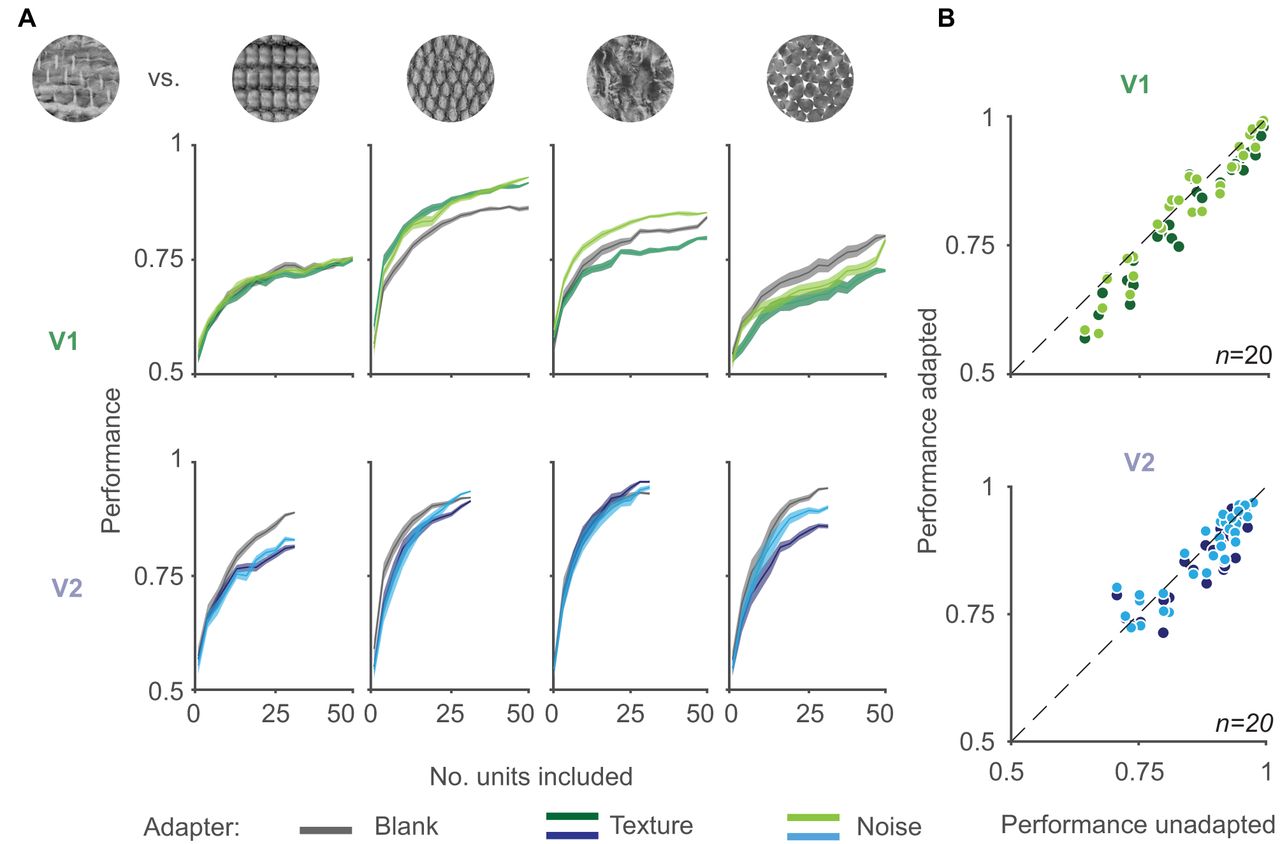
Classifier performance for texture discrimination. A, Example performance curves for different texture family pairs (columns) in one V1 (top, green) and one V2 (bottom, blue) population. Discrimination was evaluated for units that were unadapted (gray traces) or adapted to a texture (dark green or blue) or noise stimulus (light green or blue). Texture pairings that were tested for discriminability for each case are illustrated at the top. B, Population performance before (abscissa) and after adaptation (ordinate) to textures (dark colors) and noise (light colors). Results are shown for 20 pairwise comparisons, involving five distinct populations in each area, each assessed with four pairwise combinations of textures. Population sizes were matched at 30 neurons across recording sessions. Sessions in which fewer than 30 units were recorded simultaneously were not included in this analysis.


