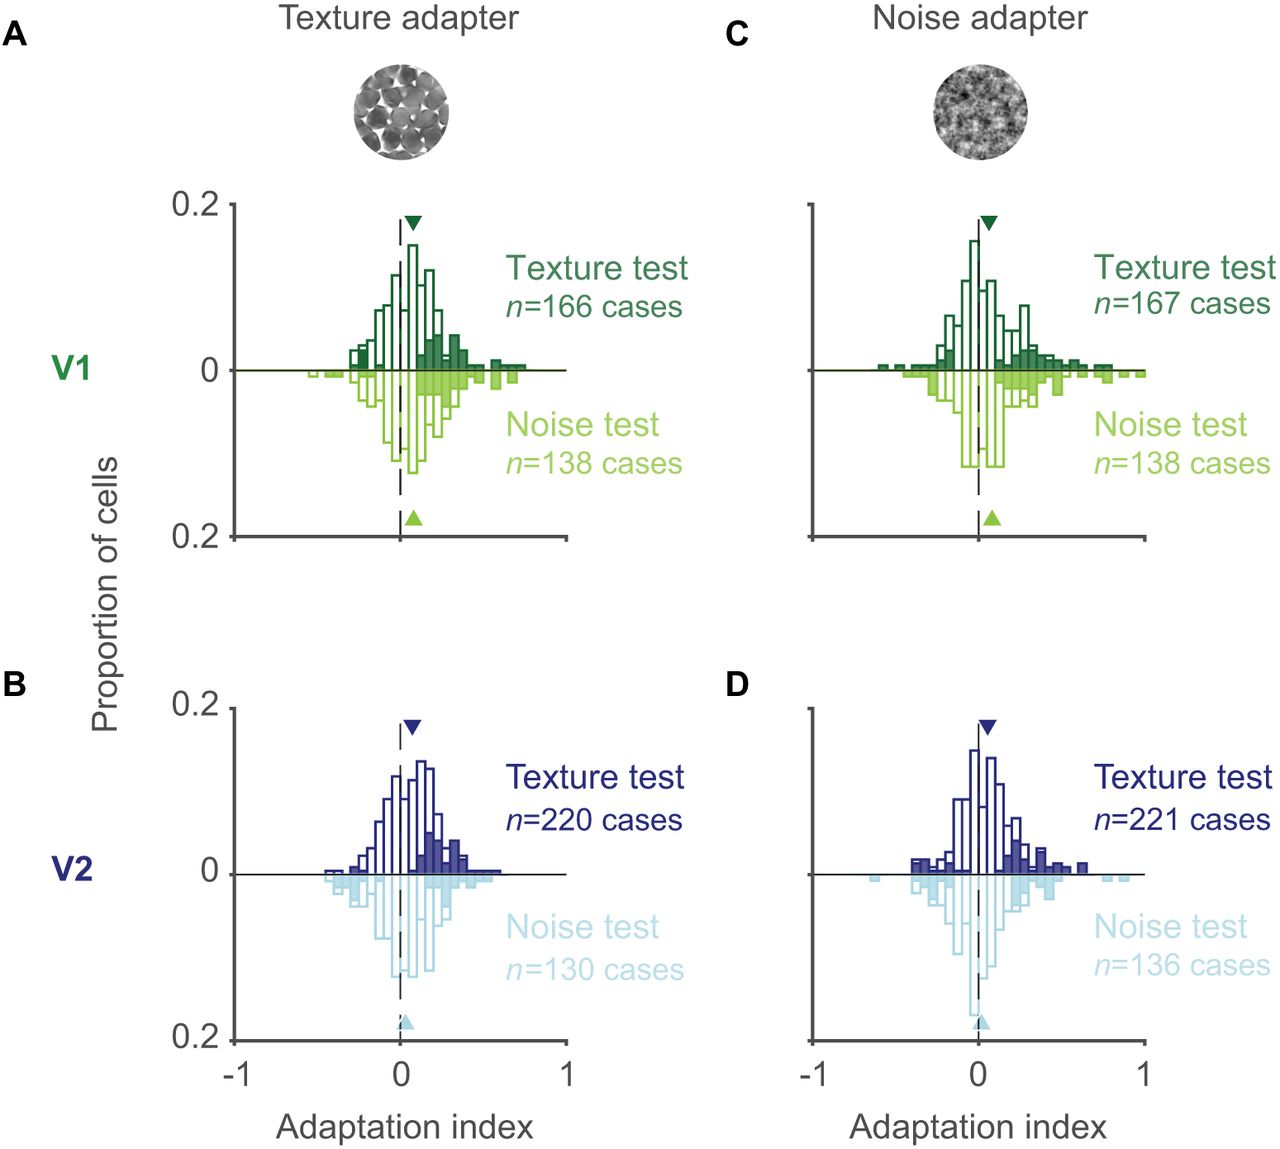
Dependence of adaptation effects in V1 and V2 on higher-order texture statistics. A, B, Distribution of adaptation indices for V1 (A) and V2 (B) after adapting with a texture and testing with either a texture (upright, dark traces) or noise (flipped, light traces) stimulus. Cases with significant adaptation indices are shown with filled bars. Mean of distribution is indicated by triangle. C, D, Distribution of adaptation indices for V1 (C) and V2 (D) after adapting with a noise stimulus and testing with either a texture (upright, dark traces) or noise (flipped, light traces) stimulus. Flipped and upright histograms contain a different number of cases as we only calculated adaptation indices for cases in which there was a measurable response, either before or after adaptation. Note that there is only one case per neuron as this analysis involved responses to the test stimulus from the same texture family as the adapter.


