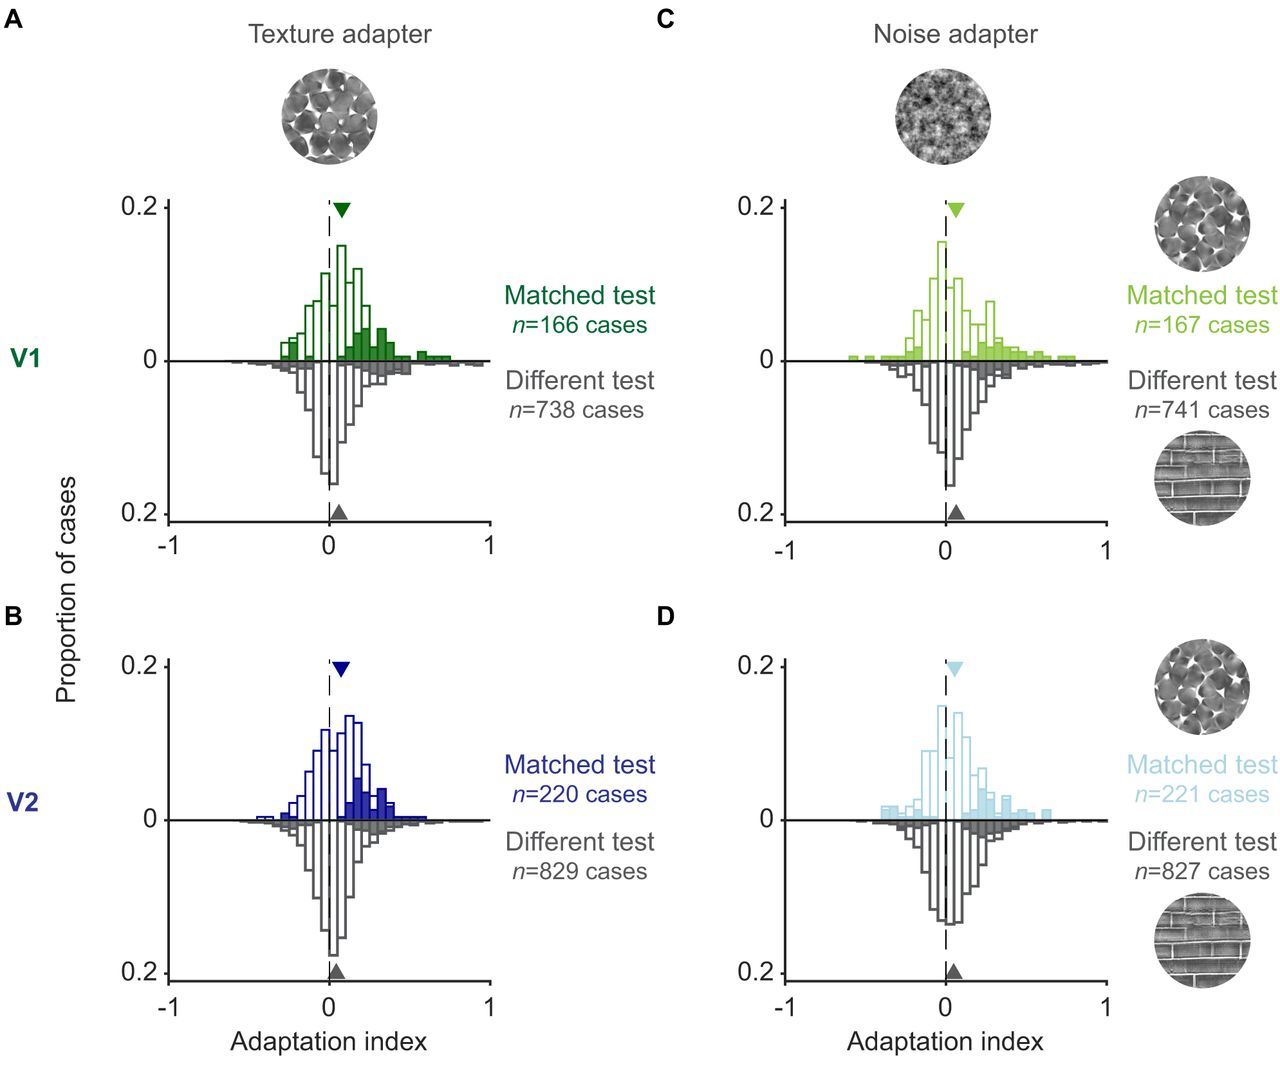
Figure 7.
Adaptation effects between texture families. A, B, Distributions of adaptation indices for V1 (A) and V2 (B) units after adapting with a texture and testing with matched (colored traces, upright) or unmatched (gray, flipped) texture families. C, D, Distributions of adaptation indices for V1 (C) and V2 units (D) after adapting with noise and testing with matched (colored traces, upright) or unmatched (gray, flipped) texture families. All adaptation indices are for texture test stimuli.


