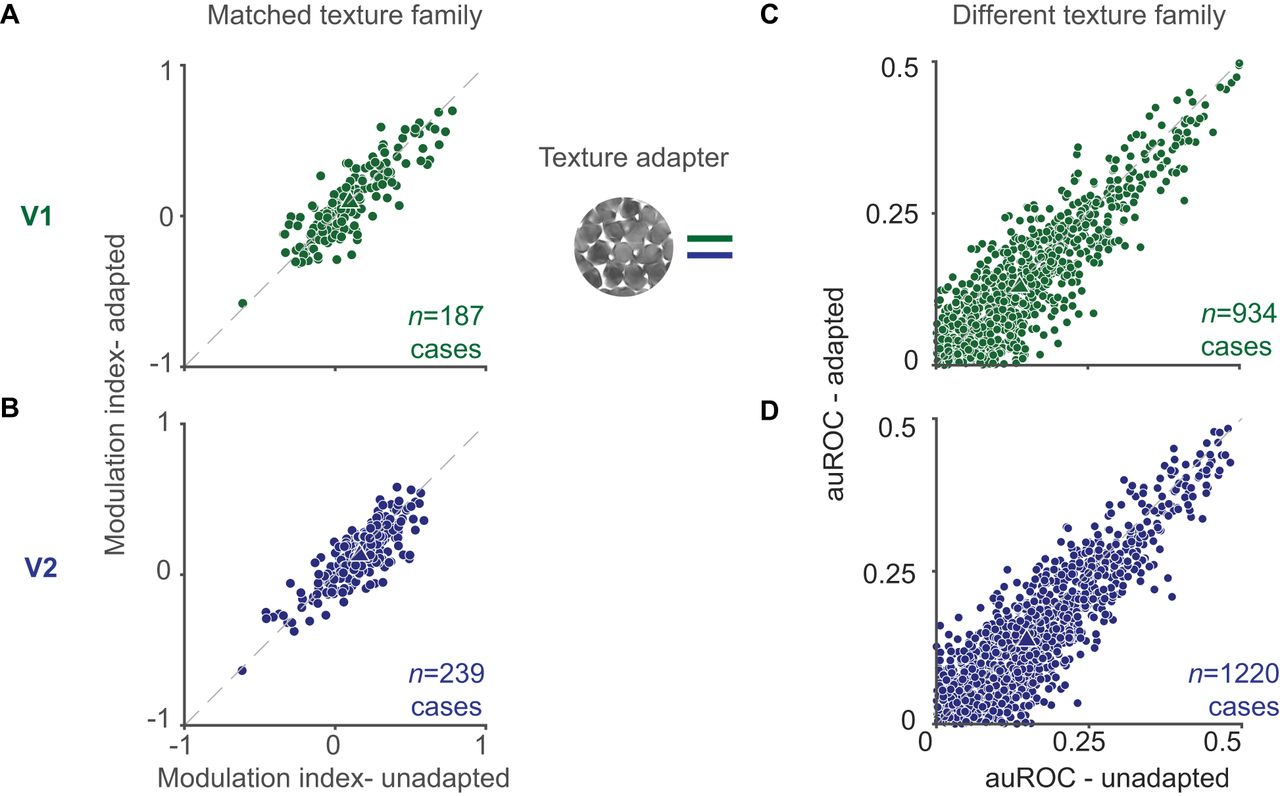
Figure 8.
A, B, V1 (A) and V2 (B) modulation indices for test textures matched to the adapter, before (abscissa) and after adaptation (ordinate) with a texture adapter. Note that the modulation indices for the textures matched to the adapters were skewed more positive than the full set of textures in our stimulus ensemble considered in Figure 5, which we ascribe to variations in the modulation index for different textures, as reported by Freeman et al., 2013. C, D, V1 (C) and V2 (D) auROC values. Values are plotted before (abscissa) and after adaptation (ordinate) with a texture adapter. Triangles indicate mean values.


