Adaptation with Naturalistic Textures in Macaque V1 and V2

(Downloading may take up to 30 seconds. If the slide opens in your browser, select File -> Save As to save it.)

Click on image to view larger version.

Figure 9.
Figure 9.

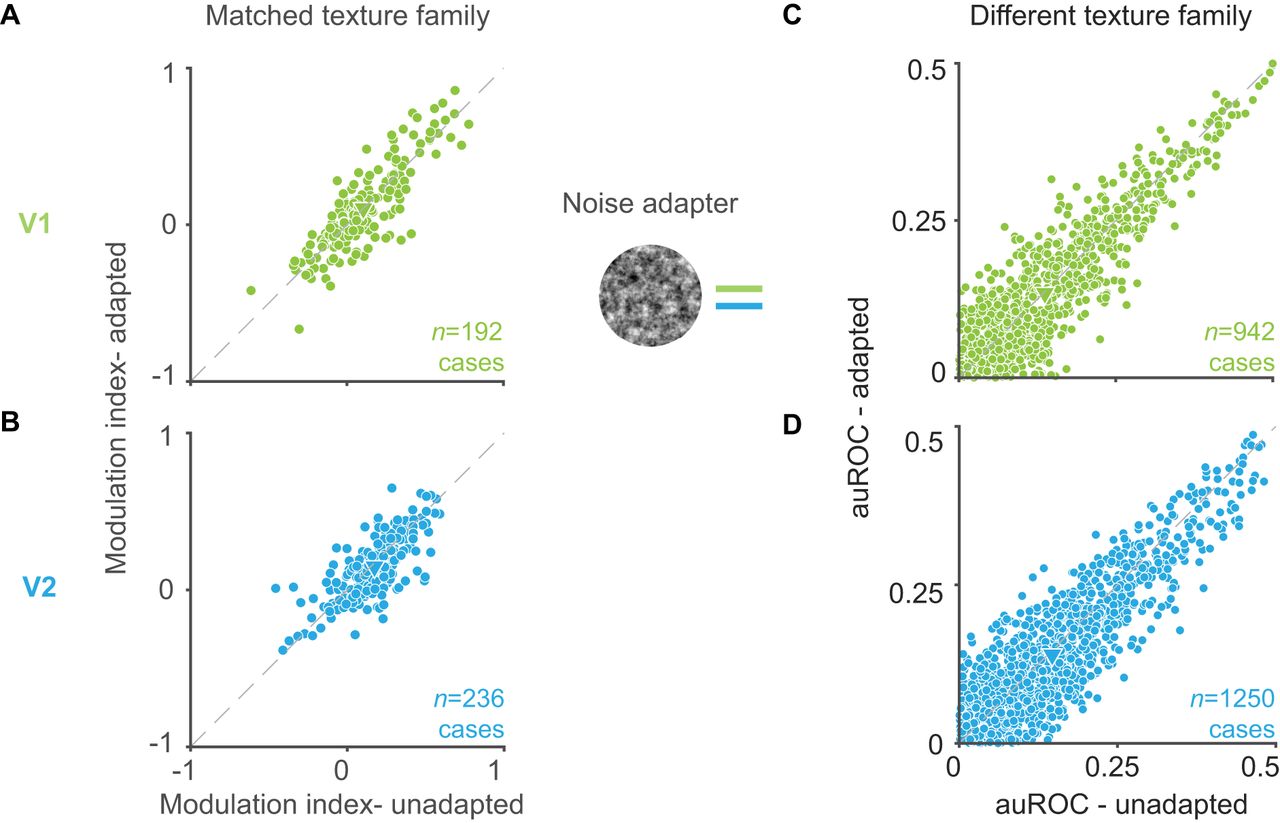
A, B, V1 (A) and V2 (B) modulation indices for test textures matched to the adapter, before (abscissa) and after (ordinate) adaptation with a noise adapter. C, D, V1 (C) and V2 (D) auROC values. Values are plotted before (abscissa) and after adaptation (ordinate) with a noise adapter. Triangles indicate mean values.

  1. The Journal of Neuroscience vol. 45 no. 14
Responses to This Article
Be the first to respond to this article
Advertisement
