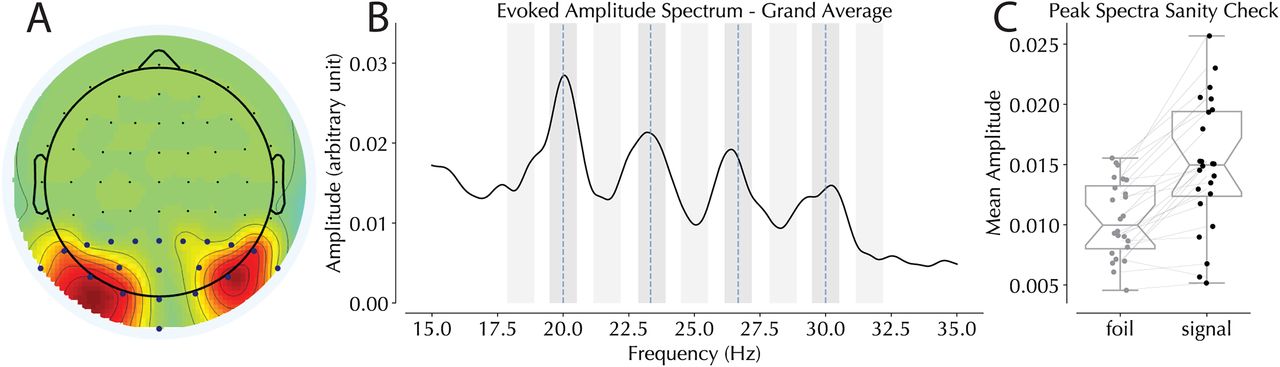
Figure 3.
Steady-state evoked potential data. A, Topography of electrode selection across all 24 subjects. Blue dots represent the 20 posterior electrodes from which electrodes of interest were selected. B, Amplitude spectra recorded from the posterior electrodes with frequencies of interest represented by blue vertical dotted lines. Shaded gray areas represent bins selected in the peak spectra sanity check (darker, signal; lighter, foil). C, Comparison of expected real tagged signal to intermediary foils. Note that this analysis only includes the two horizontal frequencies of interest selected per participant.


