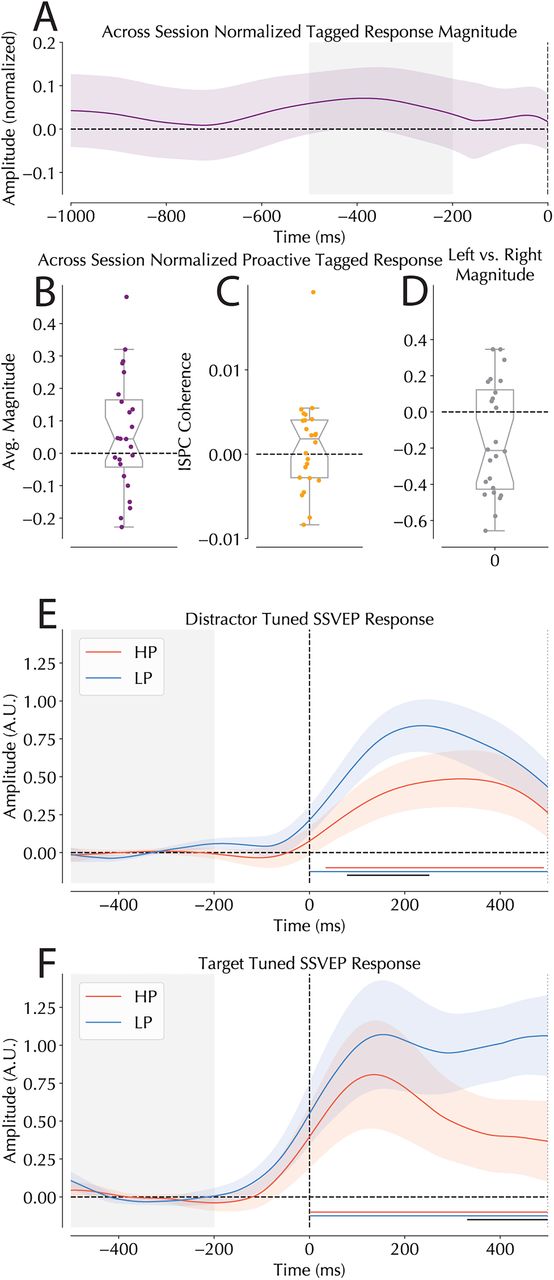
Proactive and reactive SSVEP responses. A, Normalized SSVEP magnitude values in the presearch period. Shaded area represents the −500 to −200 ms window used in the binned analysis in panel B. B, Binned proactive amplitude modulations. Mean signal amplitude in the baseline period (−500 to −200 ms) normalized across sessions comparing HP and LP locations showed no reliable modulation in proactive tagging amplitudes. Individual dots represent single participant means, and boxplot middle indicates group median with notches indicating 95% confidence window. Box edges indicate interquartile range. C, Across-session normalized coherence scores comparing HP and LP locations presearch. Average signal coherence in the 500 ms prior to search onset are compared between HP and LP locations. Similar to the magnitude-based analysis, no reliable modulation in the proactive tagged coherence was found. D, Comparison of the average SSVEP magnitude in the left versus right hemisphere across sessions. Values were averaged for the entire 2,000 ms window of interest centered on search presentation. Values were calculated as left minus right, meaning that a negative value represents a stronger tagged response from the right hemisphere (note that values correspond to a percentage out of 1). E, SSVEP amplitude modulations following search onset separated for HP and LP distractor trials. Gray shaded areas represent the baseline period. Colored bars represent the outcome of cluster-based permutation tests revealing significant deviations from zero for the HP (red) and LP (blue) tagged responses, indicating reliable increases in tagging amplitude following distractor presentation. Black lines represent reliable differences between HP and LP amplitudes. Shaded areas represent the within-subject 95% confidence intervals calculated using the Cousineau method (Cousineau, 2005; Morey, 2008). F, SSVEP amplitude modulations following search onset for trials in which the target was presented at the HP location. Color codes match those used in the distractor figure with the shaded areas again being within-subject 95% confidence intervals.


