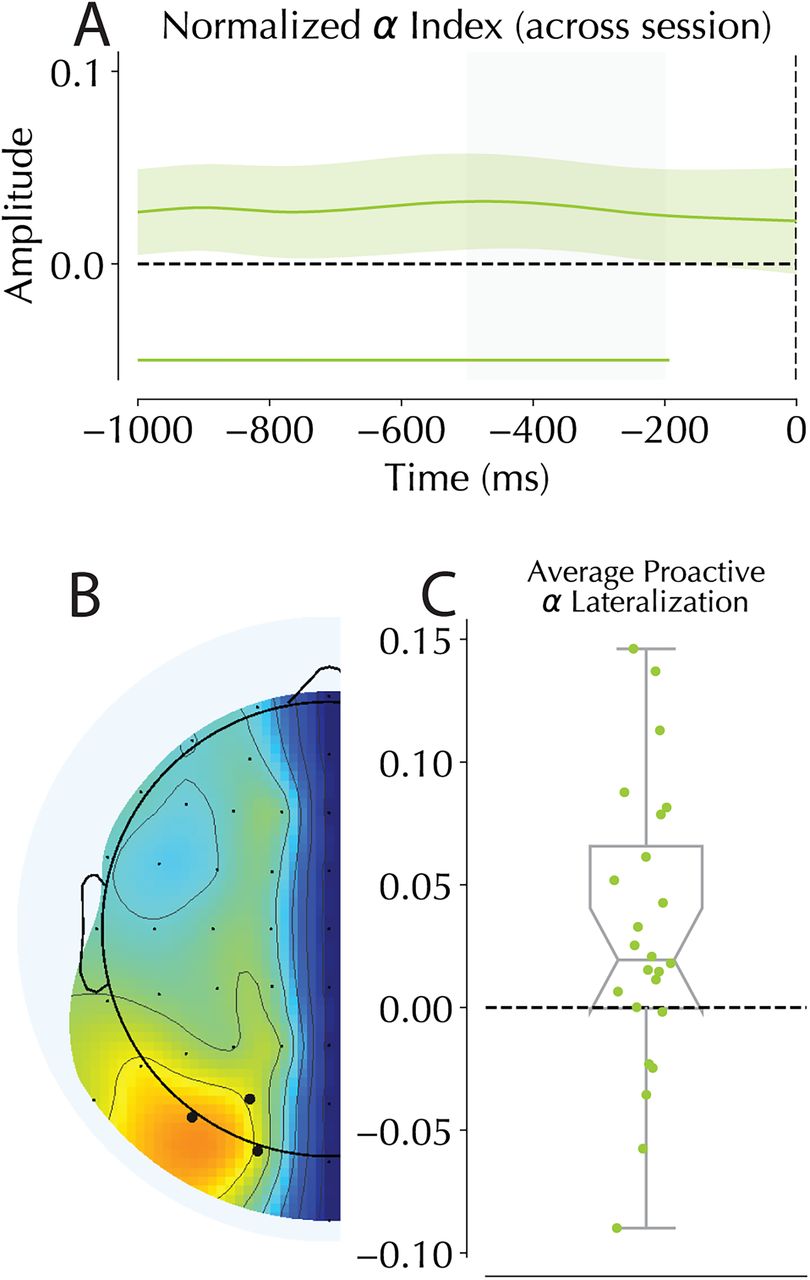
Alpha lateralization in the presearch period. A, normalized time course of alpha for the 1,000 ms prior to search onset. Shading represents 95% confidence interval of the mean. Solid green bars at the bottom of the figure represent significant clusters detected by cluster-based analysis testing for differences from zero. Gray shaded area covers the −500 to −200 ms window used in panel C. B, Topography of alpha following averaging over our frequency bins. Black dots represent selected electrodes of interest. C, Averaged alpha lateralization in the prestimulus period −500 to −300 ms prior to search onset. Scores represent HP minus LP, and thus a positive score represents more alpha in the hemisphere contralateral to the expected distractor location. Because this is a normalized score, values represent percentage differences between conditions (out of 1).


