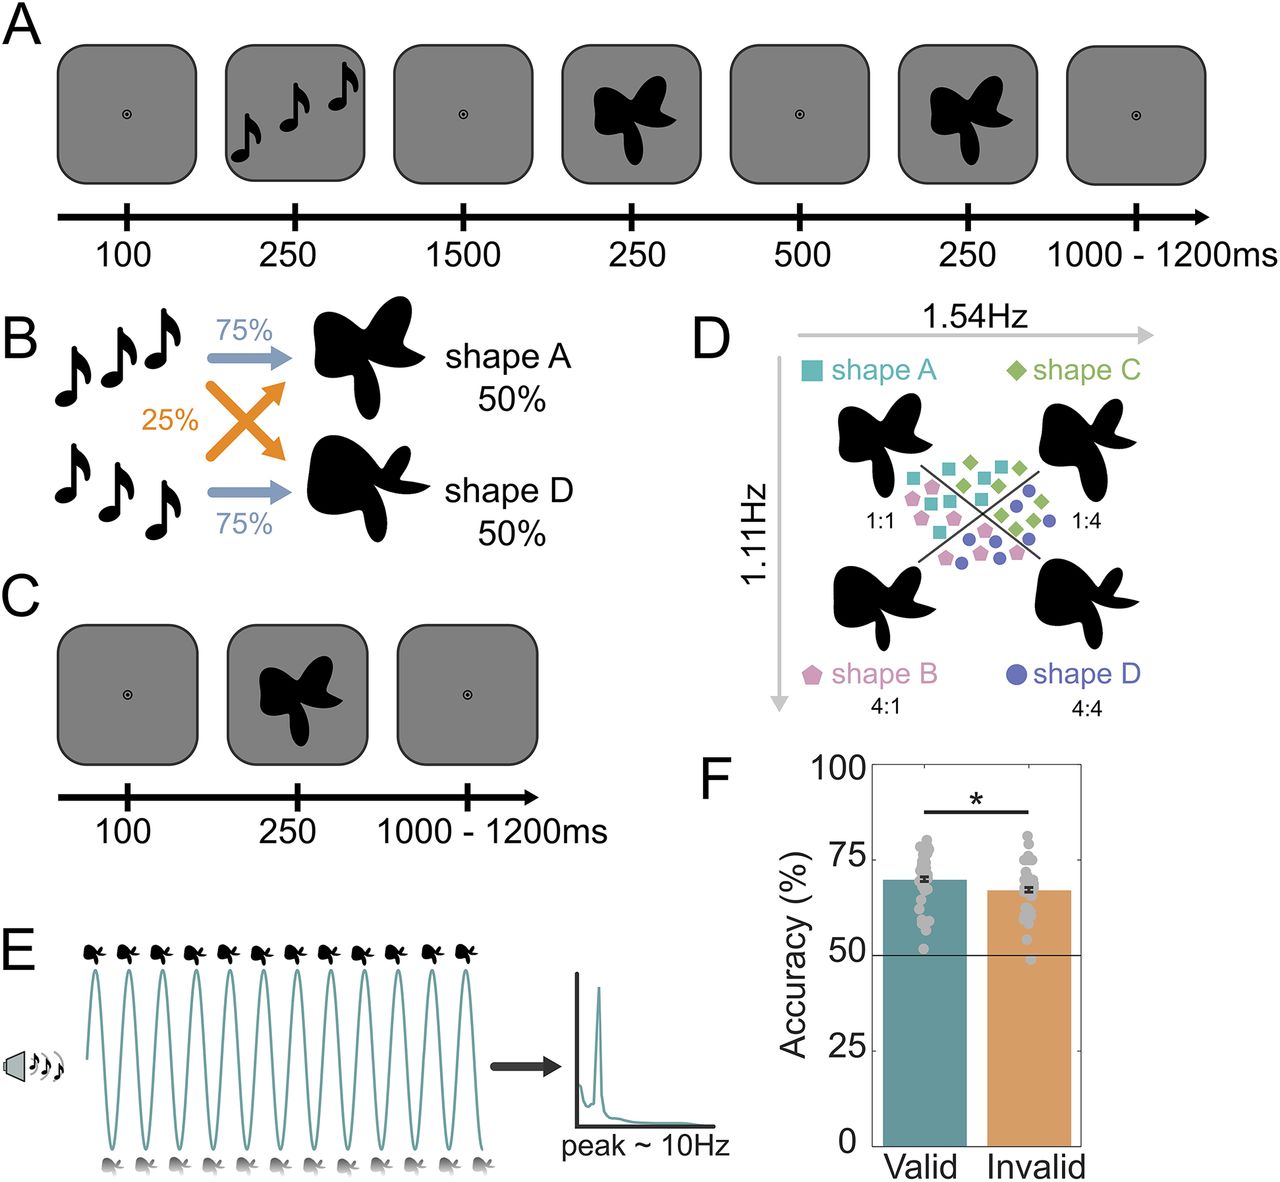
Experimental paradigm. A, During prediction runs, an auditory cue preceded the presentation of two consecutive shape stimuli. On each trial, the second shape was either identical to the first or slightly warped with respect to the first, and participants' task was to report whether the two shapes were the same or different. B, The auditory cue (rising vs falling tones) predicted whether the first shape on that trial would be shape A or shape D. The cue was valid on 75% of trials, whereas in the other 25% of (invalid) trials the unpredicted shape was presented. C, During shape localizer runs, no predictive auditory cues were presented and participants performed a fixation diming task. D, Four different shapes were presented in the localizer runs, appearing with equal (25%) likelihood. Only shape A and D were presented in the prediction runs. The amplitudes of two RFCs (1.11 and 1.54 Hz components) were varied in order to create a two-dimensional shape space multiplication indicated shape A (1:1); shape B (4:1); shape C (1:4); shape D (4:4), such that shape A versus D discrimination was orthogonal to shape B versus C discrimination. E, Schematic of the hypothesis: cue-induced predictions oscillate in the alpha frequency band (∼10 Hz) in the interval between predictive cue and stimulus onset. F, Participants were able to discriminate the two presented shapes more accurately when the auditory cue validly predicted the identity of the first shape (*p < 0.05). Dots represent individual participants; error bars indicate within-participant SEM (Cousineau, 2005; Morey, 2008).


