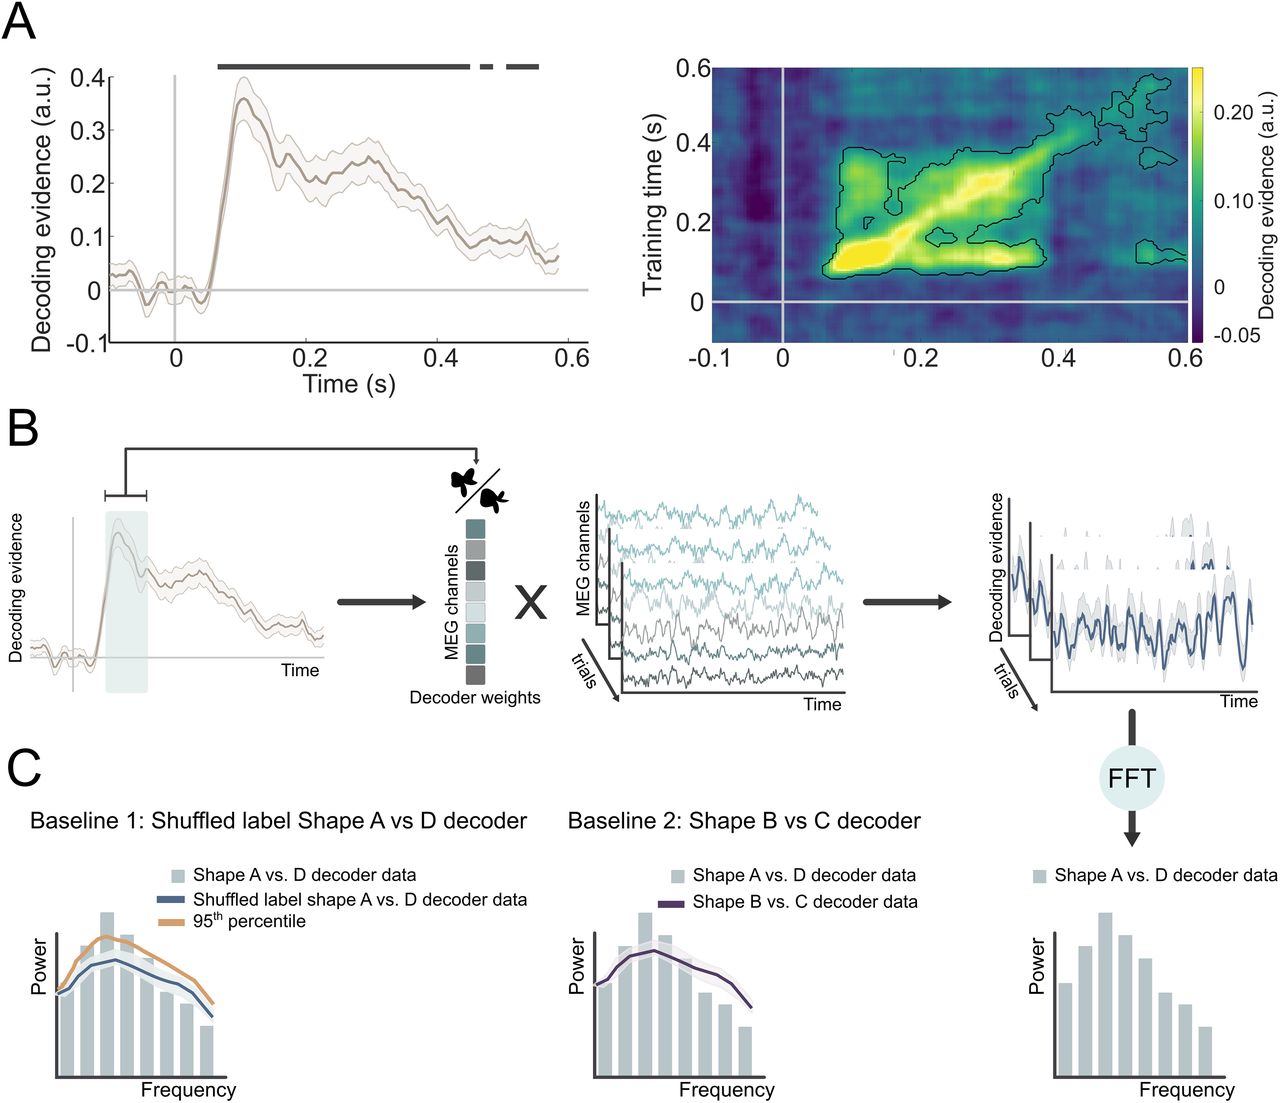
Shape prediction frequency analysis pipeline. A, Neural representations of the presented shapes within the localizer runs in a cross-validated manner (−100 to 600 ms, relative to stimulus onset). The decoder was highly accurate at discriminating the shapes based on the MEG signal. The presented shapes were successfully decoded from 65 to 450 ms (p < 0.001). For all subsequent analyses, decoding traces were averaged over a training window of 70–200 ms, during which shape decoding peaked. B, A decoder was trained to discriminate between shapes A and D in the localizer runs. This decoder was applied to the pre-stimulus time window in prediction runs (−1,250 to 0 ms). Trial-based pre-stimulus decoding time series were subjected to FFT. C, The resulting power spectrum was compared with the 95th percentile of an empirical null distribution generated by bootstrapping decoders trained with pseudorandomized labels (Baseline 1, left), as well as to a decoder trained on shapes only presented in the localizer (shapes B and C; Baseline 2, right).


