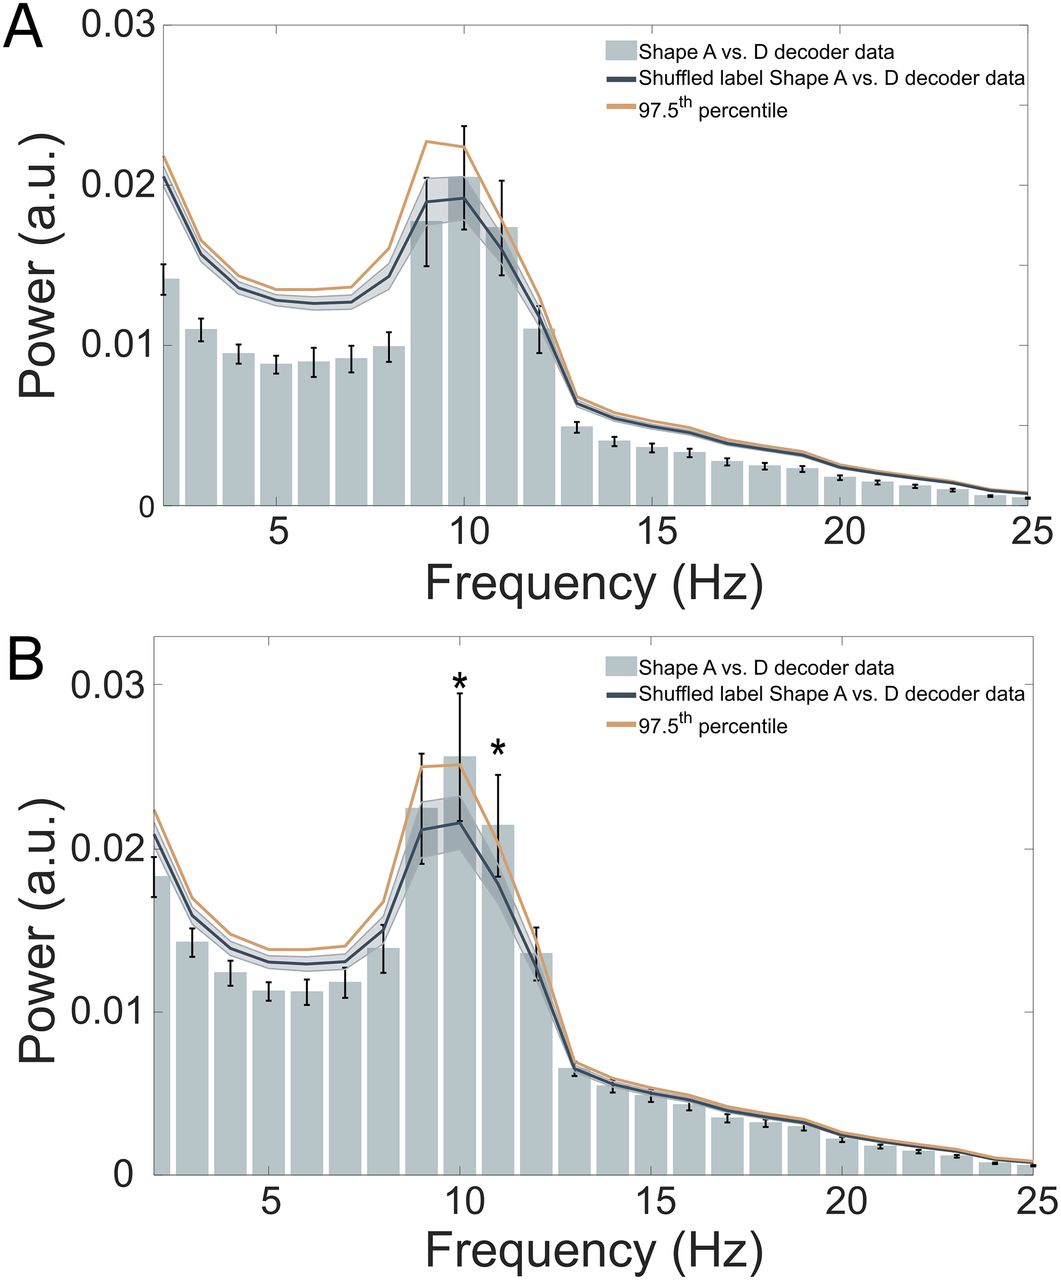
Late sensory representations drive stimulus predictions. A, Power spectrum of the −1,250 to 0 ms prediction time window shape A versus D decoding, trained on the 90–120 ms post-stimulus localizer window. No significant distinctions between the shape A versus D decoder data and an empirical null distribution at 10 and 11 Hz. Mean and shaded regions indicate SD. Dark solid orange line indicates the 97.5th percentile of the null distribution, implementing a one-sided test at p < 0.05 while correcting for the two time windows tested here. B, Power spectrum of the −1,250 to 0 ms prediction time window shape A versus D decoding, trained on the 160–190 ms post-stimulus localizer window. Statistically significant difference from an empirical null distribution at 10 and 11 Hz (*p < 0.002). The baseline power spectrum (dark blue line) was calculated as before. Mean and shaded regions indicate SD. Solid orange line indicates the 97.5th percentile of the baseline distribution.


