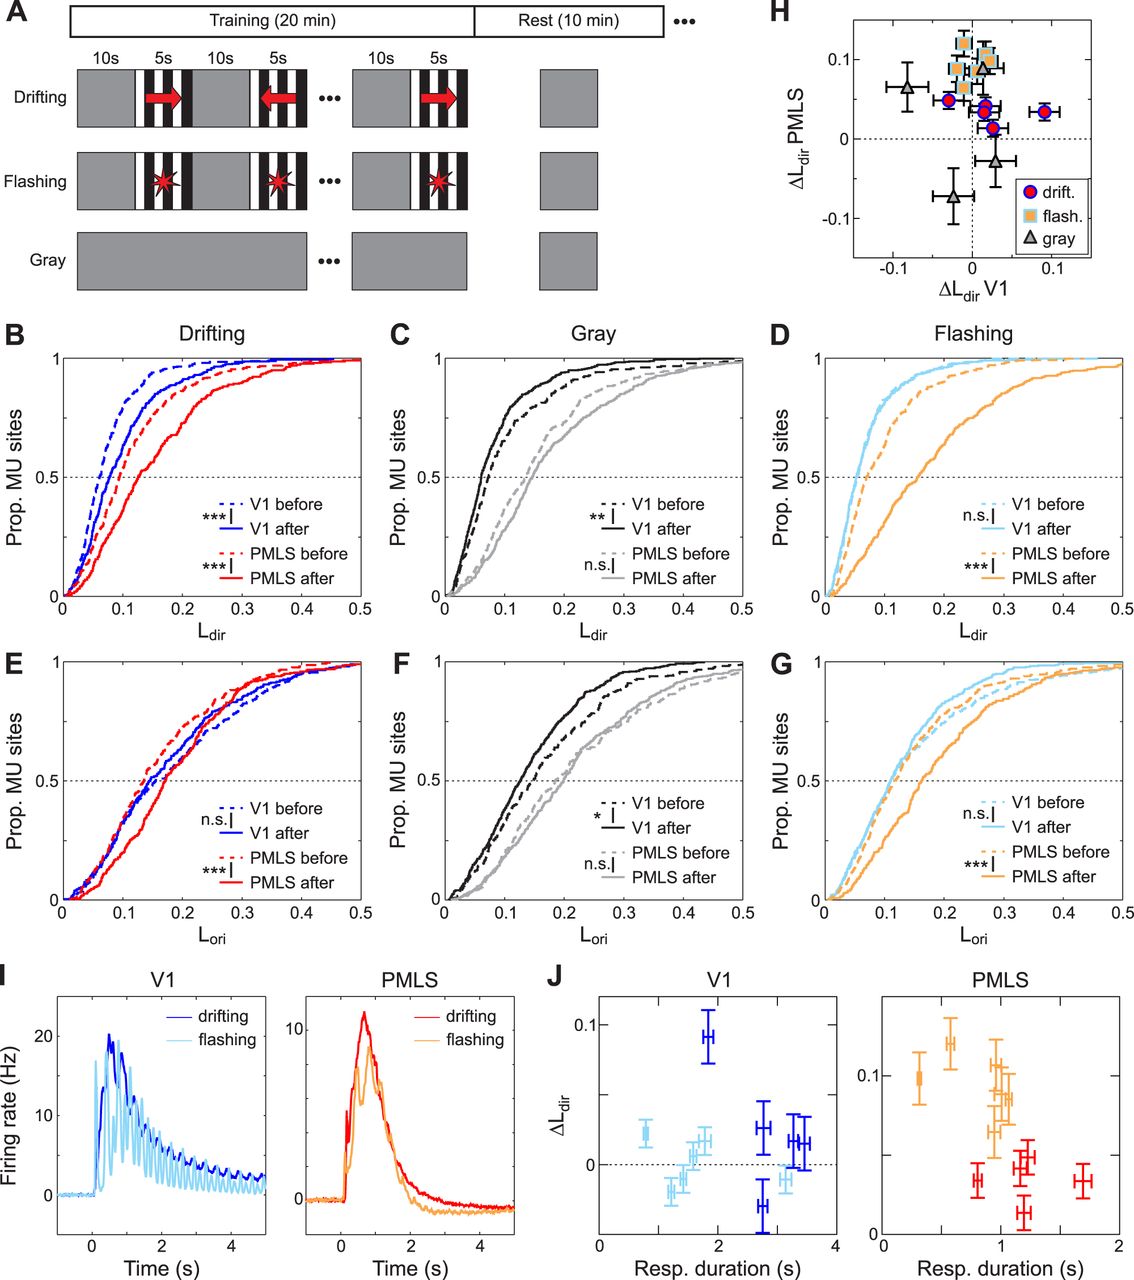
Changes in DS levels in response to different training stimuli. A, Temporal structure of the training experiments. For two of the three cohorts, 20-min-long stimulation blocks were alternated with 10-min-long rest periods for a total duration of 8 h. The stimulation blocks contained alternating sequences of stimulus presentations (5 s) and the gray screen (10 s), and the gray screen was shown during the rest period. In the cohort exposed to drifting gratings, gratings could move in one of two (opposing) directions during the stimulation period. In the cohort exposed to flashing gratings, grating contrast was temporally modulated during each presentation. The third cohort, finally, was only exposed to the gray screen for 8 h. B–D, Cumulative Ldir distributions for V1 and PMLS for MU sites recorded before and after 8 h of exposure to drifting gratings (B), the gray screen (C), or flashing gratings (D). The legends indicate the results of rank-sum tests between pre- and post-training data (**p < 0.005; ***p < 0.001; n.s., not significant). E–G, Cumulative Lori distributions for V1 and PMLS for MU sites, based on the same recordings shown in B–D, using the same format as B–D. H, Correlation in the training effect size for Ldir between V1 and PMLS. Each symbol corresponds to data from a single animal for which both V1 and PMLS data was available. The effect size is computed for each animal based on the results of the LME models. Colors and symbol shape indicate the stimulus used during the training protocol. Error bars indicate SE for each per-animal random slope, as estimated by lmefit. I, Average MU activity evoked by drifting and flashing gratings during the stimulation blocks for V1 and PMLS. Firing rates for each MU site were binned into 10 ms bins and normalized by the average firing rate in the 2 s preceding stimulus onset. Data were then averaged across all stimulus presentations in all 16 blocks, as well as all MU sites and animals. J, The training effect size as a function of the response duration evoked during the stimulation blocks. The effect size was quantified per animal as in H. Response duration is computed as the average response duration of all MU sites across all training blocks in an animal. Error bars for the training effect size indicate SE for each per-animal random slope, as estimated by lmefit. Error bars for the response duration indicate SEM. Color coding is as in H.


