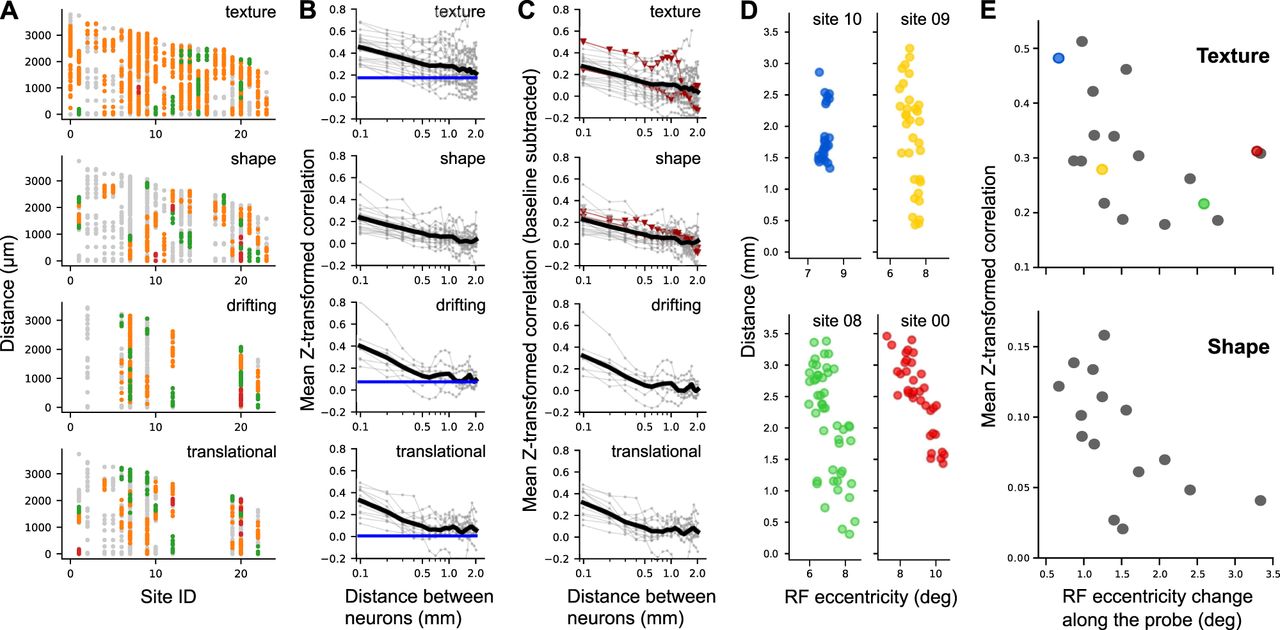
Population data: Neuronal clusters in area V2. A, Results from clustering analysis (see Materials and Methods) across 24 recording sites (x-axis) for the four stimulus classes. In each recording site, individual neurons are represented by dots positioned at the depths of the corresponding contact along the probe. A depth of 0 corresponds to the location of the deepest neuron recorded in each session. Distinct clusters of neurons with similar tuning are color-coded, while neurons not assigned to any cluster appear in gray. Orange indicates the largest cluster within each site, followed by green for the second largest, and red for the smallest. Note that colors are meaningful only within a recording site; the same colors across different sites do not indicate shared feature selectivity. Sites 22 and 09 correspond to the example data shown in Figure 2C,G. B, Dependence of tuning similarity on interneuronal distance. In each panel, thin gray lines correspond to individual recording sites, with each data point representing the mean value of tuning similarity between pairs of neurons from 200 μm bins positioned every 100 μm. The black line indicates the average value across recording sites. Blue lines indicate the baseline correlation derived from shuffled neuronal pairs across different penetrations using identical stimuli. Such a baseline correction is not applicable to the shape condition, because stimulus sets were randomly selected across sessions. C, Baseline-subtracted version of the data shown in B. Red lines highlight two specific penetrations (sites 09 and 10) where RF shifts along the probe were minimal (see top panels in D). D, Shift in RF position along the length of the probe. For four representative penetrations, RF eccentricity (x-axis) is plotted against the distance along the probe (y-axis). E, We quantified the relationship between functional similarity and spatial displacements of RF by measuring the mean Z-transformed correlation across all neuronal pairs recorded within a penetration against the change in RF eccentricity (from 0.1 to 0.9 percentile) across neurons recorded along the length of the probe. We found that penetrations with larger RF shifts tended to exhibit lower functional similarity. Colors correspond to penetrations identified in D.


