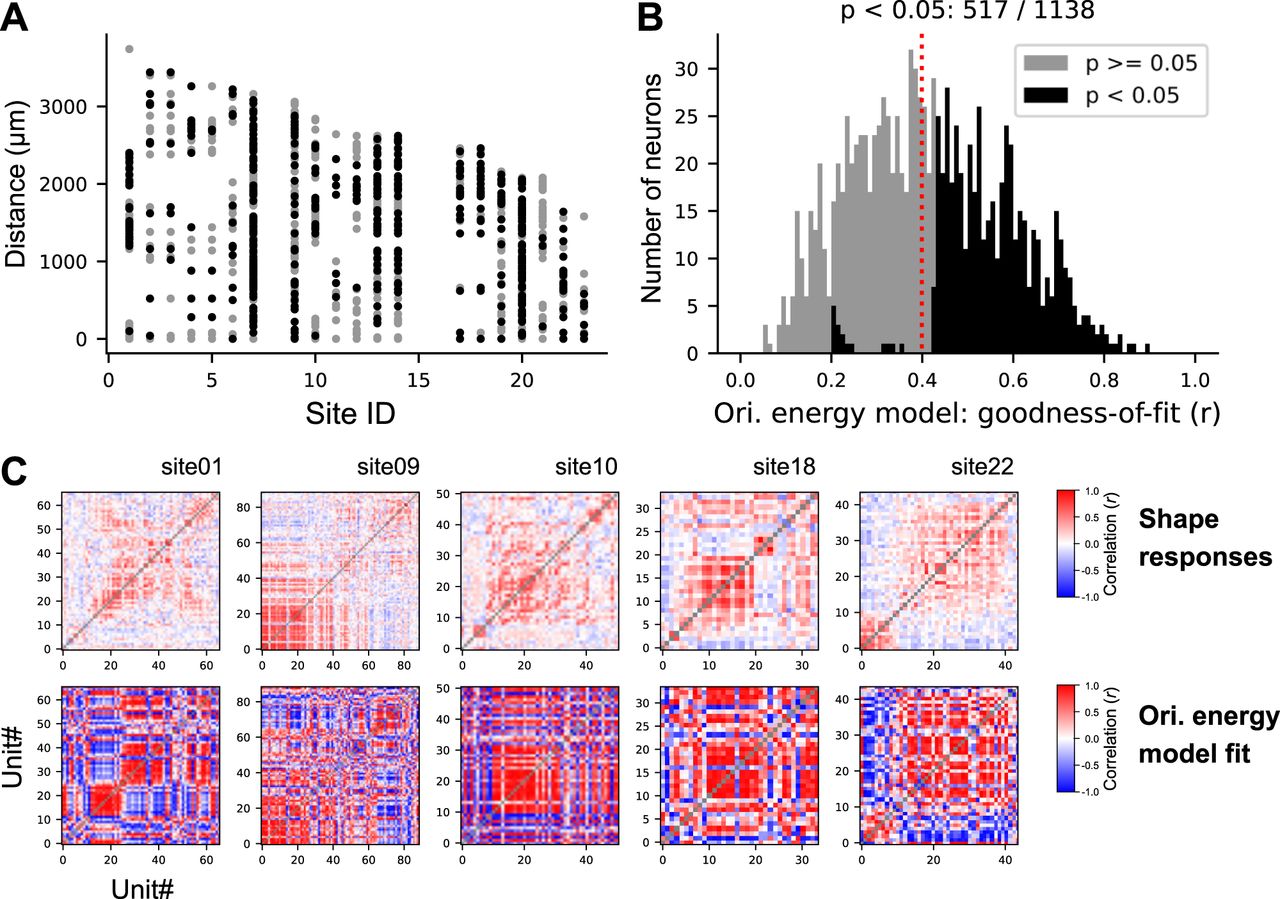
Orientation energy model fit to shape responses. A, B, For each neuron, shape responses were predicted using an orientation energy model based on linear regression. Black dots in A and black bars in B represent neurons with statistically significant goodness-of-fit (r) as determined by an F test (p < 0.05), while gray dots and bars represent neurons that did not reach statistical significance. In most sessions, we used a shape set of 50 stimuli, but in a few sessions (3 out of 20), a larger set (n = 120) was used, which led to statistical significance even with smaller correlation values (r < 0.4). The vertical line represents the median (0.40). C, A comparison of the tuning similarity matrices derived from measured (top) versus predicted (bottom) responses from the orientation energy model. Matrices exhibit qualitatively similar structure.


