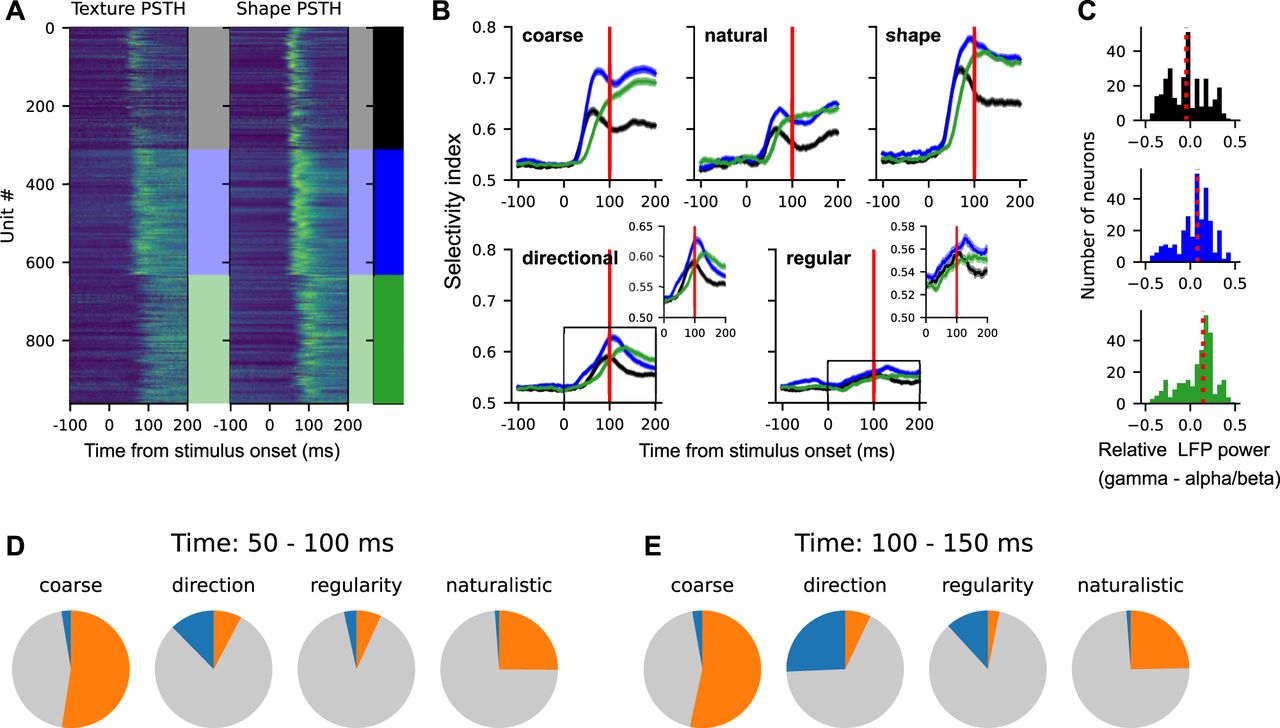
Temporal dynamics of texture selectivity and its relationship with cortical depths. A, All recorded V2 neurons with clear visual responses were grouped into three clusters using K-means algorithm, based on the similarity of their temporal dynamics from −100 to 200 ms relative to stimulus onset. The PSTHs in the black cluster are characterized by a fast transient peak, whereas those in the blue and green clusters exhibit stronger sustained activity, persisting 100 ms after stimulus onset. B, For each PSTH cluster, selectivity indices (i.e., area under the ROC curve; see Materials and Methods) for four texture dimensions and shape are plotted as a function of time. Selectivity for coarse, naturalistic texture features and shape emerged earlier than that for directional and regular texture features. Notably, neurons with sustained responses (blue and green clusters) exhibited stronger overall selectivity. C, For each PSTH cluster, cortical layers of individual neurons were estimated by the difference of relative LFP power between gamma (50–150 Hz) and alpha–beta (10–30 Hz) frequency ranges. Positive and negative values indicate neurons located in the superficial and deep layers, respectively, with values near 0 corresponding to layer 4. D, E, The relative proportions of neurons with statistically significant modulation for each texture attribute. Two distinct time windows were analyzed to contrast early (D, 50–100 ms poststimulus onset) and later (E, 100–150 ms poststimulus onset) neuronal activity. Neurons with significant modulation are represented by orange and blue colors, with color schemes consistent with those in Figure 7.


