Purkinje Cell Collaterals Preferentially Target a Subtype of Molecular Layer Interneuron
- Elizabeth P. Lackey1,*,
- Aliya Norton1,*,
- Luis Moreira1,
- Cole S. Gaynor1,
- Wei-Chung Allen Lee1,2, and
- Wade G. Regehr1
- 1Department of Neurobiology, Harvard Medical School, Boston, Massachusetts 02115
- 2Kirby Neurobiology Center, Boston Children’s Hospital, Boston, Massachusetts 02115
-
Author contributions: W-C.A.L. and W.G.R. designed research; E.P.L., A.N., L.M., and C.S.G. performed research; E.P.L., A.N., and L.M. analyzed data; W.G.R. wrote the paper with input from all co-authors..
Abstract
In addition to providing outputs from the cerebellar cortex, Purkinje cell (PC) axon collaterals target other PCs, molecular layer interneurons (MLIs), and Purkinje layer interneurons (PLIs). It was assumed that PC collaterals to MLI synapses provide positive feedback to PCs via the PC–MLI–PC pathway, because it was thought that MLIs primarily inhibit PCs. However, it was recently shown that MLIs consist of two subtypes: MLI1s primarily inhibit PCs, whereas MLI2s mainly inhibit MLI1s and disinhibit PCs. Clarifying PC connectivity onto these MLI subtypes is vital to understanding the influence of feedback from PC collaterals. Here we use a combination of serial electron microscopy (EM) and optogenetic studies to characterize PC synapses onto MLI subtypes in mice of either sex. EM reconstructions show that PCs make 53% of their synapses onto other PCs, 32% onto PLIs, 6% onto MLI1s, and 7% onto MLI2s. Since there are far more MLI1s than MLI2s, each MLI2 is expected to receive many more synapses than each MLI1. In slice experiments, optogenetic activation of PCs evokes inhibitory currents in most MLI2s but primarily disinhibits MLI1s. We also find that candelabrum cells, a type of PLI, form many more synapses onto MLI1s than MLI2s. These findings suggest that PC–MLI synapses do not primarily disinhibit PCs and that the PC–MLI2–MLI1–PC and PC–PLI–MLI1–PC pathways might provide negative feedback to PCs that acts in concert with PC–PC synapses to counter elevations in PC firing.
Significance Statement
Purkinje cells (PCs) influence processing by inhibiting neurons in the cerebellar cortex, including other PCs, molecular layer interneurons (MLIs), and Purkinje layer interneurons (PLIs). The influence of PC–MLI synapses was not known because there are recently identified MLI subtypes with opposing effects: MLI1s inhibit PCs, whereas MLI2s inhibit MLI1s and disinhibit PCs. We used serial electron microscopy and optogenetic studies to characterize PC synapses onto MLI subtypes and found that PCs preferentially inhibit MLI2s and disinhibit MLI1s. We also found that candelabrum cells (a type of PLI) preferentially inhibit MLI1s. These findings suggest that PC–PC synapses, the PC–MLI2–MLI1–PC pathway, and the PC–candelabrum cell–MLI1–PC pathway act together to allow alterations in PC firing to provide negative feedback to other PCs.
Introduction
Purkinje cells (PCs) process tens of thousands of granule cell inputs and in turn provide the sole outputs from the cerebellar cortex. PC axons also have collaterals that are confined to a parasagittal plane and synapse onto most types of neurons in the cerebellar cortex. PCs inhibit other PCs (Orduz and Llano, 2007; Witter et al., 2016). PC collaterals also strongly inhibit three types of Purkinje layer interneurons (PLIs): Lugaro cells, globular cells, and candelabrum cells (CCs; Hirono et al., 2012; Witter et al., 2016; Miyazaki et al., 2021; Osorno et al., 2022). PC collaterals also extend into the molecular layer and inhibit approximately 25% of molecular layer interneurons (MLIs; Witter et al., 2016). MLIs control PC firing, regulate calcium signaling in PC dendrites, and gate some forms of plasticity at granule cell to PC synapses (Dizon and Khodakhah, 2011; Gaffield et al., 2018; Rowan et al., 2018; Kim and Augustine, 2021). PCs also directly inhibit some granule cells and unipolar brush cells in the input layer of the cerebellar cortex (Guo et al., 2016, 2021).
PC collaterals allow the outputs of the cerebellar cortex to feed back and regulate processing within the molecular layer (Witter et al., 2016; Halverson et al., 2022; Hull and Regehr, 2022) in contrast to granule cell inputs to MLIs that mediate feedforward inhibition to increase the precision of PC firing and contribute to cerebellar processing (Mittmann et al., 2005; Steuber et al., 2007; Blot et al., 2016; Zang and De Schutter, 2021). Although much is known about PC collateral feedback, and it had long been thought that PCs inhibit MLIs (O’Donoghue et al., 1989; Bishop, 1993; Witter et al., 2016; Halverson et al., 2022), the recent discovery of two molecularly distinct types of MLIs, MLI1 and MLI2, with specialized connectivity (Kozareva et al., 2021; Lackey et al., 2024) raises questions regarding the influence of PC collaterals. Traditionally, MLIs have been subdivided into basket cells (BCs) and stellate cells (SCs; Eccles et al., 1967; Kim and Augustine, 2021; Hull and Regehr, 2022). BCs are closer to the PC layer, and their axons form synapses that contribute to basket-like structures on PC somata and specializations known as pinceaux near PC axon initial segments. MLI1s and MLI2s did not simply correspond to BC and SC categories. MLI1s comprise a continuous molecular and morphological gradient: they look like BCs near the PC layer and like SCs near the top of the molecular layer and have intermediate properties at intermediate locations (Kozareva et al., 2021; Lackey et al., 2024). MLI2s do not form baskets or pinceaux (Kozareva et al., 2021; Lackey et al., 2024). MLI1s and MLI2s have very different effects on PCs. MLI1s fire synchronously, primarily inhibit PCs, and suppress calcium signals in PC dendrites (Rowan et al., 2018; Kozareva et al., 2021; Zhang et al., 2023; Lackey et al., 2024; Santos-Valencia et al., 2025). MLI2s are not electrically coupled; they primarily inhibit MLI1s and disinhibit PCs, and they are expected to enhance calcium signals in PC dendrites (Kozareva et al., 2021; Zhang et al., 2023; Lackey et al., 2024; Santos-Valencia et al., 2025). Previous studies of PC to MLI feedback were performed prior to the realization that there are two types of MLIs, and it was assumed that PC inhibition of MLIs in turn disinhibits PCs, thereby providing positive feedback (Witter et al., 2016; Halverson et al., 2022). In contrast, PC–MLI2 synapses are expected to promote MLI1 firing and provide negative feedback by disinhibiting MLI1s and increasing inhibition of PCs. It is not known if PCs preferentially target one subtype of MLI. Similarly, the effects of PC–PLI feedback are unclear because it is not known if PLIs primarily inhibit MLI1s or MLI2s.
Here we assess the targets of PC collaterals using electron microscopy (EM) reconstructions and recordings of optogenetically evoked PC IPSCs onto identified MLI subtypes. EM reconstructions show that PCs make putative synapses onto PCs, PLIs, and both MLI subtypes, and PCs are expected to more strongly inhibit each MLI2 (Kozareva et al., 2021; Lackey et al., 2024). Optogenetic activation of PCs evoked IPSCs in two-thirds of MLI2s, but primarily disinhibited MLI1s. This disinhibition likely arises from a combination of PCs suppressing MLI2 and PLI firing that both in turn inhibit MLI1s. These findings suggest that PC collateral activation of MLI2s, PLIs, and other PCs all provide negative feedback to PCs.
Materials and Methods
Slice experiments
Animal procedures were performed in accordance with the NIH and Animal Care and Use Committee (IACUC) guidelines and protocols approved by the Harvard Medical School Standing Committee on Animals. Pcp2-Cre Jdhu (B6.Cg-Tg(Pcp2-Cre)3555Jdhu/J) and ChR2-EYFP (B6;129S-Gt(ROSA)26Sortm32(CAG-COP4*H134R/EYFP)Hze) mice were obtained from The Jackson Laboratory. The Pcp2-Cre Jdhu line is selective for PCs (Witter et al., 2016). Animals of either sex were randomly selected for experiments. Animals were housed on a normal light–dark cycle with an ambient temperature of 18–23°C with 40–60% humidity.
Acute parasagittal slices (220-μm-thick) were prepared from P28 to P45 Pcp2-Cre Jdhu × ChR2-EYFP mice. Mice were anesthetized with an intraperitoneal injection of 100 mg/kg ketamine + 10 mg/kg xylazine and perfused transcardially with an ice-cold solution containing the following (in mM): 110 choline chloride, 7 MgCl2, 2.5 KCl, 1.25 NaH2PO4, 0.5 CaCl2, 25 glucose, 11.6 sodium ascorbate, 3.1 sodium pyruvate, and 25 NaHCO3, equilibrated with 95% O2 and 5% CO2. Slices were cut in the same solution and then transferred to ACSF containing the following (in mM): 125 NaCl, 26 NaHCO3, 1.25 NaH2PO4, 2.5 KCl, 1 MgCl2, 1.5 CaCl2, and 25 glucose, equilibrated with 95% O2 and 5% CO2. Following incubation at 34°C for 30 min, the slices were kept for up to 6 h at room temperature until recording.
Recordings were performed at 32°C with an internal solution containing the following (in mM): 150 K-gluconate, 3 KCl, 10 HEPES, 3 MgATP, 0.5 GTP, 0.5 EGTA, 5 phosphocreatine-tris2, and 5 phosphocreatine-Na2 (pH adjusted to 7.2 with KOH, osmolarity adjusted to 310 mOsm kg−1). Visually guided whole-cell patch-clamp recordings were obtained with patch pipettes of ∼3–6 MΩ resistance pulled from borosilicate capillary glass (BF150-86-10, Sutter Instrument). Electrophysiology data were acquired using a MultiClamp 700A or 700B amplifier (Axon Instruments), digitized at 20 kHz, and filtered at 4 kHz. Acquisition and analysis of slice electrophysiological data were performed using custom routines written in Igor Pro (WaveMetrics) and MATLAB. (R)-CPP (2.5 µM) and NBQX (5 µM) were included in the bath solution to block glutamatergic receptors. All drugs were purchased from Abcam and Tocris Bioscience.
Slices were kept in the dark before recording. Recordings were made from lobules IV–V of the vermis. We recorded MLIs in voltage clamp. We recorded from MLIs in the inner two-thirds of the molecular layer and determined the identity of MLI1s and MLI2s by characterizing their electrical properties as previously described (Kozareva et al., 2021; Lackey et al., 2024). We used spikelets to identify MLI1s, and a lack of spikelets combined with a high input resistance to identify MLI2s. MLI1s and MLI2s are molecularly and functionally distinct interneuron classes intermingled in the molecular layer (Kozareva et al., 2021; Lackey et al., 2024). MLI2s have relatively uniform properties regardless of their location in the molecular layer, whereas MLI1s comprise a continuous molecular gradient that is spatially distributed with distance from the PC layer. MLI1s and MLI2s identified by cell fills and post hoc single-molecule FISH exhibited distinct electrical properties (Kozareva et al., 2021). MLI1s express connexin 36, they are electrically coupled to each other, and spontaneous action potentials in neighboring MLI1s produce spikelets. Spikelets are not observed in MLI2s because they do not express connexin 36 and are not electrically coupled to other cells. MLIs with spikelets were classified as MLI1s. A lack of spikelets is insufficient to identify MLI2s because spikelets in MLI1s require intact spontaneous firing in neighboring MLI1s, which can be disrupted by poor slice health or by slicing damaging MLIs near the surface of the slice. MLI1s have input resistances ranging from ∼200 MΩ near the PC layer up to 1 GΩ near the top of the molecular layer, whereas most MLI2s have resistances of >1 GΩ. We avoided complications arising from overlapping MLI1 and MLI2 resistance distributions in the 500 MΩ to 1 GΩ range by identifying MLI2s based on a lack of spikelets and input resistances of >1 GΩ. We avoided cells in the upper third of the molecular layer where MLIs tend to have higher input resistances (Lackey et al., 2024). This approach yields high-confidence classification of MLI subtypes without needing post hoc in situ hybridization, but it excludes some MLI1s that lack spikelets (possibly because spontaneous firing in coupled cells was disrupted or spikelets were small), a small number of MLI2s with intermediate resistances, and MLIs in the upper third of the molecular layer. All cells that could be classified were analyzed.
IPSCs were recorded at a holding potential of −45 mV and were outward currents because the Cl− reversal potential was −99 mV. To activate presynaptic PC boutons, we delivered brief pulses (1 ms) of blue light (∼60 mW/mm2) to a small spot (diameter ∼100 µm) centered over the soma of the recorded MLI, at 1 Hz for 100 trials. The light stimulus was delivered using a laser (473 nm, Opto Engine) or an LED (470 nm, Thorlabs), coupled through the excitation pathway of a BX50WI upright microscope (Olympus), and focused onto slices through a 40× or 60× water-immersion objective (Olympus).
Postsynaptic currents were low-pass filtered at 1 kHz and time-locked to the onset of stimulation. All synaptic currents are averages of 100 trials. The amplitudes of outward and inward currents were measured as the average of 3–5 ms (t1) and 15–20 ms (t2) following stimulation, respectively. Synaptic currents and z-score amplitudes were measured relative to baseline averaged 100 ms prior to the stimulation, and amplitudes at baseline were measured over t1 and t2 from 50 ms prior to stimulation. Based on the baseline measurements, responses to stimulation were determined to be significant if they had a z-score of >2 for t1 and a z-score of less than −2 for t2.
An outlier interneuron was located in the molecular layer 40 μm from the bottom of the PC layer. The input resistance of the cell was 126 MΩ, and spikelets were apparent. The amplitude of the optically evoked IPSC was 61 pA, whereas all other responses in MLI1s were in the −3.0 to 2.6 pA range (n = 44). Applying the interquartile range method (Tukey, 1977) to the data set, all optically evoked IPSCs are within the interquartile range of −3.4 to 3.0 pA, with the exception of this response which is well outside the interquartile range. The Grubbs test also indicates that it is an outlier (Grubbs statistic 6.53, t statistic 43, p-value 3 × 10−44). We therefore categorized this cell as an outlier and removed it from our data set. The large short-latency response suggests that this could be a displaced PLI (Osorno et al., 2022).
Serial EM reconstructions
We previously imaged and aligned a 770 μm × 750 μm × 53 μm volume of lobule V of the mouse cerebellum for EM reconstructions comprised of 1,176 45-nm-thick parasagittal sections (Osorno et al., 2022; Nguyen et al., 2023; Lackey et al., 2024). We used automated image segmentation to generate neuron boundaries and automated synapse prediction to infer synaptic connectivity as described previously (Nguyen et al., 2023). We used the neuron segmentation to reconstruct PC axon collaterals and analyze their synaptic outputs. PCs are readily identified based on their distinctive large cell bodies and their extensive spiny dendrites. To rapidly reconstruct and correct errors from automated segmentation, we used a proofreading workflow called Dahlia, where annotators checked all neurons for split or merge errors. Synapses made by collaterals were identified using automated synapse detection as previously described (Nguyen et al., 2023). Synapses were proofread manually to validate each postsynaptic target using MD-Seg. Synapses were identified by characteristic ultrastructural features of GABAergic synapses, including a synaptic cleft with a flattening of opposed pre- and postsynaptic membranes and clustering of synaptic vesicles near the presynaptic specialization (Peters et al., 1991). Any automatically detected synapses that did not fit these criteria were excluded from further analysis. By restricting our analysis to six PC collaterals located near the center of the volume, it was possible to identify almost all of their targets.
We classified MLIs as MLI1s or MLI2s based on their connectivity and morphology as previously described (Lackey et al., 2024). It was difficult to categorize many of the PLI targets into PLI subtypes based on morphological reconstructions from a 50-μm-thick volume, because PLIs are less restricted to the parasagittal plane than MLIs. We therefore did not subdivide PLI targets into subtypes in our EM analysis with the exception of four candelabrum cells that we identified. Candelabrum cells were characterized previously based on the location of their cell bodies within the Purkinje cell layer and their pear-shaped soma and beaded axons.
Results
EM reconstructions of PC collaterals and their targets
We initially characterized the connectivity of PC collaterals using a large-scale electron microscopy (EM) dataset and serial reconstructions from lobule V of a mouse cerebellum (Osorno et al., 2022; Nguyen et al., 2023; Lackey et al., 2024). Different types of neurons were identified based on their morphologies. The EM volume we study is approximately 50 μm thick and is well suited to capturing the dendritic and axonal arbors of neurons such as MLIs whose dendrites are in the parasagittal plane parallel to the surface of the slice. PCs are readily identified based on their distinctive large cell bodies and their extensive spiny dendrites. In many cases, PC axons reach the surface of the volume and are cut off, thereby preventing reconstructions of their collaterals and their targets. In lobule V, PC collaterals make most of their synapses near the PC layer and sometimes extend into the lower part of the molecular layer (Witter et al., 2016). Virtually all neurons in the molecular layer are MLIs. MLI1 and MLI2 subtypes were identified on the basis of their distinctive connectivity patterns, with MLI1s primarily contacting PCs and MLI2s mainly contacting MLI1s (Lackey et al., 2024). In addition, MLI1s in the lower two-thirds of the molecular layer extend axons to PC somata and axon initial segments, but MLI2s do not (Lackey et al., 2024). Within 40 μm of the bottom of the PC layer, almost all MLIs are MLI1s (Wang and Lefebvre, 2022; Lackey et al., 2024), whereas MLI1s and MLI2s are interspersed in the rest of the molecular layer. There are three times as many MLI1s as MLI2s in this data set (Lackey et al., 2024), which is consistent with the MLI1:MLI2 ratio in snRNA-seq studies (Kozareva et al., 2021). However, for MLIs in the lower 60% of the molecular layer, whose dendrites are more likely to overlap with PC collaterals, the MLI1–MLI2 ratio is approximately 5:1. Golgi cells, whose cell bodies are located in the granular layer, have extensive dendrites that are often cut off. The cell bodies of PLIs are often located in the PC layer but can be located in the lower molecular layer or the upper granular layer (Hirono et al., 2017; Miyazaki et al., 2021; Osorno et al., 2022). Their dendrites and axons are also often cut off. In some cases, PC collaterals contact unidentified pieces of dendrites in the molecular layer that could correspond to MLI1s, MLI2s, PLIs, or potentially Golgi cells, but by restricting our analysis to collaterals that are near the center of the volume, it is possible to identify almost all of their targets.
As expected (Witter et al., 2016), reconstructed collaterals not only made extensive contacts near the PC layer but also extended into the molecular layer (Fig. 1a). This collateral contacts multiple cell types, including PCs (gray), MLI1s (purple), and MLI2s (green). An expanded view of the 3D reconstruction shows the PC synaptic contact onto an MLI2 (Fig. 1b, top), and the synapse is shown in a single section (Fig. 1b, bottom). A PC–MLI1 synapse (Fig. 1c) and a PC synapse onto another PC (Fig. 1d) are also shown. We previously used EM reconstructions to show that PC collaterals also make putative synapses onto PLIs, specifically candelabrum cells (Osorno et al., 2022).

EM reconstructions reveal that PC collaterals target multiple cell types. a, Reconstructed PC and its collateral (gray), are shown along with three of its targets: an MLI2 (green), an MLI1 (purple), and another PC (light gray). The arrows indicate the locations of insets in b–d. b, Example of a PC–MLI2 connection shown with an expanded view of the 3D reconstruction (top) and with a single section showing vesicles clustering and forming active zones opposite to the membrane of the postsynaptic cell (bottom). c, As in b but for a PC–MLI1 connection. d, As in b but for a PC–PC connection.
We reconstructed six collaterals, identified 244 synaptic boutons, and determined the identities of all but one of the targets (Fig. 2). Synaptic contacts were made onto PCs, PLIs, and MLIs. There were no synaptic contacts onto Golgi cells, which is consistent with previous optogenetic studies (Witter et al., 2016). It was possible to determine the subtype identity of the MLIs, but it was difficult to determine the specific PLI subtypes based on morphological reconstructions from a 50-μm-thick volume. We therefore did not subdivide PLIs into subtypes (although see candelabrum cells in Fig. 4). On average, each collateral made 40.5 ± 5.6 putative synapses (range 28–61). There was considerable variability in the targets of different collaterals (Fig. 2a). The percentage of synapses onto different targets was 53.1 ± 4.0% (range 42–60%) onto PCs, 35.8 ± 5.3% (range 20–51%) onto PLIs, 4.8 ± 1.5% (range 0–7%) onto MLI1s, and 5.7 ± 2.8% (range 0–17%) onto MLI2s (n = 6 PC collaterals; Fig. 2b).
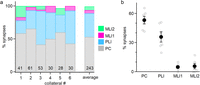
Summary of reconstructions of PC collaterals and their targets. a, Summary of the percentages of PC collateral synapses onto different targets for collaterals of six PCs. The total number of putative synapses for each collateral is indicated. The average for all collaterals is also shown. b, Percentages of synapses made onto different types of targets by different collaterals.
It is possible to use these data to estimate the relative number of putative synaptic contacts onto MLI1s and MLI2s, which are present at a ratio of approximately 5:1 for cells in the inner 60% of the molecular layer. Our reconstructions indicate that there are on average approximately 5.9 (5 × 5.7/4.8) times as many putative PC contacts onto MLI2s as MLI1s and suggest that on average PC–MLI2 synapses are likely to be much stronger than PC–MLI1 synapses.
Optogenetically evoked PC–MLI synapses
In addition to the number of putative synapses, which can be readily estimated from serial reconstructions, factors such as the probability of release, postsynaptic receptors, and quantal size can influence synaptic strength. We therefore used an optogenetic approach to study PC–MLI synapses in brain slices (Fig. 3a). Experiments were performed using Pcp2-Cre Jdhu mice to selectively target PCs (Zhang et al., 2004) that were crossed with a line to conditionally express ChR2-EYFP in PCs (Witter et al., 2016). Responses to optogenetic activation of PCs were recorded in the presence of glutamatergic receptor blockers. Voltage-clamp recordings were made from MLI subtypes in lobule IV/V that were distinguished on the basis of their electrical properties, including their resistance and the presence of spikelets that are a hallmark of electrically coupled cells (Alcami and Marty, 2013). One of the most striking differences between MLI subtypes is that MLI1s are electrically coupled to each other, whereas MLI2s are not (Kozareva et al., 2021; Lackey et al., 2024). The spontaneous firing of a neighboring electrically coupled MLI1 gives rise to spikelets in nearby MLI1s that are a distinguishing feature of MLI1s (Kozareva et al., 2021; Lackey et al., 2024). Recordings were restricted to MLIs in the lower two-thirds of the molecular layer where electrical coupling between MLI1s is stronger, and differences between MLI1 and MLI2 input resistances are larger (Kozareva et al., 2021; Lackey et al., 2024). In addition, collaterals are more prominent in the lower part of the molecular layer (Witter et al., 2016). The ratio of the number of MLI1s to the number of MLI2s in our recordings was 4.9:1 (44 MLI1s and 9 MLI2s), which is consistent with the known distribution of MLI subtypes within 120 μm of the bottom of the PC layer.

Optogenetic activation of PCs preferentially inhibits MLI2s. a, Schematic of slice experiments in which PCs in PC-ChR2 mice were activated with blue light and whole-cell recordings were made from MLI1s and MLI2s. b, Light-activated synaptic response in an MLI2. Inset, The histogram summarizes the amplitudes of 100 responses for this cell. Outward currents are positive and inhibitory. c, Average ± SEM of synaptic responses evoked in nine MLI2s. d, Summary of the optically evoked synaptic responses in MLI1s and MLI2s (averages of 3–5 ms following light activation). e, Amplitudes of evoked responses 3–5 ms following optical stimulation for individual cells as a function of distance from the bottom of the PC layer. Significant responses were evoked in six MLI2s (bold green), and responses in the remaining MLI2s (faint green) and most of the MLI1s (faint purple) were not significant. Small but significant inhibition was observed in 2 of 44 MLI1s. f, Light-activated synaptic responses as in b but for an MLI1. Inset, The histogram shows the amplitudes of 100 responses for this cell. g, Average ± SEM of synaptic responses evoked in 44 MLI1s. The average response is an inward current that reflects a reduction of spontaneous inhibition (disinhibition) that is similar to MLI2 disinhibition of PCs (Lackey et al., 2024). h, Summary of the optical synaptic responses evoked in MLI1s and MLI2s (averages of 15–20 ms following light activation). i, Amplitudes of evoked responses 15–20 ms following optical stimulation for individual cells as a function of distance from the bottom of the PC layer. Significant responses were evoked in 17 MLI1s (dark purple), and responses in the remaining MLI1s (faint purple) and all of the MLI2s (faint green) were not significantly decreased.
Optogenetic activation of PCs evoked synaptic responses in most MLI2s (Fig. 3b–e). As shown for an example MLI2, these responses could be large and reliable (Fig. 3b). In this case, optogenetic activation always evoked a response, and there were never any failures, as shown by a histogram of the amplitudes of responses evoked in 100 trials (Fig. 3b, inset). For the cells with PC–MLI2 connections, failures were observed in 22 ± 9% (n = 6) of the trials. The example optical PC–MLI2 IPSC was quite slow and had a half-decay time of 29 ms (Fig. 3c). The prolonged time course of this response likely reflects our observation that a single brief (1 ms) optical stimulus evoked multiple spikes in PCs when action potentials were recorded extracellularly at the PC soma. Optically evoked responses were detected in six of nine MLI2s located between 50 and 87 μm from the bottom of the PC layer (Fig. 3d,e).
Light-evoked responses were very different in neurons identified on the basis of spikelets and low input resistances. An extremely large IPSC (61 pA) was evoked in 1 of 45 neurons that satisfied these criteria, with the rest of the neurons having average responses near 0 (−3.0 to 2.6, n = 44) and weak but significant PC–MLI1 inhibition observed in 2 of 44 cells (Fig. 3d,e). We therefore did not categorize this neuron as an MLI1 because it was an outlier with properties more consistent with a displaced PLI, which are not strictly located within the PC layer (see Materials and Methods; Osorno et al., 2022). For the remaining 44 neurons that we categorized as MLI1s, rather than evoking an inhibitory IPSC, light activation evoked a net inward current in many of these neurons, as in Figure 3f. These responses were small (Fig. 3f) and highly variable, as shown by a histogram of the magnitude of suppression for 100 trials (Fig. 3f, inset). It is likely that spontaneous IPSCs contribute to the apparent trial-to-trial variability. The net inward current is consistent with PC inhibition of MLI2s leading to disinhibition of MLI1s. The average evoked responses from MLI1s were very small and quite slow (Fig. 3g). Disinhibition was seen in 38% (17 of 45 with a z-score of less than −2) of MLI1s that were located between 45 and 104 μm from the bottom of the PC layer (Fig. 3h,i).
Identifying MLI subtypes targeted by candelabrum cells
To understand how the PC to PLI synapses influence processing in the molecular layer, it is necessary to determine which MLI subtypes are targeted by PLIs. Unfortunately, the axons of most PLIs were not confined to the volume, and it was not possible to reconstruct them sufficiently to determine their synaptic targets. However, we previously reconstructed PC synapses onto candelabrum cells and found that candelabrum cells made extensive synapses onto MLIs, but the identity of MLI targets was not known (Osorno et al., 2022). We therefore used serial EM to identify the MLI subtypes targeted by candelabrum cells (Fig. 4). In Figure 4a, the cell body and the axon of the same PC as in Figure 1 are shown (gray) along with a candelabrum cell that it targets (blue). An expanded view shows a PC synapse onto this candelabrum cell (Fig. 4b). Although the dendrite of this candelabrum cell is incomplete, its distinctive beaded axon extends from the PC layer to the top of the molecular layer where it forms synapses onto 22 MLI1s (purple) and 6 MLI2s (green). Candelabrum to MLI2 (Fig. 4c) and candelabrum to MLI1 (Fig. 4d) synapses are shown in expanded views. We found that four candelabrum cells (whose axons were reconstructed with different degrees of completeness) preferentially targeted MLI1s: candelabrum cells made 249 synapses onto MLI1s and 39 synapses onto MLI2s, so that for candelabrum cell to MLI synapses, 86.5% are onto MLI1s and 13.5% are onto MLI2s (Fig. 4e).

Candelabrum cells preferentially target MLI1s. a, 3D EM reconstruction of MLI1s (purple) and MLI2s (green) targeted by a candelabrum cell (blue) that receives inhibitory input from a PC collateral (gray). The inset shows the synapses onto MLI1s and MLI2s. The dendrites of the candelabrum cell are incomplete because they are cut off by the surface of the slice. The PC dendrite is not shown for clarity. The arrows indicate the locations of regions shown in b–d. b, Example of a PC–candelabrum cell connection shown with an expanded view of the 3D reconstruction (top) and with a single section (bottom). c, As in b but for a candelabrum cell to MLI2 synapse. d, As in b but for a candelabrum cell to MLI1 synapse. e, Summary of candelabrum cell synapses onto MLI1s and MLI2s for four individual candelabrum cells, and the total for all candelabrum cells, with the number of reconstructed synapses indicated. This is an extension of previous reconstructions that had not determined the identities of the MLI subtypes (Osorno et al., 2022).
Discussion
Our main finding is that PCs selectively inhibit MLI2s and primarily disinhibit MLI1s. This suggests that PC–MLI2 inhibition ultimately suppresses PC firing, which is a major revision of the previous view that the PC to MLI pathway would disinhibit PCs. Moreover, our findings establish that there are multiple pathways that work in concert to provide negative feedback to PCs and suppress PC firing: the PC–MLI2–MLI1–PC, PC–candelabrum cell–MLI1–PC, and PC–PC pathways (Fig. 5).

Circuit diagrams of PC collaterals and their interneuron targets in the cerebellar cortex. a, Schematics of PC collaterals and their targets, MLI1s, MLI2s, and candelabrum cells (CCs). b, Three-ring inhibitory loop involving PCs, MLI2s, and MLI1s. MLI2–MLI1 connectivity (both synaptic and electrical) has been constrained with EM reconstructions and slice recordings (Lackey et al., 2024) and modeled accordingly (Santos-Valencia et al., 2025). MLI1–MLI2 connections are weak, and MLI2–MLI1 connections are powerful. Similarly, MLI2–PC connections are weak, and MLI1–PC connections are strong (Lackey et al., 2024). c, Three-ring inhibitory loop involving PCs, CCs, and MLI1s. A previous study found that numerous PCs make powerful contacts onto each PC, and that MLI–CC synapses are rare (Osorno et al., 2022). d, Two-ring inhibitory loop involving PCs. Our EM reconstructions suggest that PCs inhibit numerous MLI2s that in turn inhibit many MLI1s and they ultimately inhibit many PCs. It is therefore more appropriate to think of elements in the diagrams as representing populations of PCs, MLI2s, and MLI1s rather than individual PCs, MLI1s, and MLI2s that contribute to a precise loop. It has been more challenging to estimate the number of connections and cells targeted by each PC using EM reconstructions because there is considerable variability in the complexities of PC collaterals (Witter et al., 2016), they are often quite extensive, and they are prone to being cut off by the surface of the slice. Optogenetic studies suggest that there are powerful connections onto PCs, but it is difficult to estimate the precise number and strengths of PC–PC inputs using optogenetics (Witter et al., 2016; Halverson et al., 2022). Additional studies are needed to further constrain the circuits in b–d to include numbers of targets and connection strengths in order to guide modeling the effects of PC collaterals and the properties of loops involving these collaterals.
PC synapses preferentially target MLI2s
EM reconstructions and slice electrophysiology both indicate that PCs preferentially inhibit MLI2s. Reconstructions indicate that although PC collaterals make a comparable number of putative synaptic contacts onto MLI1s and MLI2s, the approximately fivefold difference in the number of MLI1s within 120 μm of the PC layer suggests that each MLI2 will receive PC inputs that are approximately six (5 × 5.7/4.8) times larger. Optogenetic studies were also consistent with a much stronger PC inhibition of MLI2s than MLI1s: two-thirds of MLI2s were directly inhibited by PCs, and inhibitory PC–MLI1 connections were rarely observed. Based on EM reconstructions, we were surprised that only very weak PC–MLI1 inhibition was observed in 2 of 44 cells. It is possible that PC–MLI2–MLI1 and PC–PLI–MLI1 disinhibition obscures small direct PC–MLI1 inhibition, or that each PC–MLI1 synapse is weaker than each PC–MLI2 synapse because their probability of release is lower, or they are associated with a lower number of GABAA receptors. Our results indicate that while PCs do not strongly inhibit MLI1s, they lead to MLI1 disinhibition and are part of a PC–MLI2–MLI1–PC loop (Fig. 5b). Based on EM reconstructions, PCs inhibit numerous MLI2s that in turn inhibit many MLI1s, and they ultimately inhibit many PCs. This suggests that rather than being a precise loop restricted to individual PCs, MLI1s and MLI2s, it is more appropriate to consider it in terms of populations of PCs, MLI2s and MLI1s. Additional experiments are required to determine if PCs preferentially inhibit MLI2s and disinhibit MLI1s in all regions of the cerebellar cortex because our EM reconstructions were performed in lobule V of the vermis, and our recordings were made in lobules IV/V of the vermis.
The PC–PLI–MLI pathway
Our reconstructions also provide insight into the functional role of PC to PLI feedback (Fig. 5c). Without knowing the subtype specificity of PLI–MLI synapses, it was not known if this pathway promotes plasticity and elevates PC firing or suppresses plasticity and reduces PC firing. We were able to address this issue for candelabrum cells, which are the most numerous subtype of PLI, and our reconstructions established that candelabrum cells make 5.9 times as many synapses onto MLI1s than onto MLI2s (Fig. 4). In contrast to PC collaterals that are restricted to the PC layer and the lower part of the molecular layer, candelabrum cell axons extend to the surface of the molecular layer and form synapses throughout this region (Laine and Axelrad, 1994; Osorno et al., 2022). Therefore, candelabrum cell synapses are in the vicinity of three times as many MLI1s as MLI2s, and based solely on EM reconstructions, we estimate that on average candelabrum cell synapses are approximately twice (5.9/3) as strong onto each MLI1 than each MLI2. The PC–candelabrum cell-MLI circuit is therefore well suited to allowing elevated PC activity to disinhibit MLI1s and increase inhibition of PCs. These findings are consistent with the observation that candelabrum cell activation suppresses spontaneous IPSCs in PCs (Osorno et al., 2022). Although it is well established that PCs also strongly inhibit Lugaro cells and globular cells, we were unable to fully reconstruct the axons of these cells in our EM volume to determine which subtype of MLI they preferentially target. Based on the molecular similarity of Lugaro cells, globular cells, and candelabrum cells, and to a somewhat lesser extent MLI2s (Kozareva et al., 2021), it seems likely that Lugaro cells and globular cells also preferentially target MLI1s, but further experiments are needed to determine if this is the case.
Overview of targets of PC collaterals
The characterization of all synapses made by PC collaterals provides an overview of the relative strengths of different pathways. PC collateral synapses are made onto three types of targets: 53% PC, 36% PLI, and 11% MLI. These findings are consistent with optogenetic studies in which light-evoked PC IPSCs were large and consistently evoked in PCs and Lugaro cells (a type of PLI), but they were only observed in 25% of the MLIs and were not observed in any Golgi cells (Witter et al., 2016). Consistent with our finding that PCs selectively inhibit MLI2s, this percentage of MLIs is comparable to the percentage of MLI2s in our snRNA-seq study (24.5%, 10,608 MLI2s/43,324 total MLIs; Kozareva et al., 2021) and the percentage of MLI2s in our EM dataset (24%, 26 MLI2s/108 total MLIs; Lackey et al., 2024). Although the PC–PC, PC–MLI2–MLI1–PC, and PC–candelabrum cell–MLI1–PC pathways all allow elevated PC firing to provide negative feedback and suppress PC firing (Fig. 5), it is likely that there are important differences in their contributions to cerebellar processing. More generally, our findings highlight that specialized connectivity of MLI1 and MLI2 leads to major feedforward and feedback mechanisms that call for a substantial revision of standard cerebellar circuit models (Marr, 1969; Ito, 2006; De Schepper et al., 2022).
PC collaterals and plasticity
There are numerous forms of plasticity in the cerebellar cortex (Kano et al., 1992; Salin et al., 1996; Hansel et al., 2001; Kreitzer and Regehr, 2001a,b; Brown et al., 2003; Belmeguenai et al., 2010; Suvrathan and Raymond, 2018; Voerman et al., 2024), and it is likely that inhibition regulates the subset of plasticity mechanisms that rely on calcium increases in PCs. Little is known about inhibitory regulation of most types of plasticity, but it has been established that MLIs regulate dendritic calcium signaling and long-term depression (LTD) of granule cell to PC synapses (Callaway et al., 1995; Rowan et al., 2018). It is likely that PC collateral inhibition of other PCs and collateral pathways that lead to disinhibition of MLI1s differentially regulate LTD. When PC firing rates are elevated, the PC–MLI2–MLI1–PC and PC–candelabrum cell–MLI1–PC pathways will increase MLI1 firing frequency, reduce climbing fiber-induced calcium signals in PC dendrites, and suppress LTD. In contrast, the PC–PC pathway only leads to activation of inhibitory synapses onto the proximal PC dendrite and the soma and is not expected to exert a strong influence on dendritic calcium signals and LTD. Thus, although all three pathways are expected to provide negative feedback to PCs and suppress firing, activation of MLI2s and candelabrum cells is expected to be much more effective at regulating dendritic calcium and LTD. Further experiments are needed to clarify how PC feedback influences plasticity in vivo.
PC collaterals and oscillations
Different PC collateral pathways likely contribute to oscillatory PC firing in different ways. PCs can generate 150–200 Hz oscillations in mice that can be time locked to movements (Adrian, 1935; Dow, 1938; Isope et al., 2002; de Solages et al., 2008; Groth and Sahin, 2015; Cheron et al., 2016). It is thought that PC–PC inhibition (Fig. 5d) underlies these oscillations. Mutual inhibition of PCs is well suited to generate oscillatory firing at a frequency determined by the synaptic delay and the time constant of the PC (Orduz and Llano, 2007; de Solages et al., 2008). The PC–MLI2–MLI1–PC and PC–candelabrum cell–MLI1–PC loops are also suited to generating oscillations. These circuits have the architecture of ring oscillators, which consist of an odd number of inverting stages connected in a ring (Still and Le Masson, 1999; Horikawa, 2011). This circuit generates oscillations with a frequency (f) given by f = (1/2tn), where n is the number of stages and t is the delay at each stage (Razavi, 2017). Digital electronics exploits this property and generates oscillations using ring oscillators (Razavi, 2017). For loops of inhibitory neurons in the cerebellum, delays are the time taken to suppress firing in target cells, which is determined by the synaptic delay and time constants of the different cells. Loops involving MLIs are unlikely to contribute to the 150–200 Hz oscillations because (1) we estimate that the delays are more consistent with generating slower oscillations in the 30–100 Hz range, (2) 150–200 Hz oscillations are amplified by activation of cannabinoid CB1Rs that strongly suppresses MLI–PC synapses but leaves PC–PC synapses intact (de Solages et al., 2008), and (3) the power spectra of the MLI spike-triggered average does not have the 200 Hz peak that is prominent in the PC spike-triggered average (Blot et al., 2016). It is possible that loops involving MLIs do not produce ongoing oscillatory activity but that they provide transient or context-dependent negative feedback. Further experimental work and modeling will be needed to clarify the conditions under which these loops influence PC spiking.
Footnotes
- Received July 16, 2025.
- Revision received December 29, 2025.
- Accepted January 8, 2026.
-
This work was supported by the NIH (R35NS097284 to W.G.R., F32NS133036 to E.P.L., R21NS085320, and RF1MH128949, and RF1MH114047 to W-C.A.L.), and the Edward R. and Anne G. Lefler Center. Portions of this research were conducted on the O2 High Performance Computer Cluster at Harvard Medical School.
-
↵*E.P.L. and A.N. contributed equally to this work.
-
Harvard University filed a patent application regarding GridTape (WO2017184621A1) on behalf of the inventors, including W.-C.A.L., and negotiated licensing agreements with interested partners.
- Correspondence should be addressed to Wade G. Regehr at wade_regehr{at}hms.harvard.edu.
- Copyright © 2026 the authors




