Distinct Neural Plasticity Enhancing Visual Perception
- 1Sagol School of Neuroscience, Tel Aviv University, Tel Aviv 6997801, Israel
- 2The School of Psychological Sciences, Tel Aviv University, Tel Aviv 6997801, Israel
- 3Tel Aviv Sourasky Medical Center, Tel Aviv 6423906, Israel
- 4Faculty of Medicine, Tel Aviv University, Tel Aviv 6997801, Israel
-
Author contributions: T.K., N.T., H.S., I.T., and N.C. designed research; T.K. performed research; N.T. and I.T. contributed unpublished reagents/analytic tools; T.K. analyzed data; T.K., N.T., I.T., and N.C. wrote the paper.
Abstract
The developed human brain shows remarkable plasticity following perceptual learning, resulting in improved visual sensitivity. However, such improvements commonly require extensive stimuli exposure. Here we show that efficiently enhancing visual perception with minimal stimuli exposure recruits distinct neural mechanisms relative to standard repetition-based learning. Participants (n = 20, 12 women, 8 men) encoded a visual discrimination task, followed by brief memory reactivations of only five trials each performed on separate days, demonstrating improvements comparable with standard repetition-based learning (n = 20, 12 women, 8 men). Reactivation-induced learning engaged increased bilateral intraparietal sulcus (IPS) activity relative to repetition-based learning. Complementary evidence for differential learning processes was further provided by temporal–parietal resting functional connectivity changes, which correlated with behavioral improvements. The results suggest that efficiently enhancing visual perception with minimal stimuli exposure recruits distinct neural processes, engaging higher-order control and attentional resources while leading to similar perceptual gains. These unique brain mechanisms underlying improved perceptual learning efficiency may have important implications for daily life and in clinical conditions requiring relearning following brain damage.
- fMRI
- learning and memory
- memory consolidation
- neural plasticity
- perceptual learning
- visual perception
Significance Statement
The adult human brain shows remarkable plasticity resulting in improved visual perception following practice. Here, we document a distinct neural pathway in the human brain, supporting enhanced perceptual learning efficiency. These unique neural mechanisms are triggered by brief memory reactivations, which replace prolonged repetition-based stimuli exposure to enable enhanced visual perception. The results suggest that efficiently enhancing visual perception with minimal stimuli exposure distinctively engages higher-order control and attentional resources while leading to similar behavioral gains. Evidence for differential off-line learning processes was further provided by resting functional connectivity changes. The findings shed light on unique brain mechanisms underlying improved perceptual learning efficiency and may have important implications for daily life and in clinical conditions.
Introduction
Visual sensitivity can be remarkably improved following perceptual learning even among fully matured adults (Karni and Sagi, 1991; Kellman and Garrigan, 2009; Watanabe and Sasaki, 2015). These improved visual skills, beneficial for various applications (Deveau et al., 2014; Greenlee, 2014; Lu et al., 2016; Sha et al., 2020; Seitz et al., 2023), endure for extended periods, spanning months and years (Karni and Sagi, 1993; Yotsumoto et al., 2008). Nevertheless, achieving such substantial perceptual gains commonly demands practicing with hundreds of repetitions (Karni and Sagi, 1991; Schoups et al., 2001; Watanabe et al., 2001; Adini et al., 2002; Censor et al., 2006, 2016b). Therefore, research has been exploring approaches to enhance the efficiency of such repetition-based perceptual learning.
One of the characteristics of procedural skills, such as perceptual learning, is their dependency on memory consolidation processes (Karni and Sagi, 1993; Walker, 2005; Censor and Sagi, 2008; Yotsumoto et al., 2009; Gervan and Kovacs, 2010; de Weerd et al., 2012; Tamaki et al., 2018; Shmuel et al., 2021). In the last decades, learning and memory research has provided evidence suggesting that reactivation of a previously consolidated memory opens a time window for its modulation. Accordingly, studies have shown memory modulation in rodents following reactivation (Nader et al., 2000a,b), and similar processes have been observed in humans (Schiller et al., 2010; Censor et al., 2014; de Beukelaar et al., 2014; Shmuel et al., 2021; Herz et al., 2022). The latter includes enhanced memory and skill performance in perceptual and motor learning domains (Amar-Halpert et al., 2017; Herszage et al., 2021). Such mechanisms bear enormous potential for enhancing learning efficiency. Here we show that improving the efficiency of perceptual learning by replacing repetition-based learning with brief memory reactivations engages distinct brain mechanisms.
The neural mechanisms underlying visual perceptual learning are predominantly attributed to practice-dependent plasticity (Li, 2016). This notion suggests that repetitive exposure to simple visual stimuli induces plasticity in early visual areas and their readouts (Schwartz et al., 2002; Yotsumoto et al., 2008; Dosher et al., 2013; Seitz, 2020). Accordingly, we hypothesized that in contrast to practice-dependent plasticity, inducing perceptual learning with brief reactivations would enhance learning efficiency by engaging higher-order brain regions (Dosher and Lu, 1998; Sasaki et al., 2010; Shibata et al., 2014; Seitz, 2020).
To address this, participants performed a standard texture discrimination task (TDT; Karni and Sagi, 1991). The memory was first encoded and consolidated with an initial standard session (252 trials; Session 1), where the discrimination threshold was measured. Participants then returned for three sessions on separate days, during which the encoded memory was reactivated with five near-threshold reminder trials (Reactivation group). An additional group of participants performed standard repetition-based sessions on separate days (Repetition-practice group). A standard retest was performed on Session 5 to measure the final discrimination thresholds. Task-based and resting-state fMRI were measured in Sessions 1 and 5.
Materials and Methods
Participants
Forty-one healthy adults aged 18–40 years (16 males; average age, 24.71 years; SD, 3.25) completed the study, which was approved by the Tel Aviv Sourasky Medical Center and Tel Aviv University's Ethics Committees. All participants provided written informed consent to participate in the study, had normal or corrected-to-normal vision, were not video gamers (Kim et al., 2015), did not participate in other visual experiments during the study, and reported at least 6 h of sleep the night before each experimental session (performed during daytime).
One participant's pretraining behavioral data from the fMRI session are missing due to a technical problem. One participant from the Repetition group was not included in the analysis due to extreme deterioration in performance (Z-score = −3.9).
Experimental design
The memory of all participants was first encoded and consolidated in a standard TDT session (Session 1; Fig. 1a,b), during which the discrimination threshold was measured. Twenty participants then returned for three sessions on separate days, during which the encoded memory was reactivated with only five near-threshold memory reactivation trials (Reactivation group). Reactivation trials were set individually at the stimulus-to-mask–onset asynchrony (SOA) given in the initial session that was closest above the threshold (reactivation SOA range, 80–220 ms; mean, 129 ms; SD, 37.0 ms; for threshold measurement, see below, Stimuli and task and Behavioral data analysis). We have set the reactivation trials at the SOA closest above threshold performance, to maintain consistency with previous studies (Amar-Halpert et al., 2017; Shmuel et al., 2021). Importantly, a control experiment in Amar-Halpert et al. (2017) has shown similar reactivation-induced learning also in far-threshold conditions.
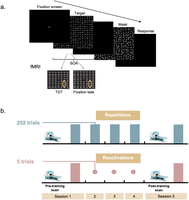
Task and experimental procedure. a, An example trial of the texture discrimination task (TDT). Observers were required to discriminate between a horizontal or vertical orientation of a peripheral target consisting of three diagonal bars appearing for 10 ms. Fixation was enforced by a forced-choice letter discrimination task (rotated T or L) at the center of the display and was followed by auditory feedback for incorrect discrimination. On the lab sessions, the SOA (measured from the onset of the target to the onset of the mask) varied within the session to obtain a psychometric curve, from which the SOA discrimination threshold was derived. On the fMRI sessions, the SOA was fixed, and performance was measured as a percentage of correct responses. In addition to the TDT trials, the fMRI sessions included also control fixation trials in which the target peripheral stimulus was removed. b, Experimental procedure. Following an initial encoding session, the Repetition group (blue) performed three full standard sessions with 252 trials each (represented by bars), while the Reactivation group performed three sessions in which the perceptual skill memory was briefly reactivated with only five reactivation trials (represented by dots). Final performance in both groups was measured in Session 5. Sessions were performed on separate days. fMRI scans were performed pre- and post-training.
The additional 20 participants performed repetition-based daily sessions (252 trials per session, Repetition group; see below, Stimuli and task). A standard retest session was then performed to measure the final discrimination threshold of both groups. Task-based fMRI was performed pre- and post-training before performing the TDT session; Figure 1b. To avoid the fatigue effect, a 30 min break was given to the participants after finishing the fMRI scan and before starting the lab TDT session. Experimental sessions took place every other day (or with a 2 d interval on weekends) and were performed during daytime.
Before the first session, participants underwent a preliminary scan on a separate day in which (1) a resting-state fMRI and (2) a functional visual localizer were performed. The visual localizer was used for localizing the visual brain area, specifically corresponding to the retinotopic location of the task target stimulus. On the post-training scan, before performing the task-based fMRI, a resting-state fMRI was performed again. Both resting-state scans (pre- and post-training) lasted 8 min and were acquired while participants were lying awake with their eyes closed. Diffusion MRI was also measured in the preliminary and final scans for a different project.
Stimuli and task
Lab sessions
The standard TDT (Karni and Sagi, 1991), with a 10 ms target screen, followed by a 100 ms mask was used (Fig. 1a). Observers had to discriminate whether a target array consisting of three diagonal bars (appearing 5.46° from the center of the visual field, in the lower-right quadrant) was horizontal or vertical and responded by pressing one of the two mouse buttons. The target stimulus was embedded in a background consisting of horizontal bars (19 × 19 bars, 0.57° × 0.04° spaced 0.86° apart, 0.04° jitter). Fixation was enforced by a forced-choice letter discrimination task, in which observers had to discriminate whether a rotated letter, presented in the center of the screen, was a T or an L, with auditory feedback for incorrect discrimination. The display size was 15.4° × 15.1°, viewed from 108 cm on a 20 in (50.8 cm) CRT HP p1230 monitor, with a refresh rate of 100 Hz and mean texture luminance of 84 cd/m2. In each standard repetition-based session, the time interval between the target stimulus and the mask (SOA; measured from the onset of the target to the onset of the mask) ranged from 40 to 340 ms (40, 60, 80, 100, 120, 140, 160, 180, 200, 220, 240, 260, 300, and 340 ms) and was pseudorandomized across trials. Each block consisted of two trials per SOA (for a total of 252 trials over nine blocks, 18 trials per each SOA). To familiarize the participants with the task, we conducted pretraining blocks consisting of 10 trials prior to the first session. These blocks were conducted initially with an SOA of 500 ms and then repeated with an SOA of 340 ms until subjects achieved 90% accuracy. A maximum of 10 blocks overall was provided, after which subjects who did not reach this criterion did not continue the experiment (Klorfeld-Auslender and Censor, 2019; Kondat et al., 2023). Two participants did not continue following this criterion. The average number of pretraining blocks was 3.3 blocks, SD 1.55. Pretraining was followed by a short familiarization block of one trial per each SOA. To ensure reliable baseline measurements, participants were required to reach (1) above 80% correct responses on the three highest SOAs or (2) above 0.8 finger errors on Session 1 (Kondat et al., 2023; finger-error parameter ranging from 0 to 1). Accordingly, 15 participants did not meet these criteria and therefore did not continue the experiment. Additionally, three participants were excluded following Session 1 as their psychometric curve did not demonstrate a typical sigmoid curve pattern, similarly providing extreme threshold values and an unreliable baseline measure for evaluating subsequent threshold and brain-related changes. All sessions were performed in a dark, quiet room.
fMRI sessions
Stimuli were presented via an LCD screen, 32 in (81.28 cm), with a refresh rate of 120 Hz. fMRI sessions included three runs and were performed in a block-design paradigm. Each run was divided into four blocks; each block consisted of six trials of TDT (3 runs × 4 blocks × 6 trials = 72 trials). Along with the TDT trials, each run consisted of four control fixation blocks, with six trials each, which were identical to the TDT trials excluding the target stimulus (control trials; Fig. 1a). TDT and fixation blocks were presented in a pseudorandom order of no more than two sequential blocks of the same condition. As a cue for the block type, the fixation circle at the beginning of each trial appeared either in white, to indicate a TDT block, or in green, to indicate a fixation block. All the trials' SOA were fixed (Schwartz et al., 2002; Yotsumoto et al., 2008; Kim et al., 2015) at 133.3 ms which was determined based on a pilot study. Every block lasted 18 s (3 s per trial). A fixation screen was presented for 18 s after each block to allow the blood oxygenation level-dependent (BOLD) signal to decrease. After each run, participants were allowed to take a break while they were inside the scanner, and the next run started only when they were ready. To provide an identical duration for all trials, the fixation screen appeared for 766.67 ms, then the target screen appeared automatically, and the response screen lasted for 2,000 ms. A response box with two buttons was used for responding to the task. Participants were instructed to respond only with their dominant hand as they did with the computer mouse. Headphones (S14 in-ear headphones, by Sensimetrics) were used to give the auditory feedback. To familiarize the participants with the task in the MRI settings, we performed two practice blocks, with 300 and 133.3 ms SOA, in Session 1 before starting the task.
Behavioral data and statistical analysis
The individual visual thresholds were calculated for Sessions 1 and 5 using the standard Weibull fit for the psychometric
curve with slope β and finger-error parameter 1-p yielding the function as follows (Censor et al., 2006):<mml:math display="block"><mml:mi>P</mml:mi><mml:mo stretchy="false">(</mml:mo><mml:mi>t</mml:mi><mml:mo stretchy="false">)</mml:mo><mml:mo>=</mml:mo><mml:mi>p</mml:mi><mml:mrow><mml:mo>{</mml:mo><mml:mrow><mml:mn>1</mml:mn><mml:mo>−</mml:mo><mml:mstyle
displaystyle="true" scriptlevel="0"><mml:mrow><mml:mfrac><mml:mn>1</mml:mn><mml:mn>2</mml:mn></mml:mfrac></mml:mrow><mml:mi>exp</mml:mi><mml:mspace
width="0.2em"></mml:mspace><mml:mrow><mml:mo>[</mml:mo><mml:mrow><mml:mo>−</mml:mo><mml:msup><mml:mrow><mml:mrow><mml:mo>(</mml:mo><mml:mrow><mml:mstyle
displaystyle="true" scriptlevel="0"><mml:mrow><mml:mfrac><mml:mi>t</mml:mi><mml:mi>T</mml:mi></mml:mfrac></mml:mrow></mml:mstyle></mml:mrow><mml:mo>)</mml:mo></mml:mrow></mml:mrow><mml:mi>β</mml:mi></mml:msup></mml:mrow><mml:mo>]</mml:mo></mml:mrow></mml:mstyle></mml:mrow><mml:mo>}</mml:mo></mml:mrow><mml:mo>+</mml:mo><mml:mstyle
displaystyle="true" scriptlevel="0"><mml:mrow><mml:mfrac><mml:mrow><mml:mn>1</mml:mn><mml:mo>−</mml:mo><mml:mi>p</mml:mi></mml:mrow><mml:mn>2</mml:mn></mml:mfrac></mml:mrow><mml:mo>=</mml:mo><mml:mstyle
displaystyle="true" scriptlevel="0"><mml:mrow><mml:mfrac><mml:mn>1</mml:mn><mml:mn>2</mml:mn></mml:mfrac></mml:mrow><mml:mrow><mml:mo>{</mml:mo><mml:mrow><mml:mn>1</mml:mn><mml:mo>+</mml:mo><mml:mi>p</mml:mi><mml:mrow><mml:mo>[</mml:mo><mml:mrow><mml:mn>1</mml:mn><mml:mo>−</mml:mo><mml:mi>exp</mml:mi><mml:mspace
width="0.2em"></mml:mspace><mml:mrow><mml:mo>[</mml:mo><mml:mrow><mml:mo>−</mml:mo><mml:msup><mml:mrow><mml:mrow><mml:mo>(</mml:mo><mml:mrow><mml:mstyle
displaystyle="true" scriptlevel="0"><mml:mrow><mml:mfrac><mml:mi>t</mml:mi><mml:mi>T</mml:mi></mml:mfrac></mml:mrow></mml:mstyle></mml:mrow><mml:mo>)</mml:mo></mml:mrow></mml:mrow><mml:mi>β</mml:mi></mml:msup></mml:mrow><mml:mo>]</mml:mo></mml:mrow></mml:mrow><mml:mo>]</mml:mo></mml:mrow></mml:mrow><mml:mo>}</mml:mo></mml:mrow><mml:mo>,</mml:mo></mml:mstyle></mml:mstyle></mml:math>P(t)=p{1−12exp[−(tT)β]}+1−p2=12{1+p[1−exp[−(tT)β]]},
where t is the SOA, P is the success ratio (in the closed interval [0,1]) of target discrimination for a given SOA, and T is the threshold for each curve, defined as the SOA for which 81.6% of responses were correct when p = 1.
Then, repeated-measure analysis of variance (ANOVA) was conducted to evaluate learning in each group by comparing standard
initial Session 1 thresholds and final Session 5 thresholds (Amar-Halpert et al., 2017). The learning percentage was calculated for each participant as percent improvement from Session 1 to Session 5 <mml:math display="inline"><mml:mo stretchy="false">(</mml:mo><mml:mo stretchy="false">(</mml:mo><mml:mo stretchy="false">(</mml:mo><mml:mi>t</mml:mi><mml:mi>h</mml:mi><mml:mi>r</mml:mi><mml:mi>e</mml:mi><mml:mi>s</mml:mi><mml:mi>h</mml:mi><mml:mi>o</mml:mi><mml:mi>l</mml:mi><mml:msub><mml:mi>d</mml:mi><mml:mrow><mml:mi>S</mml:mi><mml:mi>e</mml:mi><mml:mi>s</mml:mi><mml:mi>s</mml:mi><mml:mi>i</mml:mi><mml:mi>o</mml:mi><mml:mi>n</mml:mi><mml:mn>1</mml:mn></mml:mrow></mml:msub><mml:mo>−</mml:mo><mml:mi>t</mml:mi><mml:mi>h</mml:mi><mml:mi>r</mml:mi><mml:mi>e</mml:mi><mml:mi>s</mml:mi><mml:mi>h</mml:mi><mml:mi>o</mml:mi><mml:mi>l</mml:mi><mml:msub><mml:mi>d</mml:mi><mml:mrow><mml:mi>S</mml:mi><mml:mi>e</mml:mi><mml:mi>s</mml:mi><mml:mi>s</mml:mi><mml:mi>i</mml:mi><mml:mi>o</mml:mi><mml:mi>n</mml:mi><mml:mn>5</mml:mn></mml:mrow></mml:msub><mml:mo
stretchy="false">)</mml:mo><mml:mi>t</mml:mi><mml:mi>h</mml:mi><mml:mi>r</mml:mi><mml:mi>e</mml:mi><mml:mi>s</mml:mi><mml:mi>h</mml:mi><mml:mi>o</mml:mi><mml:mi>l</mml:mi><mml:msub><mml:mi>d</mml:mi><mml:mrow><mml:mi>S</mml:mi><mml:mi>e</mml:mi><mml:mi>s</mml:mi><mml:mi>s</mml:mi><mml:mi>i</mml:mi><mml:mi>o</mml:mi><mml:mi>n</mml:mi><mml:mn>1</mml:mn></mml:mrow></mml:msub><mml:mo
stretchy="false">)</mml:mo><mml:mspace width=".1em"></mml:mspace><mml:mo>*</mml:mo><mml:mspace width=".1em"></mml:mspace><mml:mn>100</mml:mn><mml:mo
stretchy="false">)</mml:mo></mml:math>(((thresholdSession1−thresholdSession5)thresholdSession1)*100)
. One-way ANOVA was used to compare learning percentages between groups.
As the psychophysical measurements inside the scanner included a fixed SOA, from which a psychometric function cannot be derived, performance in the fMRI sessions was calculated as the correct response percentage out of the total number of trials in a session. Then, repeated-measure ANOVA tests were conducted to evaluate learning effects and differences between the groups following training. To confirm the reliability of the measurements, the relation between lab performance and fMRI performance was examined. Since the pretraining percent correct baseline in fMRI session often produced results close to the chance level due to the intentionally selected challenging SOAs, a correlation was conducted using post-training performance. One-tailed Pearson's correlation between discrimination thresholds and correct response percentages post-training was calculated for each group. To evaluate the correlation between performance in reactivation trials and total improvement, one-tailed Pearson's r coefficient was calculated. Reactivation performance metrics were calculated as a percentage of correct responses out of the total 15 reactivation trials.
Image acquisition
Imaging data were acquired with a 3 T Siemens MAGNETOM Prisma scanner equipped with a 64-channel head coil at The Alfredo Federico Strauss Center for Computational Neuroimaging, Tel Aviv University. Structural images were acquired with an MPRAGE sequence [repetition time/ echo time (TR/TE), 0551/2.61 ms; flip angle, 8°; field of view (FOV), 224 × 224 mm; slice thickness, 1 mm; 176 axial slices]. Resting-state, functional localizer, and visual task fMRI images were acquired with a gradient echo-planar imaging (EPI) sequence of functional T2 * weighted images (TR/TE, 1,000/34 ms; flip angle, 60°; FOV, 196 × 196 mm; slice thickness, 2 mm; 72 interleaved axial slices per volume). Functional localizer and visual task scans comprised a total of 288 volumes (after the first five volumes were discarded to account for T1 equilibrium effects), which lasted 4:44 min. Resting-state scans consisted of 480 volumes and lasted 8 min. Spin-echo EPI with opposite phase encoding directions were acquired to calculate field maps and correct for magnetic field inhomogeneities (Van Essen et al., 2012).
fMRI processing
T1-weighted images were brain-extracted using FMRIB's brain extraction tool (Smith, 2002). fMRI preprocessing for both task-based and resting-state fMRI was performed using FMRIB Software Library (FSL v6.0.3; Smith et al., 2004) and included high-pass filtering at 0.01 Hz, motion correction using MCFLIRT (Jenkinson et al., 2002), linear registration to the T1w anatomical scan, nonlinear registration to 152 MNI space, smoothing with 5 mm Gaussian kernel, and magnetic field unwarping (EPI echo spacing, 0.56 ms; TE, 34 ms; unwarp direction, −y; signal loss threshold, 10%). Residual noise was cleaned using FMRIB's ICA-based X-noiseifier (Griffanti et al., 2014), a semiautomatic ICA-based method, to identify and remove structured noise from fMRI scans.
Whole-brain analysis
Statistical analysis was performed using the FSL FMRI Expert Analysis Tool. Z statistical maps for the changes in BOLD signal were generated for the TDT > fixation contrast. A cluster-wise threshold
of Z > 3.1 and a corrected cluster significance threshold of <mml:math display="inline"><mml:mi>p</mml:mi><mml:mo>=</mml:mo><mml:mn>0.05</mml:mn></mml:math>p=0.05
in a mixed-effect analysis were applied. A first-level analysis was performed for each run of each participant. TDT and fixation
conditions were included as explanatory variables in the design matrix. TDT > fixation contrast was calculated. A second-level
analysis was performed to combine the three runs for each participant. To evaluate the brain activity of the task pre-training,
a group-level analysis was performed by combining the pre-training scans across all participants. For the main analysis comparing
the activity of the two groups following training, a midlevel analysis was used to contrast post-training > pre-training for
each participant. Then, a group-level analysis was performed to contrast Reactivation > Repetition. The analysis was performed
on a volume representation of the brain, and results were then projected on a surface representation using Connectome Workbench
1.4.2 (Marcus et al., 2011).
Region of interest (ROI) analysis
A functional localizer was used to identify the trained visual region. A standard flickering checkerboard circle changing color with a black background was presented in the lower-right quadrant to match the discrimination task's target stimulus site (Yotsumoto et al., 2014; Shmuel et al., 2021). Participants were instructed to maintain fixation on a cross at the center of the screen during the scan.
Five more types of visual stimuli were presented in the localizer scan to enable localizing an untrained region in the visual field: (1) a flickering checkerboard circle in the upper-left quadrant of the visual field, (2) vertical checkerboards centered on the vertical meridian axis and symmetric to the fixation point, (3) horizontal checkerboards centered on the horizontal meridian axis and symmetric to the fixation point, (4) checkerboard placed in the lower-right quadrant with the part that correspond to the trained region that was just in black, and (5) checkerboard placed in the upper-left visual field with the part that correspond to an untrained region that was in black. Stimuli were presented in a block-design manner, alternating with blocks of central fixation. Each stimulus and fixation block lasted 12 s, and each stimulus appeared twice.
The trained visual region was defined by contrasting activity during lower-right stimulus blocks with the fixation blocks
and was constrained to the early visual cortex (V1 and V2). For this purpose, V1 and V2 were defined using the Julich-Brain
Cytoarchitectonic Probabilistic Atlas, thresholded to a 50% probability of being in the corresponding region (Amunts et al., 2020). The intersection between brain activity corresponding to the representation of the trained visual region (cluster-wise
threshold of <mml:math display="inline"><mml:mi>Z</mml:mi><mml:mo>></mml:mo><mml:mn>3.1</mml:mn></mml:math>Z>3.1
and a corrected cluster significance threshold of <mml:math display="inline"><mml:mi>p</mml:mi><mml:mo>=</mml:mo><mml:mn>0.05</mml:mn></mml:math>p=0.05
, mixed-effect analysis) and the representation of V1 and V2 were used as a trained ROI. The average MNI coordinate location,
across participants, was <mml:math display="inline"><mml:mo stretchy="false">[</mml:mo><mml:mrow><mml:mi>X</mml:mi><mml:mo>,</mml:mo><mml:mi>Y</mml:mi><mml:mo>,</mml:mo><mml:mspace
width="0.25em"></mml:mspace><mml:mi>Z</mml:mi></mml:mrow><mml:mo stretchy="false">]</mml:mo><mml:mo>=</mml:mo><mml:mo stretchy="false">[</mml:mo><mml:mo>−</mml:mo><mml:mn>14</mml:mn><mml:mo>,</mml:mo><mml:mspace
width="0.25em"></mml:mspace><mml:mo>−</mml:mo><mml:mn>98</mml:mn><mml:mo>,</mml:mo><mml:mspace width="0.25em"></mml:mspace><mml:mn>18</mml:mn><mml:mo
stretchy="false">]</mml:mo></mml:math>[X,Y,Z]=[−14,−98,18]
. To ensure similar ROI size across participants, we kept the number of voxels in the ROI between 100 and 1,000. For individuals
whose stimulus and atlas intersection exceeded 1,000 voxels, a higher Z value by 0.5 points (<mml:math display="inline"><mml:mi>Z</mml:mi><mml:mo>=</mml:mo><mml:mn>3.6</mml:mn></mml:math>Z=3.6
; one participant) was used. For individuals with fewer than 100 intersection voxels, the average group cluster was used (three
participants).
BOLD activity during the task (TDT > fixation task) was extracted and averaged within each individual ROI. The activity in
an untrained ROI was extracted similarly (average MNI coordinate <mml:math display="inline"><mml:mo stretchy="false">[</mml:mo><mml:mrow><mml:mi>X</mml:mi><mml:mo>,</mml:mo><mml:mi>Y</mml:mi><mml:mo>,</mml:mo><mml:mrow><mml:mspace
width="0.25em"></mml:mspace></mml:mrow><mml:mi>Z</mml:mi></mml:mrow><mml:mo stretchy="false">]</mml:mo><mml:mo>=</mml:mo><mml:mo
stretchy="false">[</mml:mo><mml:mrow><mml:mn>4</mml:mn><mml:mo>,</mml:mo><mml:mo>−</mml:mo><mml:mn>82</mml:mn><mml:mo>,</mml:mo><mml:mo>−</mml:mo><mml:mn>2</mml:mn></mml:mrow><mml:mo
stretchy="false">]</mml:mo></mml:math>[X,Y,Z]=[4,−82,−2]
). Three-way repeated–measure ANOVA with session (post-training vs pre-training) and location (trained vs untrained) as within-subject
factor and group (Reactivation vs Repetitions) as between-subject factor was then conducted to evaluate the difference in
the early visual areas between the groups following training.
Resting-state functional connectivity
To examine differences in resting-state functional connectivity between the groups, the cortex was divided into 200 parcels based on Schaefer parcellation (Schaefer et al., 2018), where each region is associated with one of the seven brain networks functionally defined by Yeo et al. (2011). Preprocessed pre- and post-training resting–state fMRI time courses were averaged within each of the 200 cortical regions, resulting in a 2 × 200 × 240 matrix for each participant (two scans, 200 parcels, 240 time points; Fig. 3a). Pearson's correlations between all regions pairs were calculated for pre- and post-training scans per participant, resulting in a 2 × 200 × 200 correlation matrix per participant. Pearson's correlation values were then transformed into Fisher's Z values. The change in functional connectivity was calculated as (post-training > pre-training) Z values to produce a 200 × 200 matrix per participant. The changes in Fisher's Z matrices were averaged across all participants in each group.
As the matrices are symmetrical, we only used the lower triangle and further reduced the number of comparisons by applying a threshold of Z > 0.15. The remaining connections were subjected to a between-group repeated–measures ANOVA (FDR corrected for multiple comparisons). The analysis was performed on a volume representation of the brain, and results were then projected on a surface representation using Connectome Workbench 1.4.2 (Marcus et al., 2011).
A post hoc analysis within each group was then conducted to determine the origin of the interaction. Last, to evaluate the relation between the change in functional connectivity and behavioral performance, one-tailed Pearson's r coefficients between overall improvement and the functional connectivity change were calculated for each group.
Results
Behavioral results
Significant learning was observed following brief memory reactivations, resulting in improved visual discrimination thresholds (mean Session 1 to Session 5 learning of 31.46 ± 5.59 ms; F(1,19) = 31.65; p < 0.001; Fig. 2a). Reactivation-induced learning was comparable to repetition-based learning (33.23 ± 5.63 ms; F(1,19) = 34.85; p < 0.001), with no significant difference in total learning between the Reactivation (24.70 ± 4.14%) and the Repetition (25.41 ± 3.94%) groups [F(1,38) = 0.02; p = 0.90; BF01 = 3.22 ± 0.007 (Rouder et al., 2012; Johnson, 2013); Fig. 2a]. These results are consistent with previous studies (Amar-Halpert et al., 2017), providing further evidence that memory reactivations remarkably enhance perceptual learning efficiency by reducing practice duration.
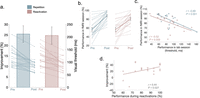
Improving the efficiency of perceptual learning by replacing repetition-based learning with brief memory reactivations. a, The mean improvement percentage (main bars, left Y axis) and individual visual thresholds pre- and post-training (thin lines, right Y axis), indicating that learning with brief reactivations of only five trials each (pink) is comparable with standard repetition-based learning (blue). b, Similar results are evident in the fMRI sessions. Mean (thick lines) and individual performance (thin lines) in the fMRI sessions pre- and post-training with repetition-based (blue) and reactivation-induced (pink) learning. c, Correlation between the final visual thresholds measured in the lab session and the percentage of correct responses in the fMRI session. d, Correlation between performance in reactivation trials and total improvement following reactivation-induced learning. Error bars represent SE.
Of note, similar results were evident in the fMRI task (Fig. 2b), demonstrating significant improvement in both Reactivation (27.08% ± 5.25%; F(1,18) = 33.06; p < 0.001) and Repetition (30.62% ± 3.76%; F(1,19) = 66.25; p < 0.001) groups, with no significant group × session interaction (F(1,37) = 1.63; p = 0.21; BF01 = 3.71 ± 4.47; Rouder et al., 2012; Johnson, 2013).
Furthermore, results showed a significant correlation between the final visual thresholds measured in the lab session and the percentage of correct responses in the fMRI session (Fig. 2c) in both Reactivation (Pearson's r = −0.52; p = 0.009) and Repetition groups (Pearson's r = −0.69; p < 0.001), confirming the reliability of the task measures.
Interestingly, there was a linear correlation between performance in reactivation trials and overall improvement following reactivation-induced learning (Pearson's r = 0.44; p = 0.027; Fig. 2d), which may be driven by participants with low performance during reactivations resulting in reduced learning magnitude. These results suggest that when a memory is reactivated, the accuracy of reactivation performance determines subsequent learning, consistent with previous research on memory reactivation in the motor domain (Herszage et al., 2021).
Brain activity
BOLD signal change was first contrasted for all participants pre-training (perceptual TDT vs fixation task). A whole-brain analysis showed that the perceptual task was associated with increased activity in motor-related regions at the precentral and postcentral gyri (mostly in the left hemisphere), the cerebellum, and the supplementary motor cortex, consistent with having to press two buttons for the perceptual task and one for the fixation task (see Materials and Methods). In addition, the perceptual task showed increased activity in regions associated with the attention and control networks (Yeo et al., 2011; Schaefer et al., 2018), including the superior parietal lobule, intraparietal sulcus (IPS), precuneus, middle frontal gyrus, paracingulate gyrus, and cingulate gyrus (Fig. 3a, Extended Data Table 3-1). Importantly, no pre-training differences were observed between the Reactivation and the Repetition groups.
Table 3-1
Positive significant clusters associated with performing the task pre-training. Coordinates are in MNI space. L, Left; R, Right; B, Bilateral. Download Table 3-1, DOCX file.

Brain activity. a, Perceptual task activity contrasted with the fixation task across all participants pre-training. Ventral and dorsal attention and control networks (Yeo et al., 2011; Schaefer et al., 2018) are marked in white, suggesting that regions within these networks are associated with perceptual task performance. b, Reactivation-induced learning is associated with increased activity in the bilateral IPS. In addition, results showed a negative prefrontal cluster associated with the default mode network, suggesting increased activity following repetition-based learning. Results suggest enhanced engagement of higher-order attention–related regions following reactivation-induced learning. See Extended Data Tables 3-1–3-3 for more details.
BOLD signal change following learning contrasted between the two groups (TDT > fixation task, post-training > pre-training, Reactivation > Repetition) showed that reactivation-induced learning was associated with increased activity in the bilateral IPS and left precuneus, within the control network (Schaefer et al., 2018; Fig. 3b; Extended Data Table 3-2). Additionally, a negative cluster in the prefrontal cortex, a region associated with the default mode network, suggests increased activity following repetition-based learning compared with reactivation-induced learning (Fig. 3b; Extended Data Table 3-3). An additional ROI analysis, focusing on the early visual area corresponding to the trained and untrained visual fields, showed no significant differences between the groups (session × location × group; F(1,38) = 0.21; p = 0.64) nor within each group (location × session; F(1,19) = 0.11; p = 0.75 Reactivation; F(1,19) = 1.4; p = 0.25 Repetition).
Table 3-2
Positive significant clusters associated with the difference between reactivation-induced learning and repetition-based learning following training (post > pre, Reactivation > Repetition). Coordinates are in MNI space. L, Left; R, Right. Download Table 3-2, DOCX file.
Table 3-3
Negative significant clusters associated with the difference between reactivation-induced learning and repetition-based learning following training (post > pre, Reactivation > Repetition). Coordinates are in MNI space. L, Left; R, Right. Download Table 3-3, DOCX file.
Resting-state functional connectivity
To evaluate resting-state functional connectivity (post-training > pre-training, Reactivation > Repetition), the Schaefer et al. (2018) parcellation was used, showing a significant interaction in functional connectivity between the left inferior parietal lobule
(IPL) and the left middle and inferior temporal gyri (MTG and ITG; <mml:math display="inline"><mml:mi>p</mml:mi><mml:mo>=</mml:mo><mml:mn>0.016</mml:mn></mml:math>p=0.016
, FDR corrected; Fig. 4b). A post hoc analysis revealed a decrease in functional connectivity between these regions following repetition-based learning
(mean pre- to post-learning change of Fisher's <mml:math display="inline"><mml:mi>Z</mml:mi><mml:mo>=</mml:mo><mml:mo>−</mml:mo><mml:mn>0.21</mml:mn><mml:mo>±</mml:mo><mml:mn>0.04</mml:mn></mml:math>Z=−0.21±0.04
), but not reactivation-induced learning (Fisher's <mml:math display="inline"><mml:mi>Z</mml:mi><mml:mo>=</mml:mo><mml:mn>0.09</mml:mn><mml:mo>±</mml:mo><mml:mn>0.05</mml:mn></mml:math>Z=0.09±0.05
). This reduction in connectivity was correlated with the Repetition group's behavioral improvement (Pearson's <mml:math display="inline"><mml:mi>r</mml:mi><mml:mo>=</mml:mo><mml:mo>−</mml:mo><mml:mn>0.467</mml:mn></mml:math>r=−0.467
; <mml:math display="inline"><mml:mi>p</mml:mi><mml:mo>=</mml:mo><mml:mn>0.019</mml:mn></mml:math>p=0.019
; Fig. 4c), with participants showing low learning gains, consistently having less changes in connectivity. No correlation was observed
in the Reactivation group (Pearson's <mml:math display="inline"><mml:mi>r</mml:mi><mml:mo>=</mml:mo><mml:mn>0.20</mml:mn></mml:math>r=0.20
; <mml:math display="inline"><mml:mi>p</mml:mi><mml:mo>=</mml:mo><mml:mn>0.20</mml:mn></mml:math>p=0.20
). A confirmatory analysis showed no baseline differences between the Reactivation (Fisher's Z = 0.92 ± 0.06) and Repetition groups (Fisher's <mml:math display="inline"><mml:mi>Z</mml:mi><mml:mo>=</mml:mo><mml:mn>0.94</mml:mn><mml:mo>±</mml:mo><mml:mn>0.05</mml:mn></mml:math>Z=0.94±0.05
; <mml:math display="inline"><mml:msub><mml:mi>t</mml:mi><mml:mrow><mml:mn>1</mml:mn><mml:mo>,</mml:mo><mml:mn>38</mml:mn></mml:mrow></mml:msub><mml:mo>=</mml:mo><mml:mn>0.24</mml:mn></mml:math>t1,38=0.24
; <mml:math display="inline"><mml:mi>p</mml:mi><mml:mo>=</mml:mo><mml:mn>0.81</mml:mn></mml:math>p=0.81
) functional connectivity.
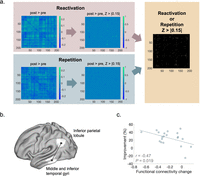
Resting-state functional connectivity. a, Functional connectivity analysis. Left matrices show the change following learning (Fisher's Z values, post-training > pre-training) in Reactivation (pink) and Repetition (blue) groups between all 200 cortical parcels (Schaefer et al., 2018). The matrices in the middle show only connections that exhibit remarkable change (Z > |0.15|) within each group following training. These connections are also presented in a unified matrix on the right. Between-group differences were then evaluated with an FDR correction for multiple comparisons. b, A significant interaction in functional connectivity between the left IPL and the left MTG and ITG suggests reduced functional connectivity following repetitions, but not reactivation. c, The reduction in functional connectivity following repetition-based learning was correlated with perceptual improvement.
Discussion
The current study demonstrates that improving the efficiency of perceptual learning by replacing repetition-based learning with brief memory reactivations resulting in comparable learning engages distinct neural mechanisms. Results showed higher activity in the bilateral IPS and the left precuneus and lower activity in the prefrontal cortex following reactivation-induced compared with repetition-based learning. Moreover, resting-state functional connectivity between the left IPL and the left MTG and ITG was reduced following repetitions, but not reactivations. This reduction in connectivity was correlated with behavioral improvement in the Repetition group, possibly providing complementary task-free evidence for differential learning processes. The results suggest that improving the efficiency of repetition-based learning with memory reactivations leading to similar behavioral gains recruits distinct neural processes by engaging higher-order control and attentional resources.
Improving perceptual skills commonly demands extensive, repetition-based practice. The results of this study suggest that brief reactivations of a consolidated memory are sufficient to improve visual perception, possibly through reactivation–reconsolidation cycles of memory modulation (Nader et al., 2000b; Dudai, 2012; Bang et al., 2018). Interestingly, performance in the reactivation trials was correlated with overall improvement, suggesting that when a memory is reactivated, the accuracy of reactivation performance determines subsequent learning, in line with previous studies (Herszage et al., 2021). Of note, an effective initial encoding session with multiple trials is important for subsequent reactivation-induced learning (Amar-Halpert et al., 2017). This implies that the memory should be first consolidated in order for the subsequent reactivation trials to be effective. The final session, however, is dedicated only to measuring the final visual threshold. Accordingly, it was conducted after the post-training fMRI session in the current study.
Consistent with previous procedural learning research (Walker et al., 2003; Amar-Halpert et al., 2017; Bang et al., 2018; Herszage et al., 2021), the overall findings here indicate enhanced learning efficiency achieved by remarkably reducing practice duration, engaging distinct brain mechanisms. Greater activity in the bilateral IPS was observed following reactivations compared with repetitions. The IPS is part of the frontoparietal cognitive control system, which supports attentional control and decision-making processes by integrating information from the external environment with stored internal representations (Woldorff et al., 2004; Vincent et al., 2008). Changes in the IPS have been previously documented following repetition-based perceptual learning. Mukai et al. (2007) showed decreased activation in the IPS among learners (participants showing improvement in a task) compared with that among nonlearners following training. Consistently, Lewis et al. (2009) showed weaker IPS activity in trained versus untrained learning conditions. These results imply that the IPS plays a role in performing the task primarily during the early stages of perceptual learning, with reduced activity as learning progresses. Contrary to repetition-based learning, the results of the current study show that reactivation-induced learning is associated with higher IPS activity following learning, suggesting enhanced engagement of attention and control resources in the learning process beyond the early learning stages. The results here may also be consistent with a previous study showing that the IPS is associated with improvements in processing the trained task (task-based plasticity), rather than representations of the trained features (feature-based plasticity; Shibata et al., 2014, 2016), and may suggest that reactivation-induced learning, which dramatically reduces exposures to the target feature, is mediated predominantly through task-based plasticity. While feature-based plasticity is often exhibited following repeated exposure and can be induced even when participants are passively exposed to features when performing an unrelated task, task-based plasticity is commonly restricted to performance with the explicitly trained task (Shibata et al., 2016). Therefore, we expect that reactivations would be less effective when training involves passive exposure to visual features while focusing on an unrelated task.
Increased engagement of higher-order attention and control-related regions may carry potential implications for increasing learning generalization (Klorfeld-Auslender et al., 2022). Perceptual learning is often characterized by strong specificity to the trained stimulus features, limiting learning generalization efficiency (Schoups et al., 1995; Crist et al., 1997; Fahle, 1997; Schwartz et al., 2002; Watanabe et al., 2002; Saffell and Matthews, 2003; Yu et al., 2004). As perceptual learning generalization is typically associated with higher-order brain regions, it is conceivable that reactivation-induced learning would promote learning generalization through the enhanced engagement of these regions observed here. Future studies may be designed to further examine this prediction.
The precuneus also exhibited greater activity following reactivation-induced learning compared with that following repetition learning. Unlike the IPS, the precuneus has been rarely mentioned in perceptual learning studies. However, it is known for participating in various functions including recalling, especially in episodic memory studies (Lundstrom et al., 2005; Cavanna and Trimble, 2006; Trimble and Cavanna, 2008; Dörfel et al., 2009). Considering this notion, it is possible that the precuneus was activated as a result of the reactivation–reconsolidation memory process mentioned above. In light of this possibility, it would be highly interesting to investigate reactivation-induced learning in other modalities and skills and identify whether global memory-recall processes are involved.
Lower activity following reactivation-induced learning compared with repetition-based practice was observed in the left prefrontal cortex. While the prefrontal cortex has been previously associated with perceptual learning, the commonly mentioned regions are the dorsolateral or medial prefrontal cortex (Sasaki et al., 2010; Kahnt et al., 2011; Watanabe and Sasaki, 2015; Jing et al., 2021). Notably, the region in the prefrontal cortex here is more rostral, associated with the default mode network, which is typically activated when no attention-demanding task or goal-directed behavior is performed (Raichle, 2015; Schaefer et al., 2018). Consistent with the finding described above, the results may suggest that following reactivation-induced learning, the perceptual task demands more cognitive resources, possibly through top–down attention control processes (Byers and Serences, 2012), compared with repetition-based learning, where it is performed and learned more implicitly after training. These findings may imply different performance when the task is performed under high cognitive load or as part of a dual task. Specifically, under increased cognitive load, we would predict greater impairment in performance in reactivation-induced learning compared with repetitions, due to its enhanced dependency on attentional resources. If true, this may constitute a trade-off associated with the significant efficiency of reactivation-induced learning. This invites further examination in future experiments.
A decrease in functional connectivity between the IPL and MTG and ITG was observed following repetition-based learning, but not reactivation-induced learning. Consistently, this reduction was correlated with repetition-based learning behavior. The IPL is associated with the acquisition of a perceptual task but becomes less active when the learner is well trained (Walsh et al., 1998). The ITG is associated with the representation of perceptual stimuli in memory (Miyashita, 1993; Adab et al., 2014). Therefore, these findings may provide complementary task-free evidence for differential reactivation–repetition learning processes.
An additional ROI analysis, focusing on the early visual area corresponding to the trained and untrained visual fields, showed no significant differences between the groups nor within each group. While the similarity between groups may be consistent with the behavioral results, changes in early visual areas following repetition-based perceptual learning were previously documented (Schwartz et al., 2002; Mukai et al., 2007; Lewis et al., 2009; Depeursinge et al., 2010; Huang, 2016). However, Yotsumoto et al. (2008) documented that these changes show temporal dynamics so that increased activity observed early after training later decreases back to pre-training levels, while the perceptual gains persist, possibly corresponding to synaptic renormalization processes (Tononi and Cirelli, 2006; Yotsumoto et al., 2008; although timescales vary across studies). Such mechanisms may correspond with changes in readout, including channel reweighting, also proposed to explain perceptual learning (Dosher and Lu, 1998; Censor and Sagi, 2009; Dosher et al., 2013).
Together, the results show that improving the efficiency of perceptual learning by replacing prolonged repetitive training with brief memory reactivations is mediated by distinct neural mechanisms, which may enhance the engagement of higher-order cognitive resources. Improving learning efficiency and mapping the associated brain mechanisms may carry important implications for daily life and in clinical conditions requiring relearning following brain damage (Censor et al., 2016a).
Footnotes
- Received February 14, 2024.
- Revision received April 10, 2024.
- Accepted June 4, 2024.
-
The study was supported by the European Research Council (ERC-2019-COG 866093). T.K. is a fellow of the Ariane de Rothschild Women Doctoral Program.
-
The authors declare no competing interests.
- Correspondence should be addressed to Nitzan Censor at censornitzan{at}tauex.tau.ac.il.
- Copyright © 2024 the authors




