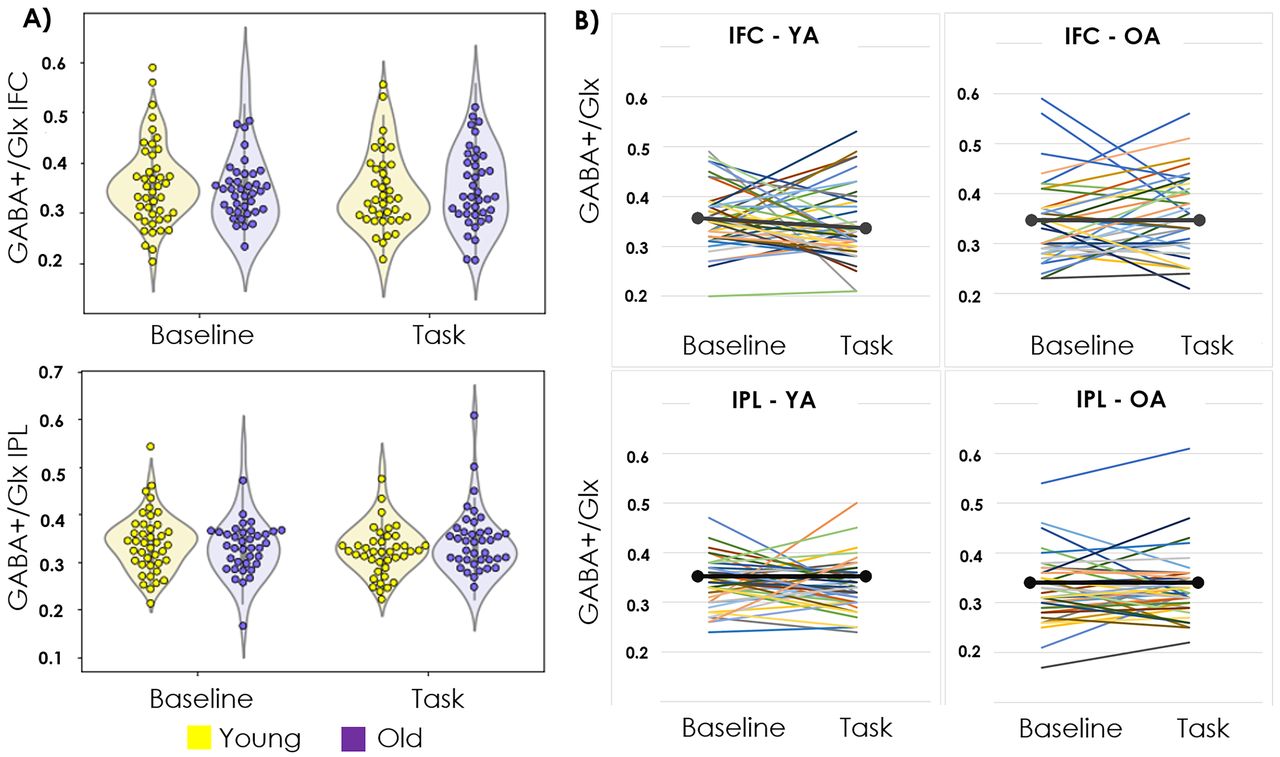
A, GABA+/Glx levels in IFC (top) and in IPL (bottom) for young (yellow) and older (purple) participants during baseline and task performance. The differences according to the age group, condition, or their interaction were not significant (IFC, group, F = 0.02; p = 0.89; η2 < 0.001; condition, F = 1.02; p = 0.32; η2 < 0.001; interaction, F = 1.9; p = 0.16; η2 < 0.02; IPL, group, F = 0.31; p = 0.58; η2 = 003; condition, F = 0.21; p = 0.64; η2 < 0.001; interaction, F = 0.16; p = 0.68; η2 = 0.02). B, Individual modulation (change from the baseline to task performance) in IFC (top) and IPL (bottom) for younger (left) and older (right) adults. Horizontal black lines indicate the mean value.


