The Hippocampus Represents Information about Movements in Their Temporal Position in a Learned Motor Sequence
- Nina Dolfen1,2,3,
- Serena Reverberi1,2,
- Hans Op de Beeck2,4,
- Bradley R. King5, and
- Genevieve Albouy1,2,5
- 1Department of Movement Sciences, KU Leuven, 3001 Leuven, Flemish Brabant, Belgium
- 2KU Leuven Brain Institute (LBI), 3000 Leuven, Flemish Brabant, Belgium
- 3Department of Psychology, Columbia University, New York City, New York 10027
- 4Department of Brain and Cognition, KU Leuven, 3000 Leuven, Flemish Brabant, Belgium
- 5Department of Health and Kinesiology, College of Health, University of Utah, Salt Lake City, Utah 84112
-
Author contributions: N.D., H.O., B.R.K., and G.A. designed research; N.D., S.R., and G.A. performed research; N.D., H.O., B.R.K., and G.A. contributed unpublished reagents/analytic tools; N.D. and G.A. analyzed data; N.D. and G.A. wrote the paper.
Abstract
Our repertoire of motor skills is filled with sequential movements that need to be performed in a specific order. Here, we used functional magnetic resonance imaging to investigate whether the human hippocampus, a region known to support temporal order in non-motor memory, represents information about the order of sequential motor actions in human participants (both sexes). We also examined such representations in other regions of the motor network (i.e., the premotor cortex, supplementary motor area, anterior superior parietal lobule, and striatum) already known for their critical role in motor sequence learning. Results showed that the hippocampus represents information about movements in their learned temporal position in the sequence, but not about movements or temporal positions in random movement patterns. Other regions of the motor network coded for movements in their learned temporal position, as well as movements and positions in random movement patterns. Importantly, movement coding contributed to sequence learning patterns in primary, supplementary, and premotor cortices but not in striatal and parietal regions. Our findings deepen our understanding of how striatal and cortical regions contribute to motor sequence learning and point to the capacity of the hippocampus to represent movements in their temporal context, an ability possibly explaining its contribution to motor learning.
Significance Statement
Consistent evidence collected over the last two decades indicates that the hippocampus—a brain structure traditionally associated with declarative memory—is critically involved in motor memory. Yet, the functional role and representational contribution of the hippocampus to motor learning remains to be elucidated. Using a multivariate functional magnetic resonance imaging approach, we show here that the hippocampus carries information about the temporal order of movements in a motor sequence. These results point toward the involvement of the hippocampus in preserving information about temporal order in motor memory—a process well described for declarative memories. We suggest that the ability of the hippocampus to encode temporal order during sequence learning is common across declarative and non-declarative memory systems.
Introduction
The role of the hippocampus (HC) in motor sequence learning is unclear. Neuropsychological studies have shown that motor sequence learning is intact in patients with hippocampal damage, irrespective of whether learning is implicit (Nissen and Bullemer, 1987; Nissen et al., 1989; Reber and Squire, 1994; Curran, 1997) or explicit (Döhring et al., 2017; Schapiro et al., 2019) in nature. These results suggest that the HC is not necessary to learn new motor sequences. Yet, research also indicates that while motor sequence learning is intact in these patients, the motor memory consolidation process is impaired (Schapiro et al., 2019; van Schalkwijk et al., 2021; Okadome et al., 2022). Together with extensive neuroimaging evidence in healthy young individuals showing that the HC (1) is recruited during motor sequence learning (Schendan et al., 2003; Albouy et al., 2008; Fernández-Seara et al., 2009; Pinsard et al., 2019; Jacobacci et al., 2020) and (2) predicts subsequent motor memory retention (Albouy et al., 2013a, 2015), these findings suggest that the HC plays a role in motor memory. Importantly, what the role of the HC is in motor sequence memory remains unclear.
In contrast to the numerous studies characterizing the role of the HC in processing sequential information in non-motor memory (Davachi and DuBrow, 2015), only one set of data directly examined the role of the HC in motor sequence learning (Albouy et al., 2015; King et al., 2022). In line with behavioral evidence that motor sequences are represented at different levels of the motor hierarchy (Keele et al., 1995; Hikosaka et al., 1999), these prior investigations showed that hippocampal activity supports the development of a spatial, or abstract (Grafton et al., 2002), representation of the motor sequence (Albouy et al., 2013b, 2015). In contrast to the motoric representation that contains information about the motor commands to be executed, the hippocampo-mediated spatial representation is proposed to be effector-independent and to represent the goal of the series of movements irrespective of the fingers used to execute the sequence (e.g., that would allow to play the same melody on the piano with different finger movements; Albouy et al., 2013b, 2015). Importantly, in the non-motor memory domain, the HC is known to play a key role in representing and preserving the temporal order of sequential information (Davachi and DuBrow, 2015). Neuroimaging studies revealed that multivoxel patterns of activation in the HC contain information about the order of episodic events (Ezzyat and Davachi, 2014) as well as items in learned sequences (Kalm et al., 2013; Hsieh et al., 2014). Such hippocampal patterns have also been found to predict subsequent memory of the temporal order of the learned items (DuBrow and Davachi, 2014; Ezzyat and Davachi, 2014). Given that the successful execution of motor sequences requires information about the order of movements in the sequence and that the HC carries temporal order information in other memory domains (Davachi and DuBrow, 2015), we used functional magnetic resonance imaging (fMRI) to investigate whether the HC represents information about the temporal order of movements in learned motor sequences, an ability that might explain its contribution to motor memory.
In brief, participants learned a sequence of eight finger movements. Immediately following learning, participants were scanned while practicing the learned sequence as well as random movement patterns using the same fingers but pressed in a random order. Given the specific role of the HC in preserving order in other memory domains (Davachi and DuBrow, 2015) and based on evidence that the HC plays a role in motor sequence memory (Albouy et al., 2013b), we predicted that hippocampal activation patterns would carry information about finger movements in their learned temporal position in the sequence (finger + position coding) but not about finger movements or temporal positions alone. We also examined such coding in other regions of the motor network that have recently been implicated in the encoding of sequence order during motor sequence learning (Yokoi and Diedrichsen, 2019; Berlot et al., 2020).
Material and Methods
Participants
The study was approved by the Medical Ethics Committee of the University Hospital Leuven (B322201525025). Thirty-five healthy, young (mean age, 23.4 years; range, 19–29 years; 20 females) adults were recruited to participate in the study. All participants provided written informed consent at the start of the study. All participants were right-handed (Edinburgh Handedness Questionnaire; Oldfield, 1971). They did not report any current or previous neurological or psychiatric diseases and were free of medications. None of the participants were musicians or professional typists. Based on standardized questionnaires, participants exhibited no indication of anxiety (Beck Anxiety Inventory; Beck et al., 1988) or depression (Beck Depression Inventory; Beck et al., 1961). All participants reported normal sleep quality and quantity during the month prior to the study, as evaluated with the Pittsburgh Sleep Quality Index (Buysse et al., 1989). Sleep quality of the night preceding the experimental session was assessed with the St. Mary’s sleep questionnaire (Ellis et al., 1981). Two participants were excluded from further analyses: one due to brain abnormality, and in one participant, the fMRI session was aborted prior to completion due to severe anxiety during scanning. A total of 33 participants (19 females) were considered for the analyses (see Table 1 for participant characteristics). Note that data of one fMRI run for one participant and data of the retention test for another participant are missing.
Participant characteristics
General experimental procedure
Participants were instructed to respect a regular sleep/wake schedule (according to their own schedule ± 1 h) starting 3 d before the experimental session. Compliance to this schedule was assessed using sleep diaries. Consumption of alcohol, nicotine, and caffeine (and other vigilance-altering substances) was prohibited the day before as well as the day of the experimental session. As illustrated in Figure 1A, participants completed a (1) learning, (2) fMRI, and (3) retention session during which they performed different versions of an explicit serial reaction time task (SRTT; see details below and Fig. 1B). After baseline assessment of motor performance using a random SRTT, participants were trained on a sequential SRTT during which they learned a sequence of eight finger movements through repeated practice (learning session; duration, 60 min.; Fig. 1A). Immediately following the learning phase, participants were placed in the MRI scanner where they performed the pretrained sequential SRTT, as well as a random SRTT (fMRI session; duration, 60 min; Fig. 1A). Lastly, immediately after the fMRI session, all participants completed a retention test outside the scanner (retention; duration, 10 min; Fig. 1A).
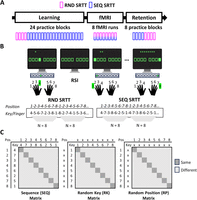
A, General procedure. All participants completed a learning, fMRI, and retention session during which they performed a SRTT (see panel B). Depending on the task condition, cues in the SRTT followed a random (RND) or repeating, sequential (SEQ) pattern. During the learning and retention sessions, the task took place outside the scanner and was organized in blocks of practice. During the fMRI session, data were acquired over eight consecutive scanning runs during which RND and SEQ SRTT conditions randomly alternated. B, Task. During the SRTT, participants were instructed to press as quickly and accurately as possible the key corresponding to the location of a cue (green filled square; response to stimulus interval; RSI, 1.5–2.5 s; average 2 s). The repeating pattern in the SEQ SRTT consisted of eight key presses (4-7-3-8-6-2-5-1, with 1 and 8 corresponding to the little fingers of the left and right hand, respectively), and in this pattern, each finger was used once. In the RND SRTT, there was no fixed pattern, but each key was pressed once every eight key presses. During both the RND and SEQ SRTT, the serial position of a key press in a stream of eight key presses was indicated by green asterisks on top of the screen. C, Structure of neural similarity matrices. Pattern similarity was computed across repetitions of the motor sequence to assess finger-position coding in the sequence (SEQ matrix) as well as across repetitions of the random patterns to quantify coding of individual finger movements/key presses irrespective of position (RK matrix) and positions irrespective of movements (RP matrix) in random movement patterns. Pairs of movements sharing a particular type of information (same finger + position in the SEQ matrix, same finger in the RK matrix, or same position in the RP matrix) are represented on the diagonal of each matrix.
SRTT and behavioral measures
We used an explicit bimanual SRTT that was implemented in Psychophysics Toolbox (Kleiner et al., 2007). During the task, eight squares were presented on the screen, each corresponding to one of the eight keys on the keyboard and one of the eight fingers (no thumbs; Fig. 1B). The outline of the squares alternated between red and green, indicating rest and practice, respectively. During rest, participants were instructed to keep their eyes focused on the screen and their fingers still on the keyboard (duration, 10 s). During practice, the outline of the squares turned green, and participants were instructed to press as quickly and accurately as possible the key corresponding to the location of a cue (green filled square) that appeared on the screen. After a response, the next cue appeared (jittered response to stimulus interval; range, 1.5–2.5 s; average, 2 s). Depending on the task condition, the cues either followed a pseudorandom (RND SRTT; motor control task) or a fixed, repeating sequential pattern (SEQ SRTT; motor sequence learning task). In the SEQ condition, participants repeatedly practiced a predetermined sequence of eight key presses in which each finger had to be pressed once (4-7-3-8-6-2-5-1, with 1 and 8 corresponding to the little fingers of the left and right hand, respectively). All participants were trained on the same sequence of movements. However, to optimize the fMRI multivariate pattern analysis (see below), the starting point of the sequence was counterbalanced across participants such that the same key was not associated with the same temporal position in a sequence across individuals (i.e., the sequence started with 4 in Participant 1, with 7 in Participant 2, etc.). In the RND task condition, there was no repeating sequence, but each finger had to be pressed once every eight key presses. During practice of both the random and sequential SRTT, the serial position of a key press in a stream of eight key presses was indicated by a green asterisk on top of the screen (Fig. 1B). These asterisks were replaced by eight red asterisks at rest.
At the beginning of the study, participants were informed that the cues could either follow a random or a repeating sequential pattern. During learning and retention, task practice took place outside the scanner, on a computer keyboard sitting at a desk, and was organized in blocks consisting of 48 keypresses each (which corresponded to six repetitions of the fixed sequence or six consecutive pseudorandom series of eight key presses), alternated with 10 s rest periods (block design). During the learning session, participants completed four blocks of RND practice, followed by 20 blocks of SEQ practice. The retention test took place immediately after the fMRI session described below and consisted of four SEQ blocks followed by four RND blocks. During the fMRI session, the task was performed on an MRI-compatible keyboard. Brain and behavioral data were acquired over eight consecutive scanning runs. Each fMRI run included six repetitions of the learned sequence (SEQ condition) and six pseudorandom series of eight key presses (RND condition; 6 repetitions × 2 conditions × 8 keypresses = 96 key presses/run). Repetitions of the learned sequence were randomly alternated with random patterns with the rule that a specific condition was not presented more than two times in a row. Half of the runs started with the SEQ condition and the other half with the RND condition. In addition, three 10 s rest periods were randomly inserted within each run. For each block (learning and retention sessions) and run (fMRI session), performance speed and accuracy were computed for each condition as the mean response time for correct responses (in seconds) and the percentage of correct responses, respectively.
Statistical analyses of behavioral data
To investigate behavioral changes during the learning session, for each task, a one-way repeated-measure (RM) ANOVA with block (4 for random, 20 for sequence) as within-subject factor was performed on both speed and accuracy measures. Behavioral changes in speed and accuracy during both the fMRI and retention sessions were examined with a condition (2, sequence vs random) by block (8 or 4) RM ANOVA. In case of violation of the sphericity assumption, Greenhouse–Geisser corrections were applied.
fMRI data acquisition
Images were acquired with a Philips Achieva 3.0 T MRI System and a 32-channel head coil. During the task, BOLD signal was acquired with a T2* gradient echo-planar sequence using axial slice orientation that covers the whole brain (TR, 2,000 ms; TE, 30 ms; FA, 90°; 54 transverse slices; 2.5 mm slice thickness; 0.2 mm interslice gap; FoV, 210 × 210 mm2; matrix size, 84 × 82 × 54 slices; voxel size, 2.5 × 2.56 × 2.5 mm3). A structural T1-weighted 3D MP-RAGE sequence (TR, 9.5 ms; TE, 4.6 ms; TI, 858.1 ms; FA, 9°; 160 slices; FoV, 250 × 250 mm2; matrix size, 256 × 256 × 160; voxel size, 0.98 × 0.98 × 1.20 mm3) was also obtained for each participant.
fMRI data analysis
Statistical parametric mapping (SPM12; Wellcome Department of Imaging Neuroscience) was used for preprocessing of functional images and statistical analyses of BOLD data. Representational similarity analyses (RSA) were performed using the CoSMoMVPA toolbox (Plis et al., 2016).
Preprocessing
Preprocessing included slice time correction, realignment of functional time series, coregistration of the preprocessed functional images to the structural T1-image, and segmentation of the anatomical image. All the analyses were performed in native space.
Regions of interest
The following (bilateral) regions of interest (ROIs) were selected a priori based on previous literature describing their critical involvement in motor sequence learning (Doyon et al., 2003; Albouy et al., 2013b; Berlot et al., 2020): the primary motor cortex (M1), the premotor cortex (PMC), supplementary motor area (SMA), anterior superior parietal lobule (aSPL), HC, putamen, and caudate nucleus (Fig. 2). Cortical ROIs were defined bilaterally in MNI space and next mapped back to native space using the individual's inverse deformation field output from the segmentation of the anatomical image. Using the Brainnetome Atlas (Fan et al., 2016), M1 was defined to exclude mouth and leg representations and contained the upper limb and hand function regions of Brodmann area (BA) 4. Using the same atlas, the PMC was defined as the dorsal (A6cdl; dorsal PMC) and ventral (A6cvl; ventral PMC) part of BA 6. aSPL was defined to include anterior, medial, and ventral intraparietal sulcus of the Julich Brain Atlas (Amunts et al., 2020). Lastly, the anatomical mask for the SMA was extracted from the Human Motor Area Template (HMAT; Mayka et al., 2006). Subcortical ROIs were anatomically defined in native space using FSL's automated subcortical segmentation protocol (FIRST; FMRIB Software Library, Oxford Centre for fMRI of the Brain). All ROIs were masked to exclude voxels outside of the brain and with <10% gray matter probability and registered to the functional volumes. The number of voxels within an ROI ranged from 536 to 1,700 voxels (M1, mean, 1,467; range, 1,200–1,722; PMC, mean, 1,255; range, 992–1,486; SMA, mean, 1,114,1; range, 912–1,375; aSPL, mean, 707.9; range, 536–402; HC, mean, 852.9; range, 620–1,028; caudate, mean, 995.2; range, 722–1,170; putamen, mean, 785.7; range, 581–952).
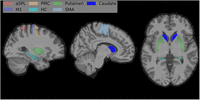
Seven bilateral ROIs were defined (see Materials and Methods). The HC, putamen and caudate were defined using FSL's automated subcortical segmentation protocol (FIRST). M1 and PMC were extracted from the Brainnetome Atlas (Fan et al., 2016), while aSPL and SMA were defined based on the Julich Brain Atlas (Amunts et al., 2020) and the HMAT (Mayka et al., 2006), respectively.
RSA
RSA were designed to investigate coding of information (1) about finger movements in their learned temporal position in the sequence (referred to as finger + position coding), (2) about temporal positions irrespective of the associated finger movement (referred to as position coding), and (3) about finger movements irrespective of the associated temporal position (referred to as finger coding). As finger movements are performed in a fixed order in the sequence condition (i.e., each movement is bound to a specific temporal position), sequential SRTT data were used to identify ROIs coding for finger + position in the sequence. As the finger-position assignment is not fixed in the random condition, random SRTT data were used to identify ROIs coding for position (irrespective of finger movement) and finger movement (irrespective of their temporal position in the pattern). For the RSA, two separate GLMs were fitted to the preprocessed functional data in each subject's native space. Depending on the GLM, events of interest were grouped according to temporal position or finger movement. The first GLM (i.e., position GLM) included one regressor per temporal position (eight positions per movement pattern), separately for each condition (8 positions × 2 conditions = 16 regressors per run). The second GLM (i.e., key GLM) included one regressor for each finger movement or key (fingers or keys 1 to 8; Fig. 1B), separately for each condition (8 keys × 2 conditions = 16 regressors per run). Within each regressor, events of interest (six events per regressor per run) were modeled with delta functions (0 ms duration) time locked to cue onsets. In both GLMs, key presses during rest and movement parameters (derived from realignment of the functional volumes) were modeled and entered as regressors of no interest. High-pass filtering with a cutoff period of 128 s served to remove low-frequency drifts from the time series. An autoregressive (Order 1) plus white noise model and a restricted maximum likelihood algorithm were used to estimate serial correlations in the fMRI signal. These GLMs generated separate maps of t values for each regressor in each run. This allowed the extraction of one vector of t values (containing one value per voxel) per regressor, run, and ROI for each individual. For each voxel within each ROI, t values were normalized by subtracting the mean t value across all regressors (vectors) for each run separately. Note that because the order of key presses changed with every new repetition in the RND condition, an individual key press could either be classified according to its temporal position in the random pattern or according to the finger movement that was made. Accordingly, for the random condition, the same events could not be modeled within the same GLM. In the SEQ condition, the same events were modeled in the position and key GLMs. As GLMs 1 and 2 included identical regressors for the SEQ condition, corresponding vectors were averaged. Next, neural pattern similarity matrices were created per ROI to test the representation of the different types of information: (1) finger + position coding in the SEQ condition, (2) finger, and (3) position coding in the RND condition. To do so, the full dataset (eight runs) was randomly divided into two independent subsets (four runs each), and vectors of t values associated with the same finger + position, finger, or position were averaged across runs within a subset. Then, for each type of information and separately for each ROI, the eight resulting vectors of t values were correlated between subsets, and correlations were organized in a 8 × 8 neural pattern similarity matrix. Neural pattern similarity was estimated using Pearson's correlation because we were primarily interested in whether the same information shows similarity in its neural representation rather than in the distance between neural representations of different types of information. The procedure was repeated 140 times (i.e., 2 conditions × 70 possible combinations when choosing 4 numbers out of 8). Neural similarity matrices were averaged across the 140 iterations, leading to three average neural similarity matrices per ROI and subject (see Fig. 1C for the structure of each matrix). The sequence (SEQ) matrix represents pattern similarity between finger + position templates and was used to examine brain patterns coding for the association between finger and position in the SEQ condition. The random position (RP) matrix represents pattern similarity between position templates and was designed to examine coding for temporal position irrespective of finger movement in the RND condition. The random key (RK) matrix was built by computing pattern similarity between finger movement templates in the RND condition and was used to highlight coding of finger movements irrespective of their temporal position.
We ran one variant on this pipeline as control analysis to assess the effect of performance speed in the sequence condition on the representational content of the ROIs. More specifically, we subdivided trials in the sequence condition according to their speed (SEQ FAST vs SEQ SLOW) using a standard median split (see Extended Data Fig. 3-1 for behavioral results of the fMRI session showing the average speed in SEQ slow and SEQ fast conditions). Note that to maintain the balanced distribution of finger movements within each run, the median split was performed separately for each key. We then ran RSA separately for fast and slow trials in the SEQ condition, resulting in two additional neural similarity matrices (i.e., one for the slow and one for the fast trials). The RSA pipeline was identical to the one described above with the following exceptions. Four new GLMs (i.e., FAST position GLM, FAST key GLM, SLOW position GLM, SLOW key GLM) were estimated, and these GLMs only included three events per regressor per run for the sequence condition (i.e., either the three slowest or the three fastest trials per key) instead of six in the original analysis. In all GLMs, “excluded” trials in the sequence condition (i.e., “fast” key presses in the SLOW GLMs or “slow” key presses in the FAST GLMs) and key presses during rest and movement parameters (derived from realignment of the functional volumes) were modeled and entered as regressors of no interest.
Statistical analyses
All correlations in the neural similarity matrices were Fisher-transformed before entering statistical analyses. To investigate whether a given area coded for a particular type of information, for each matrix, a (one-tailed) paired sample t test was performed across participants to compare diagonal versus non-diagonal mean similarity. One-tailed t tests were used because we specifically expected that if a region codes for finger + position, finger, or position, the mean pattern similarity on the diagonal would be significantly higher than the off-diagonal. As an exploratory follow-up analysis on the RK matrix, we assessed whether certain ROIs showed higher similarity between different fingers belonging to the same as compared with different hands, which would correspond to a pattern consistent with hand coding. To do so, we compared for each ROI the mean correlation in the within-hand (upper left and lower right) and between-hand (lower left and upper right) quadrants of the RK matrix while excluding cells on the primary and secondary diagonal of the matrix. To examine whether there was key beyond hand coding within the same hand, we compared the diagonal mean similarity with non-diagonal mean similarity while excluding the between-hand quadrants.
To assess regional coding specificity within each ROI, two separate RM ANOVAs were used to compare delta similarity (i.e., mean pattern similarity diagonal minus off-diagonal) between matrices (i.e., SEQ, RP, and RK; results reported in the main text). Additionally, for each ROI, forward stepwise linear regressions were used to identify whether finger and/or position coding (as assessed during random practice) can explain pattern similarity effects in the sequence condition (outcome, delta similarity in the SEQ matrix; predictors, delta similarity in the RK and RP matrices). Predictors were added to the model based on their contribution to the model's explained variance, and an F test was used to assess whether the change in explained variance (i.e., R2 change; ΔR2) from the prior step was significant. If the final model obtained with the stepwise regression excluded one out of two predictors, the excluded independent variable was tested individually.
To assess lag-dependent effects in the SEQ matrices, we averaged pattern similarity across cells on the off-diagonal as a function of the lag between movements in the learned sequence (i.e., lag 1 = average of pattern similarity between movements that are 1 position apart in the learned sequence, etc.) and ran for each ROI a RM ANOVA on pattern similarity with lag as within-subject factor (i.e., factor with eight levels, lag 0 to lag 7). To mirror the main analyses, we also tested (1) whether there were lag-dependent effects in the RP and/or RK matrices and (2) whether these off-diagonal patterns were predictive of the off-diagonal patterns in the SEQ matrices. For the learned sequence 4-7-3-8-6-2-5-1, lag 1 in the RK matrix consisted in the averaged similarity for finger pairs 4-7, 7-3, 8-6, 6-2, 2-5, 5-1, while lag 1 in the RP matrix consisted in the average similarity for position pairs 1-2, 2-3, 3-4, 4-5, 5-6, 6-7, 7-8, etc. To test whether the lag patterns observed in the RK and RP matrices were predictive of the lag patterns in the SEQ matrix, for each ROI, we correlated the SEQ and RK matrices as well as the SEQ and RP matrices (using only non-diagonal cells averaged across upper and lower triangles of the respective matrices) and tested whether the average correlation across participants was significantly higher than zero (two-sided one–sample t tests).
Lastly, to assess the effect of performance speed in the SEQ condition on the representational content of the ROIs, a (one-tailed) paired sample t test was performed for each ROI to compare diagonal versus non-diagonal mean similarity in the SEQ SLOW matrix. This allowed us to investigate whether the same results were observed when the speed of performance in the SEQ condition was matched to the speed of performance in the RND condition. Next, to test whether the pattern similarity results in the SEQ condition differed depending on speed (there is a possibility that some of the reported patterns are accentuated by performance speed), we used (two-tailed) paired sample t tests to compare, for each ROI, average delta similarity (diagonal minus off-diagonal) between SEQ FAST and SEQ SLOW matrices.
Cohen's d effect sizes were computed for t tests and partial eta squared <mml:math display="inline"><mml:mo stretchy="false">(</mml:mo><mml:msubsup><mml:mi>η</mml:mi><mml:mi>p</mml:mi><mml:mn>2</mml:mn></mml:msubsup><mml:mo
stretchy="false">)</mml:mo></mml:math>(ηp2) for F tests. For each group of hypotheses, the false discovery rate (FDR) procedure was applied to correct for multiple testing
(i.e., two-sample t tests corrected for 7 ROIs × 3 matrices, 21 tests; ANOVA, regression results and paired sample t tests to compare SEQ FAST versus SLOW were corrected for 7 ROIs, 7 tests). In case of violation of the sphericity assumption,
Greenhouse–Geisser corrections were applied.
Data and materials availability
Source data for all figures, individual behavioral and pattern similarity data, as well as the scripts to process the data are available on OSF (DOI 10.17605/OSF.IO/PHCNG).
Results
As illustrated in Figure 1A, all participants completed a (1) learning, (2) fMRI, and (3) retention session during which they performed a SRTT. Task instruction was to respond as fast as possible to the location of a cue that appeared on the screen (eight locations, eight fingers, no thumbs; Fig. 1B). Depending on the task condition, the cues either followed a pseudorandom (RND SRTT, control task) or fixed, repeating sequential pattern (SEQ SRTT; motor sequence learning task). The repeating pattern in the SEQ condition consisted of eight key presses, and in this pattern, each finger was used once (Fig. 1B). In the RND condition, there was no fixed pattern, but each key was pressed once every eight key presses (Fig. 1B).
Behavioral results
Prior to learning, all participants performed a RND SRTT to assess baseline performance. A one-way RM ANOVA on RND SRTT performance
showed that speed (reaction time) and accuracy (% correct responses) remained stable across blocks of practice (main effect
of block, speed, F(3,96) = 0.552; <mml:math display="inline"><mml:msup><mml:mi>η</mml:mi><mml:mn>2</mml:mn></mml:msup></mml:math>η2= 0.017; p = 0.648; accuracy, F(2.228,71.286) = 0.772; <mml:math display="inline"><mml:msup><mml:mi>η</mml:mi><mml:mn>2</mml:mn></mml:msup></mml:math>η2 = 0.024; p = 0.478; Fig. 3, Learning). After baseline assessment of motor performance, participants performed the SEQ SRTT and learned a sequence of
eight finger movements through repeated practice. Behavioral results showed a main effect of practice on performance speed
and accuracy (RM ANOVA; main effect of block; speed, F(2.77,88.858) = 10.96; <mml:math display="inline"><mml:msubsup><mml:mi>η</mml:mi><mml:mi>p</mml:mi><mml:mn>2</mml:mn></mml:msubsup></mml:math>ηp2 = 0.255; p < 0.001; accuracy, F(8.474,271.169) = 2.011; <mml:math display="inline"><mml:msubsup><mml:mi>η</mml:mi><mml:mi>p</mml:mi><mml:mn>2</mml:mn></mml:msubsup></mml:math>ηp2 = 0.059; p = 0.042; Fig. 3, Learning). These results suggest that, as expected, participants learned the sequence of finger movements. The learning
session was immediately followed by an fMRI session that captured the neural processes supporting the execution of the learned
sequences. To optimize the multivariate analyses of the corresponding MRI data (see details in Materials and Methods), RND
and SEQ SRTT conditions were randomly alternated in each fMRI run. To investigate behavioral changes during the fMRI session,
a 2 (condition) by 8 (run) RM ANOVA was performed on both speed and accuracy measures. Performance speed was significantly
faster in the SEQ as compared with RND condition (condition, F(1,31) = 96.089; <mml:math display="inline"><mml:msubsup><mml:mi>η</mml:mi><mml:mi>p</mml:mi><mml:mn>2</mml:mn></mml:msubsup></mml:math>ηp2 = 0.756; p < 0.001) and fluctuated similarly across fMRI runs in both conditions (run, F(2.518,78.061) = 3.246; <mml:math display="inline"><mml:msubsup><mml:mi>η</mml:mi><mml:mi>p</mml:mi><mml:mn>2</mml:mn></mml:msubsup></mml:math>ηp2 = 0.095; p = 0.034; run × condition, F(4.882,151.344) = 0.719; <mml:math display="inline"><mml:msubsup><mml:mi>η</mml:mi><mml:mi>p</mml:mi><mml:mn>2</mml:mn></mml:msubsup></mml:math>ηp2 = 0.023; p = 0.656; Fig. 3, fMRI). Performance accuracy was overall higher in the SEQ as compared with that in the RND condition (condition, F(1,31) = 26.908; <mml:math display="inline"><mml:msubsup><mml:mi>η</mml:mi><mml:mi>p</mml:mi><mml:mn>2</mml:mn></mml:msubsup></mml:math>ηp2 = 0.465; p < 0.001) and remained stable across runs in both conditions (run, F(2.958,91.687) = 0.550; <mml:math display="inline"><mml:msubsup><mml:mi>η</mml:mi><mml:mi>p</mml:mi><mml:mn>2</mml:mn></mml:msubsup></mml:math>ηp2 = 0.017; p = 0.647; run × condition, F(7,217) = 0.787; <mml:math display="inline"><mml:msubsup><mml:mi>η</mml:mi><mml:mi>p</mml:mi><mml:mn>2</mml:mn></mml:msubsup></mml:math>ηp2 = 0.025; p = 0.599; Fig. 3, fMRI). These results indicate that participants presented a sequence-specific performance advantage in the scanner despite
the interleaved nature of practice. Lastly, results showed a main effect of condition on both speed and accuracy during retention,
indicating sequence-specific retention of the skill outside of the scanning environment (condition × block RM ANOVA; condition,
speed, F(1,31) = 199.082; <mml:math display="inline"><mml:msubsup><mml:mi>η</mml:mi><mml:mi>p</mml:mi><mml:mn>2</mml:mn></mml:msubsup></mml:math>ηp2 = 0.865; p < 0.001; accuracy, F(1,31) = 29.727; <mml:math display="inline"><mml:msubsup><mml:mi>η</mml:mi><mml:mi>p</mml:mi><mml:mn>2</mml:mn></mml:msubsup></mml:math>ηp2 = 0.490; p < 0.001; all other effects, all ps ≥ 0.172; Fig. 3, Retention).
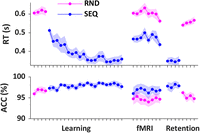
Behavioral results for all sessions. Reaction time (RT; s) and accuracy (ACC; %) for the RND and SEQ SRTT conditions are plotted across blocks of practice for the learning and retention sessions and across runs for the fMRI session. Extended Data Fig. 3-1 shows the behavioral results for the fMRI session after a median split was performed on the SEQ SRTT data (see Materials and Methods). N = 33. Shaded areas represent SEM.
Figure 3-1
Behavioral results for the fMRI session after a standard median split on reaction time in the sequence condition (see speed control analyses in the methods). Reaction time (RT; s) is plotted across runs for the fMRI session. A standard median split on reaction time was performed on sequence trials, resulting in a ‘slow’ sequence condition in which the reaction time matches the reaction time in the random condition. The median split resulted in similar mean reaction time in the SLOW SEQ as compared to the RND condition (i.e., 2 (condition) by 8 (run) RM ANOVA; condition: F(1,31) = 1.73, p = .197; run: F(2.518,78.061) = 2.72, p = .064; run x condition: F(4.882, 151.344) = .94, p = .429) and thus allowed us to match the speed across sequence and random conditions. The pattern similarity results of the speed control analyses are presented in Figure 5-1. N = 33. Shaded areas represent SEM. Download Figure 3-1, TIF file.
Neuroimaging results
We used multivoxel pattern similarity analyses of task-related fMRI data to characterize coding of temporal order information during motor sequence execution. Similarity analyses are based on the notion that the relative pattern of activation across voxels in a given brain region is informative about the type of information that is processed by that region (Kriegeskorte et al., 2008). Specifically, if a region codes for a particular type of information, higher similarity in voxel activation patterns is expected between pairs of trials sharing this information as compared with pairs of trials not sharing this information. Using this approach, we measured the extent to which specific ROIs represent information about finger movements in their learned temporal position in the sequence (i.e., finger + position coding). Additionally, we performed control analyses using the random task to test whether the ROIs carried information about (1) finger movements irrespective of their position in the movement pattern (i.e., finger coding) and (2) temporal positions irrespective of the finger movement performed (i.e., position coding). Analyses were performed on seven bilateral ROIs involved in motor sequence learning: PMC, SMA, aSPL, HC, putamen, and caudate nucleus (see Materials and Methods, Regions of interest; Fig. 2).
Finger + position coding in a learned motor sequence
We first investigated whether ROIs represent information about finger movements in their learned temporal position in a sequence. To do so, we estimated the average neural activation pattern evoked by each individual finger movement during execution of the learned motor sequence and computed similarity in activation patterns between movements across different task runs. This resulted in an 8 × 8 neural similarity matrix for each ROI in which diagonal cells index pattern similarity between pairs of movements sharing the same finger + position, while off-diagonal cells represent pattern similarity between pairs of movements not sharing this information (SEQ matrix; see Fig. 1C for the structure of the matrix and Fig. 4 for the group average similarity matrices). To assess whether ROIs showed finger + position coding in the sequence, a paired sample t test was performed across participants to compare diagonal versus non-diagonal mean similarity. Analysis of the SEQ matrix revealed significantly higher mean similarity along the diagonal (i.e., same finger + position) as compared with that along the off-diagonal (i.e., different finger + position) in all ROIs (paired sample t test, diagonal SEQ vs off-diagonal SEQ; HC, t(32) = 4.10; d = 0.71; pFDR < 0.001; caudate, t(32) = 3.88; d = 0.68; pFDR < 0.001; putamen, t(32) = 5.32; d = 0.96; pFDR < 0.001; aSPL, t(32) = 10.01; d = 1.69; pFDR < 0.001; SMA, t(32) = 15.03; d = 2.62; pFDR < 0.001; PMC, t(32) = 17.30; d = 3.05; pFDR < 0.001; M1, t(32) = 17.51; d = 3.05; pFDR < 0.001; Fig. 5, SEQ, white background). These results suggest that activation patterns in all ROIs carry information about finger movements in their learned temporal position the sequence. Importantly, as each finger movement in the sequence is bound to a specific position, both position and finger information are represented along the diagonal of the SEQ matrix. Accordingly, increased pattern similarity along the diagonal could be due to an overlap in either type of information. Control analyses were therefore performed using the random SRTT data to independently assess whether there is evidence of finger and/or position coding in our ROIs.
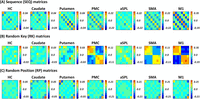
Group average neural similarity matrices (N = 33). Pattern similarity was computed across repetitions of the motor sequence to assess finger + position coding in the sequence condition (SEQ matrix, panel A) as well as across random patterns to quantify coding of individual finger movements irrespective of position (RK matrix, panel B) and positions irrespective of finger movement (RP matrix, panel C) in the random condition. Group average SEQ and RP neural similarity matrices for each ROI after removing the boundaries are presented in Extended Data Fig. 4-1. Average pattern similarity extracted from the off-diagonal cells in the SEQ and RK matrices and plotted as a function of lag in the learned sequence can be found in Extended Data Figs. 4-2 and 4-3, respectively. Color bars represent mean similarity (r). Note that color scales are different between ROIs to accommodate for differences in signal-to-noise ratio (and therefore in effect sizes) between ROIs.
Figure 4-1
Group average neural similarity matrices for each ROI after removing the boundaries. Color bars represent mean similarity (r). N = 33. Note that color scales are different between ROIS to accommodate for differences in signal-to-noise ratio (and therefore different effect sizes) between ROIs. Download Figure 4-1, TIF file.
Figure 4-2
Pattern similarity extracted from the sequence matrix as a function of lag in the learned sequence. The arrows indicate lags that are significantly different from 0 (two-tailed one sample t-test, corrected for N = 8 tests per ROI, pFDR < .05) and show significant differences with other lags (see below for detailed results of pairwise comparisons). For each ROI, the leftmost bar illustrates mean pattern similarity across repetitions of the same movement in the same position (‘‘lag 0’’), which was significantly larger than all other lags (except for lag 0 vs. lag 6 in the HC and the caudate). The other bars illustrate pattern similarity across repetitions of movement separated by one (‘‘lag 1’’), two (‘‘lag 2’’), three (‘‘lag 3’’) or more (‘‘lag 4’’, ‘‘lag 5’’, ‘‘lag 6’’, ‘‘lag 7’’) positions in the learned sequence. The RM ANOVA with lag (8) as within-subjects factor revealed a main effect of lag in all ROIs (HC, F(2.33,71.466) = 3.59, ɳp2 = .101, pFDR = .028; caudate: F(2.59,83.086) = 5.42, ɳp2 = .145, pFDR = .003; putamen, F(2.33,74.62) = 6.733, ɳp2 = .174, pFDR = .001; M1, F(2.032,65.025) = 98.998, ɳp2 = .756, pFDR < .001; PMC, F(3.043,97.376) = 83.325, ɳp2 = .723, pFDR < .001; SMA, F(2.78,88.961) = 76.580, ɳp2 = .705, pFDR < .001; aSPL, F(2.665,85.282) = 24.484, ɳp2 = .433, pFDR < .001). As expected, planned pairwise comparisons showed that in all ROIs, the diagonal (i.e., lag 0, same finger + position) was significantly larger than all other lags (i.e., lag 0 > all other lags, all pFDR < .05 except for lag 0 vs. lag 6 in the HC, pFDR = .086, and the caudate, pFDR = .116). The results also indicate that pattern similarity between movements that are one or more positions apart in the sequence fluctuates with the distance between movements, however we do not find evidence for a linear and progressive decrease of similarity with distance. The HC, caudate, putamen and aSPL showed a large reduction in pattern similarity on lag 1 and/or lag 7 (depending on the region) as compared to the diagonal and as compared to other lags (i.e., aSPL: lag 1 < lag 2-6 and lag 7 < lag 5, all pFDR < .05; HC: lag 1 < lag 2-3, 5, all pFDR < .05; putamen: lag 1 < lag 2-3, 5 and lag 7 < lag 5, all pFDR < .05, caudate: lag 7 < lag 2-6, all pFDR < .05). In the HC, putamen and aSPL (but not in the caudate), movements that were two positions apart in the sequence were also more similar to each other than movements that were more positions apart (i.e., lag 2 > lag 3: aSPL, pFDR = .04, putamen, pFDR = .147, HC, pFDR = .241; lag 2 > lag 4: aSPl, pFDR < .001, putamen, pFDR = .002, HC, pFDR = .003; lag 2 > lag 6, aSPl, pFDR < .001, putamen, pFDR = .022, HC, pFDR = .035, lag 2 vs. lag 7, aSPl, pFDR < .001, putamen, pFDR = .021, HC, pFDR = .518, note that no differences were observed between lag 2 and lag 5, all pFDR > .100). No other differences between lags were observed. In M1, SMA and PMC, there was a decrease in similarity between movements that were one, four and seven positions apart as compared to other lags (i.e., lag 1/4/7 < lag 2/3/5/6, all pFDR < .05) and increased similarity between movements that were two, three or five positions apart as compared to other lags (i.e. lag 2/3/5 > lag 1/4/6/7, all pFDR < .05). Taken together, the analyses suggest that (1) consecutive movements in the learned sequence evoke dissimilar response patterns in all regions (reflected by the reduction in pattern similarity on lag 1 and/or lag 7) and (2) that pattern similarity between movements that are further apart in the sequence (two or more positions) fluctuates with the distance between movements in M1, premotor and supplementary motor regions. Error bars denote ±1 SEM. Download Figure 4-2, TIF file.
Figure 4-3
Pattern similarity extracted from the RK matrix and plotted as a function of lag between movements in the learned sequence. In the regions that showed a significant main effect (see below), the arrows indicate bars that are significantly different from 0 (two-tailed one sample t-test, corrected for N = 8 tests per ROI, pFDR < .05) and show significant differences with other lags. A main effect of lag was found in the putamen, PMC, SMA, aSPL and M1, both when lag 0 was included or excluded from the model (RM ANOVA with lag (8) as within-subjects factor, putamen, F(4.768,153..158) = 3.184, ɳp2 = .090, pFDR = .010; aSPL, F(3.757,120.218) = 5.472, ɳp2 = .146, pFDR < .001; PMC, F(3.385,108,325) = 26.914, ɳp2 = .457, pFDR < .001; SMA, F(2.545,81.452) = 31.264, ɳp2 = .494, pFDR < .001; M1, F(1.744,55.817) = 61.052, ɳp2 = .656, pFDR < .001; RM ANOVA with lag (7) putamen, F(4.221,135.068) = 2.574, ɳp2 = .074, pFDR = .053; aSPL, F(3.368,107.767) = 2.534, ɳp2 = .073, pFDR = .095; PMC, F(3.199,102,373) = 14.220, ɳp2 = .308, pFDR < .001; SMA, F(2.427,77.651) = 19.949, ɳp2 = .384, pFDR < .001; M1, F(1,595,51.029) = 32.277, ɳp2 = .538, pFDR < .001). In putamen, PMC, aSPL, SMA and M1, mean pattern similarity for lag 0 was significantly larger than all other lags (i.e., lag 0 > all other lags, all pFDR < .05, except for lag 0 vs. lag 3 and 5 in the putamen). In PMC, M1 and SMA, there is also decreased similarity for lags one, four and seven as compared to other lags (i.e., lag 1/4/7 < lag 2/3/5/6, all pFDR < .05) and increased similarity between movements that were three or five positions apart as compared to other lags (i.e. lag 3/5 > lag 1/2/4/6/7, all pFDR < .05 except lag 3 vs. lag 2 in PMC). In the putamen, lag 3 is significantly higher than lag 1, 2, 4, 6 and 7 (all pFDR < .05) and lag 4 significantly lower than all other lags (all pFDR < .05). In aSPL, lag 2 is significantly higher than lag 1, 3, 4, 5 and 7 (all pFDR < .05). No other differences were observed. Error bars denote ±1 SEM. Download Figure 4-3, TIF file.
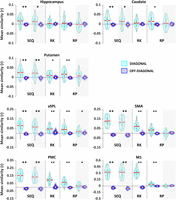
Mean pattern similarity for diagonal (cyan) and off-diagonal (blue) cells as a function of matrix and ROI (main analyses on white background and analyses controlling for boundary effects on gray background). If a given ROI codes for a particular type of information, higher similarity is expected on the diagonal as compared with the off-diagonal. For each ROI, finger + position, finger, and position coding were assessed by comparing the diagonal and off-diagonal within the SEQ, RK, and RP matrix, respectively. The main analyses (white background) indicate that the HC shows evidence for finger + position coding in the sequence but not for finger or position coding during random practice. In contrast, other ROIs show evidence of finger + position coding in the sequence as well as position and/or finger coding during random practice. To verify whether results in the SEQ and RP matrices are driven by boundary effects, we reran the corresponding analyses without boundaries (gray background). All ROIs show finger + position coding beyond boundaries in the sequence, but only the PMC and aSPL carry information about positions (beyond boundaries) under random conditions. Asterisks indicate significant differences between diagonal and off-diagonal (one-sided paired–sample t test; *pFDR < 0.05 and ** pFDR < 0.001). Colored circles represent individual data (N = 33), jittered in arbitrary distances on the x-axis to increase perceptibility. Red horizontal lines represent means and white circles represent medians. Note that Y-axis scales are different between ROIs to accommodate for differences in signal-to-noise ratio (and therefore in effect sizes) between cortical and subcortical ROIs.
Finger and position coding in random movement patterns
To assess finger coding irrespective of serial position, we quantified similarity in activation patterns between movements in the RND condition. This resulted in an 8 × 8 neural similarity matrix for each ROI in which diagonal cells index pattern similarity between the same movements, while off-diagonal cells represent pattern similarity between pairs of different movements (RK matrix; see Fig. 1C for the structure of the matrix and Fig. 4 for group average neural similarity matrices). Consistent with a pattern of finger coding, analysis of the RK matrix showed that mean similarity on the diagonal (i.e., the same finger) was significantly higher as compared with that on the off-diagonal (i.e., different finger) in M1, PMC, SMA, aSPL, and putamen (paired sample t test, diagonal RK vs off-diagonal RK; M1, t(32) = 18.93; d = 3.30; pFDR < 0.001; PMC, t(32) = 10.57; d = 1.84; pFDR < 0.001; SMA, t(32) = 9.85; d = 1.72; pFDR < 0.001; aSPL, t(32) = 6.46; d = 1.12; pFDR < 0.001; putamen, t(32) = 2.46; d = 0.43; pFDR = 0.011; Fig. 5, RK, white background). Exploratory follow-up analyses furthermore revealed higher similarity between different fingers belonging to the same as compared with different hands in these regions, which corresponds to a pattern consistent with hand coding (all t(32) > 3.25; all d > 0.56; all pFDR < 0.05; paired sample t test, within-hand RK vs between-hand RK; see Materials and Methods for details). Note that within M1, aSPL, PMC, and SMA, our results support the presence of finger coding beyond hand coding (M1, t(32) = 9.944; d = 1.73; pFDR < 0.001; PMC, t(32) = 4.701; d = 0.82; pFDR < 0.001; SMA, t(32) = 2.693; d = 0.47; pFDR = 0.01; aSPL, t(32) = 4.26; d = 0.74; pFDR < 0.001; paired sample t test, within-hand diagonal RK vs within-hand off–diagonal RK). No evidence of finger coding was found in the HC (t(32) = 0.426; d = 0.07; pFDR = 0.337) and caudate (t(32) = 1.36; d = 0.24; pFDR = 0.102).
To assess position coding, we computed pattern similarity between different finger movements sharing the same or different temporal positions in the RND task condition. This resulted in an 8 × 8 neural similarity matrix for each ROI in which diagonal cells index pattern similarity between movements with the same positions, while off-diagonal cells represent pattern similarity between movements with different positions in the random task (RP matrix; see Fig. 1C for the structure of the matrix and Fig. 4 for group average neural similarity matrices). Analysis of the RP matrix indicated that mean similarity was significantly higher for the diagonal (i.e., same position) as compared with the off-diagonal (i.e., different position) for all ROIs with the exception of the HC (paired sample t test, diagonal RP vs off-diagonal RP; HC, t(32) = 0.940; d = 0.16; pFDR = 0.185; caudate, t(32) = 3.03; d = 0.52; pFDR = 0.002; putamen, t(32) = 4.33; d = 0.75; pFDR < 0.001; aSPL, t(32) = 6.07; d = 1.06; pFDR < 0.001; SMA, t(32) = 5.56; d = 0.97; pFDR < 0.001; PMC, t(32) = 8.79; d = 1.53; pFDR < 0.001; M1, t(32) = 6.78; d = 1.18; pFDR < 0.001; Fig. 5, RP, white background).
Altogether, these analyses indicate that hippocampal patterns carry information about finger movements in their learned temporal position (i.e., finger + position coding) in the sequence condition, while other ROIs showed evidence of finger + position coding in the sequence condition as well as position (caudate, putamen, M1, SMA, PMC, and aSPL, but see temporal position analyses below showing that higher similarity on Positions 1 and 8 might account for these results in some ROIs) and finger/hand (putamen, M1, SMA, PMC, and aSPL) coding during random practice.
Pattern similarity as a function of temporal position
Inspection of the SEQ and RP similarity matrices suggests that, in some regions, the increased pattern similarity along the diagonal highlighted in the previous analyses is not homogenous across serial positions but are driven by the boundaries of the eight-element pattern (i.e., higher similarity on Positions 1 and 8 in the SEQ and RP matrices; Fig. 4A,C). To verify whether the finger + position coding and position coding effects reported in the previous section are driven by these boundary effects, we excluded boundary positions from SEQ and RP matrices (see Extended Data Fig. 4-1 for corresponding matrices) and reran the analyses. These control analyses showed that pattern similarity effects in the SEQ matrix (same finger + position > different finger + position) remained significant in all ROIs (paired sample t test, diagonal SEQ vs off-diagonal SEQ; HC, t(32) = 2.66; d = 0.47; pFDR = 0.013; caudate, t(32) = 2.62; d = 0.46; pFDR = 0.013; putamen, t(32) = 4.47; d = 0.78; pFDR < 0.001; aSPL, t(32) = 7.21; d = 1.26; pFDR < 0.001; SMA, t(32) = 12.5; d = 2.18; pFDR < 0.001; PMC, t(32) = 13.22; d = 2.30; pFDR < 0.001; M1, t(32) = 15.60; d = 2.71; pFDR < 0.001; Fig. 5, SEQ, gray background), while there is no longer evidence that activation patterns in the caudate, putamen, M1, and SMA carry information about serial positions (other than boundary positions) in the random condition (paired sample t test, diagonal RP vs off-diagonal RP; caudate, t(32) = 0.70; d = 0.12; pFDR = 0.27; putamen, t(32) = 1.67; d = 0.29; pFDR = 0.073; M1, t(32) = −1.18; d = −0.21; pFDR = 0.15; SMA, t(32) = −0.81; d = −0.14; pFDR = 0.25; Fig. 5, RP, gray background). Position coding remained significant in PMC (t(32) = 2.11; d = 0.37; pFDR = 0.033) and aSPL (t(32) = 1.9; d =0.33; pFDR = 0.049; Fig. 5, RP, gray background). In sum, these analyses confirm that all ROIs show finger + position coding beyond boundaries in the sequence. They also refine the classification described above and indicate that only the PMC and aSPL carry information about positions (other than boundaries) under random conditions. Altogether, these results indicate that hippocampal and caudate activation patterns carry information about finger + position coding, while other ROIs showed evidence of finger + position coding in the sequence as well as finger (putamen, SMA, PMC, and aSPL) and position (PMC and aSPL) coding during random practice. These conclusions are summarized in Table 2.
Comparison diagonal versus off-diagonal
Comparisons between representations
To assess whether ROIs showed preferential coding for one representation over the others, we compared delta similarity (i.e.,
mean pattern similarity diagonal minus off-diagonal) between matrices. For each ROI, delta values were entered in a RM ANOVA
with matrix (SEQ, RK, and RP) as within-subject factor. The analyses revealed a significant matrix effect in all ROIs except
the caudate (HC, F(2,64) = 5.22; <mml:math display="inline"><mml:msubsup><mml:mi>η</mml:mi><mml:mi>p</mml:mi><mml:mn>2</mml:mn></mml:msubsup></mml:math>ηp2 = 0.14; pFDR = 0.009; caudate, F(2,64) = 2.73; <mml:math display="inline"><mml:msubsup><mml:mi>η</mml:mi><mml:mi>p</mml:mi><mml:mn>2</mml:mn></mml:msubsup></mml:math>ηp2 = 0.08; pFDR = 0.072; putamen, F(2,64) = 6.05; <mml:math display="inline"><mml:msubsup><mml:mi>η</mml:mi><mml:mi>p</mml:mi><mml:mn>2</mml:mn></mml:msubsup></mml:math>ηp2 = 0.16; pFDR = 0.005; M1, F(2,64) = 181.44; <mml:math display="inline"><mml:msubsup><mml:mi>η</mml:mi><mml:mi>p</mml:mi><mml:mn>2</mml:mn></mml:msubsup></mml:math>ηp2 = 0.85; pFDR < 0.001; PMC, F(2,64) = 52.87; <mml:math display="inline"><mml:msubsup><mml:mi>η</mml:mi><mml:mi>p</mml:mi><mml:mn>2</mml:mn></mml:msubsup></mml:math>ηp2 = 0.63; pFDR < 0.001; SMA, F(2,64) = 67.06; <mml:math display="inline"><mml:msubsup><mml:mi>η</mml:mi><mml:mi>p</mml:mi><mml:mn>2</mml:mn></mml:msubsup></mml:math>ηp2 = 0.68; pFDR < 0.001; aSPL, F(2,64) = 17.17; <mml:math display="inline"><mml:msubsup><mml:mi>η</mml:mi><mml:mi>p</mml:mi><mml:mn>2</mml:mn></mml:msubsup></mml:math>ηp2 = 0.35; pFDR < 0.001; Fig. 6, white background). Planned pairwise comparisons showed that delta similarity in the HC was significantly larger in the SEQ
as compared with the RK and RP matrices (SEQ vs RK, pFDR = 0.005; SEQ vs RP, pFDR = 0.05), while no difference was found between RP and RK (pFDR = 0.56). These data suggest that the HC carries information about finger + position beyond information about fingers or positions.
A similar pattern of results was observed in aSPL (SEQ vs RK, pFDR < 0.001; SEQ vs RP, pFDR < 0.001; RK vs RP, pFDR = 0.48). In the putamen, finger + position was greater than finger coding (SEQ vs RK, pFDR = 0.013), but no differences were found between the other matrices (SEQ vs RP, pFDR = 0.08; RK vs RP, pFDR = 0.08). Planned pairwise comparisons in M1 indicated no difference in delta similarity between SEQ and RK matrices (pFDR = 0.192), but both SEQ and RK delta similarity were significantly greater than RP (both pFDR < 0.001). Lastly, in PMC and SMA, a gradient in delta similarity was observed such that SEQ was greater than RK which was
greater than RP (SEQ vs RK, pFDR < 0.001; SEQ vs RP, pFDR < 0.001; RK vs RP, pFDR < 0.001). In the caudate, results showed no difference in delta similarity between matrices (all pFDR > 0.1).
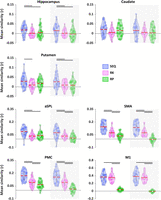
Delta pattern similarity (diagonal minus off-diagonal) as a function of matrix and ROI (main analyses on white background and analyses controlling for boundary effects on gray background). Finger + position, finger, and position coding were assessed using the SEQ, RK, and RP matrices, respectively. The main analyses (white background) reveal that the HC shows finger + position coding beyond finger (SEQ > RK) and position coding (SEQ > RP), while the caudate shows no differences between matrices. The putamen shows binding beyond finger coding (SEQ > RK). aSPL shows finger + position beyond finger (SEQ > RK) and position coding (SEQ > RP). In SMA and PMC, finger + position is greater than finger coding (SEQ > RK) which was greater than position coding (RK > RP). M1 shows coding for finger + position and finger coding beyond position coding (SEQ > RP and RK > RP). Results after boundary correction (gray background) indicate that the putamen shows finger + position coding in the sequence beyond finger and position coding (SEQ > RK and SEQ > RP), while finger + position in aSPL is greater than finger coding (SEQ > RK) which was greater than position coding (RK > RP). Horizontal lines indicate significant differences between matrices (planned pairwise comparisons following RM ANOVA; pFDR < 0.05). Colored circles represent individual data (N = 33), jittered in arbitrary distances on the x-axis to increase perceptibility. Red horizontal lines represent means and white circles represent medians. Note that Y-axis scales are different between ROIs to accommodate for differences in signal-to-noise ratio (and effect sizes) between ROIs.
For completeness, we reran these analyses while excluding the boundary positions from the SEQ and RP matrices. The control
analyses showed a significant matrix effect in all ROIs except the caudate (HC, F(2,64) = 4.04; <mml:math display="inline"><mml:msubsup><mml:mi>η</mml:mi><mml:mi>p</mml:mi><mml:mn>2</mml:mn></mml:msubsup></mml:math>ηp2 = 0.11; pFDR = 0.025; caudate, F(2,64) = 1.53; <mml:math display="inline"><mml:msubsup><mml:mi>η</mml:mi><mml:mi>p</mml:mi><mml:mn>2</mml:mn></mml:msubsup></mml:math>ηp2 = 0.05; pFDR = 0.224; putamen, F(2,64) = 4.99; <mml:math display="inline"><mml:msubsup><mml:mi>η</mml:mi><mml:mi>p</mml:mi><mml:mn>2</mml:mn></mml:msubsup></mml:math>ηp2 = 0.14; pFDR = 0.014; M1, F(2,64) = 175.37; <mml:math display="inline"><mml:msubsup><mml:mi>η</mml:mi><mml:mi>p</mml:mi><mml:mn>2</mml:mn></mml:msubsup></mml:math>ηp2 = 0.85; pFDR < 0.001; PMC, F(2,64) = 75.45; <mml:math display="inline"><mml:msubsup><mml:mi>η</mml:mi><mml:mi>p</mml:mi><mml:mn>2</mml:mn></mml:msubsup></mml:math>ηp2 = 0.70; pFDR < 0.001; SMA, F(2,64) = 91.77; <mml:math display="inline"><mml:msubsup><mml:mi>η</mml:mi><mml:mi>p</mml:mi><mml:mn>2</mml:mn></mml:msubsup></mml:math>ηp2 = 0.74; pFDR < 0.001; aSPL, F(2,64) = 15.27; <mml:math display="inline"><mml:msubsup><mml:mi>η</mml:mi><mml:mi>p</mml:mi><mml:mn>2</mml:mn></mml:msubsup></mml:math>ηp2 = 0.32; pFDR < 0.001, Fig. 6, gray background). Planned pairwise comparisons revealed the same pattern of results in all ROIs except for the putamen and
aSPL. Specifically, when controlling for boundary effects, the putamen carries information about finger + position beyond
finger (SEQ vs RK, pFDR = 0.027) and position coding (SEQ vs RP, pFDR = 0.027). The control analyses in aSPL revealed a similar gradient as in PMC and SMA such that SEQ was greater than RK which
was greater than RP (SEQ vs RK, pFDR = 0.002; SEQ vs RP, pFDR = 0.012; RK vs RP, pFDR < 0.001). The pattern in the other ROIs remained unchanged (HC, SEQ vs RK, pFDR = 0.038; SEQ vs RP, pFDR = 0.038; RK vs RP, pFDR = 0.56; caudate, all pFDR > 0.1; M1, SEQ vs RK, pFDR = 0.192; SEQ vs RP, pFDR < 0.001; RK vs RP, pFDR < 0.001; PMC and SMA, SEQ vs RK, pFDR < 0.001; SEQ vs RP, pFDR < 0.001; RK vs RP, pFDR < 0.001).
Altogether, these results indicate that the HC and putamen show preferential coding for finger + position in the sequence over position and finger coding. Interestingly, M1 showed preferential coding for both finger + position in the sequence and finger (i.e., no difference between these two matrices) over position coding, while a gradient was observed in all the other cortical regions such that finger + position coding was greater than finger coding which was greater than position coding. The caudate nucleus did not show evidence of differential coding (i.e., no significant differences between matrices were found).
Contribution of finger and position coding to finger + position coding
Given that all ROIs presented evidence of finger + position coding in the sequence and that some ROIs also coded for positions and/or finger movements, it seems possible that overlap in finger and/or position information might contribute to the enhanced pattern similarity for same finger + position in the learned sequence. Accordingly, in the last step, we used linear regression analyses to investigate whether finger and position coding (as assessed during random practice) might explain pattern similarity effects observed in the sequence condition. As expected in the HC—where we observed no evidence of position or finger coding—neither factor contributed to the SEQ results (see Table 3 for corresponding statistics). In the putamen and aSPL, there was evidence for finger and/or position coding in the random task; however, as for the HC, these factors did not contribute to the finger + position coding observed in the sequence task (Table 3). Importantly, in M1, PMC, and SMA, the analyses revealed that finger coding significantly contributed to the variance in SEQ delta similarity (M1, B = 0.565; t(1,31) = 2.337; pFDR = 0.021; PMC, B = 0.647; t(1,31) = 3.889; pFDR = 0.003; SMA, B = 0.540; t(1,31) = 2.573; pFDR = 0.035; see Table 3 for corresponding model statistics). Adding position to the model did not improve the model fit (see also Table 3 for linear regression models including only one independent variable showing that position coding does not contribute to sequence coding in these ROIs). Lastly, the finger + position coding observed in the caudate (which was not significantly greater than coding of other information) was not explained by either finger or position coding (Table 3).
Results linear regressions
In summary, the results of the linear regression models suggest that in M1, PMC, and SMA, finger + position coding during the execution of learned sequence can, at least in part, be explained by finger coding.
Off-diagonal patterns
We performed fine-grained analyses of the patterns observed in the off-diagonal cells in the SEQ matrices to assess whether representational similarity changed as a function of the lag between movements in the learned sequence (e.g., one could expect that representations of movements that are one position apart are more similar to each other than the representations of movements that are two or more positions apart in the sequence, etc.). To assess lag-dependent effects in the SEQ matrices, we ran for each ROI a RM ANOVA on pattern similarity with lag as within-subject factor (i.e., factor with eight levels: lag 0 to lag 7). As illustrated in Extended Data Fig. 4-2, the analyses on the SEQ matrices revealed a main effect of lag on pattern similarity in all regions (see caption of Extended Data Fig. 4-2 for the corresponding statistics). The results of the planned pairwise comparisons indicate that (1) consecutive movements in the learned sequence evoked dissimilar response patterns in all regions (reflected by the reduction in pattern similarity on lag 1 and/or lag 7; Extended Data Fig. 4-2) and (2) that pattern similarity between movements that are further apart in the sequence (two or more positions) fluctuates as a function of the distance between movements in M1, premotor, and supplementary motor regions (Extended Data Fig. 4-2). No evidence for a linear decrease in pattern similarity as a function of lag between movements in the sequence was observed. We also tested whether there were lag-dependent effects in the RP and/or RK matrices and whether these off-diagonal patterns were predictive of the off-diagonal patterns in the SEQ matrices. For the RK matrices, a main effect of lag was found in the putamen, PMC, SMA, aSPL, and M1 but not in the caudate and HC (see Extended Data Fig. 4-3 for corresponding statistics). None of the ROIs showed lag-dependent similarity effects in the RP matrix (no main effect of lag was observed in a model excluding lag 0; all pfdr > 0.100). Results of correlations between off-diagonal cells from the SEQ and the RK matrices (using non-diagonal cells averaged across upper and lower triangles) indicate that SEQ off-diagonal data were significantly explained by the RK off-diagonal data in the motor cortical regions but not in the HC, caudate, putamen, and aSPL (two-sided one sample t test, SMA, t(32) = 6.779; d = 1.18; pFDR < 0.001; PMC, t(32) = 6.246; d = 1.09; pFDR < 0.001; M1, t(32) =12.83; d = 2.24; pFDR < 0.001; HC, t(32) = −0.58; d = −0.10; pFDR = 0.566; caudate, t(32) = −1.31; d = -0.23; pFDR = 0.200; putamen, t(32) = 2.17; d = 0.38; pFDR = 0.066; aSPL, t(32) = 1.93; d = 0.34; pFDR = 0.084). These findings suggest that the motor characteristics of the learned sequence contributed to the off-diagonal patterns in the SEQ matrix in these regions. These results are in line with the findings reported above on diagonal patterns showing that finger coding contributed to finger + position coding in the learned sequence in M1, PMC, and SMA but not in HC, aSPL, and putamen. In none of the ROIs, the SEQ off-diagonal patterns were explained by the RP off-diagonal patterns (two sided one sample t test, HC, t(32) = 0.986; d = 0.17; pFDR = 0.331; putamen, t(32) = 0.611; d = –0.12; pFDR = 0.540; caudate, t(32) = –0.704; d = 0.11; pFDR = 0.481; PMC, t(32) = 1.97; d = 0.343; pFDR = 0.200; aSPL, t(32) = –0.558, d = –0.1, pFDR = 0.580; SMA, t(32) = 1.13, d = 0.20, pFDR = 0.260; M1, t(32) = –2.871; d = –0.50; pFDR = .051). In summary, these analyses show that the off-diagonal patterns in the SEQ matrix in M1, PMC, and SMA can be attributed to the motoric characteristics of the task and do not reflect temporal order information about the learned sequence. In contrast, off-diagonal patterns in the HC, aSPL, and putamen are not explained by these factors and might reflect information about temporal order in the sequence. Specifically, the patterns observed in lag 1 cells in these regions suggest that temporal coding is not only reflected by greater similarity between items sharing finger and position information (see diagonal cells in the main analyses) but also by greater dissimilarity between items presented consecutively in time.
Effect of performance speed on pattern similarity
As shown in Figure 3, average performance during the fMRI session was higher in the SEQ as compared to the RND SRTT. We therefore assessed whether the neural pattern similarity results in the SEQ condition could be replicated when the SEQ SRTT was performed at a slower pace (e.g., at a similar speed as in the RND condition, Extended Data Fig. 3-1). The results indicate that all ROIs showed significant finger + position coding (i.e., same finger + position > different finger + position) at slow performance speed in the SEQ condition (paired sample t test, diagonal SLOW SEQ vs off-diagonal SLOW SEQ; HC, t(32) = 1.96; d = 0.34; pFDR = 0.03; caudate, t(32) = 3.69; d = 0.55; pFDR = 0.002; putamen, t(32) = 2.28; d = 0.36; pFDR = 0.017; aSPL, t(32) = 6.59; d = 1.14; pFDR < 0.001; SMA, t(32) = 8.13; d = 1.43; pFDR < 0.001; PMC, t(32) = 10.7; d = 1.21, pFDR < 0.001; M1, t(32) = 17.82; d = 3.10; pFDR < 0.001). This suggests that the results reported above for the sequence condition are not due to higher performance speed. To test the possibility that pattern similarity were accentuated by performance speed, we performed a second set of control analyses and examined whether the pattern similarity results in the sequence condition differed depending on performance speed. The comparisons of delta similarity (diagonal minus off-diagonal) between FAST and SLOW SEQ matrices showed increased delta similarity for FAST as compared with SLOW trials in aSPL and PMC (paired sample test, delta FAST vs delta SLOW, pFDR < 0.05). No such differences were observed in the other ROIs. These findings suggest that PMC and aSPL showed significantly greater finger + position coding for fast as compared to slow sequence trials. Importantly, these observations do not influence the main interpretations of the results in PMC and aSPL as finger + position coding was nonetheless significant for slow trials in these ROIs.
Discussion
In the current study, we used multivoxel pattern similarity analysis of fMRI data to unravel how temporal order information is represented during the execution of learned motor sequences. In line with our hypothesis, we found that hippocampal multivoxel activation patterns carried information about finger movements in their learned temporal position in the sequence (i.e., finger + position coding) and this above and beyond information about movements or positions in random movement patterns. In contrast, other ROIs showed evidence of finger + position coding in the sequence as well as position and/or movement coding in the random condition. Specifically, multivoxel patterns in M1, SMA, and putamen also carried movement-based information, while the PMC and aSPL represented both movement- and position-based information during random practice. Importantly, pattern similarity results in the sequence condition could, at least in part, be explained by finger coding in M1, PMC, and SMA but not in the putamen and aSPL.
While hippocampal recruitment during motor sequence learning has consistently been reported in the literature (Schendan et al., 2003; Albouy et al., 2008, 2013c, 2015; Fernández-Seara et al., 2009; Cousins et al., 2016; Pinsard et al., 2019; Jacobacci et al., 2020; Buch et al., 2021; Dolfen et al., 2021a,b; King et al., 2022), studies investigating the functional role of the HC during this process are sparse [but see Albouy et al. (2015) and King et al. (2022) for earlier research focusing on spatial representations of motor sequences in the HC]. Our analyses demonstrated that the HC coded for finger movements in their learned temporal position in the sequence above and beyond other task representations. As opposed to other ROIs, the HC showed no evidence for movement or position coding. These data suggest that the HC represents movements within their temporal context and thus encodes information about the temporal order of movements in the learned sequence. Our results are in line with a recent fMRI study showing that hippocampal multivoxel patterns differentiate between motor sequences based on the order of movements (Pinsard et al., 2019). More strikingly, the present findings concur with studies in the non-motor domain demonstrating that the HC encodes the temporal order of objects (Hsieh et al., 2014) and auditory stimuli (Kalm et al., 2013) during sequence learning. It is therefore tempting to speculate that the HC processes temporal order information in sequences irrespective of the nature of the items (e.g., objects, sounds, movements) and the type of memory (i.e., motor, or non-motor). This explanation, however, remains to be specifically tested.
In addition to the HC, we also showed evidence of finger + position coding in the aSPL. Our data corroborate prior evidence that parietal regions encode the sequential context during motor learning (Yokoi et al., 2018; Yokoi and Diedrichsen, 2019; Berlot et al., 2020) and hence are sensitive to the temporal order of movements. Together with the HC, parietal areas are thought to support the development of an effector-independent, spatial representation of the motor sequence that is acquired early during initial practice (Hikosaka et al., 2002; Albouy et al., 2013b; Albouy et al., 2015). This representation characterizes the motor sequence as a series of response goals in allocentric (world-centered) space, irrespective of the fingers actually involved in its execution. In analogy with the spatial memory domain (Save and Poucet, 2000), the parietal cortex might combine movement and temporal order information, both encoded in this region, that is then integrated into allocentric space in the HC. The resulting associative map available in the hippocampo-parietal network and linking response goals to their ordinal position in the sequence might serve as a cognitive framework that can be abstracted during motor sequence learning and subsequently used as a cognitive-motor schema in which new movements can be rapidly integrated (King et al., 2019). Based on earlier studies showing that hippocampal representations of motor learning are reactivated during post-encoding off-line episodes (King et al., 2022) and are linked to successful motor memory retention (Albouy et al., 2013a, 2015), we argue that this associative map is consolidated during sleep and critical for subsequent motor memory retention.
A pattern of results corresponding to movement + position coding was also observed in the putamen. These findings are consistent with recent work showing that the execution of different motor sequences consisting of the same finger movements but in a different order elicited distinct activation patterns in the striatum (Pinsard et al., 2019; Berlot et al., 2020). They are also in line with the notion that the striatum learns probabilistic or predictive associations between stimuli and responses and/or between motor responses in a sequence (Graybiel, 2008; Penhune and Steele, 2012). The current data suggest that the striatum encoded the association between movements and their position in the learned deterministic sequence. While these results appear to be similar in hippocampo-parietal areas and the striatum, we suggest that they are the result of different processes. Previous literature has associated striatal responses to effector-dependent, motoric representation of the sequence during learning (Hikosaka et al., 1999, 2002; Doyon et al., 2003). Interestingly, our data also show that the putamen carried effector-specific information during random task practice. We therefore argue that the striatum represents information about the link between specific movements and their learned temporal position rather than about the link between effector-independent response goals and their position as proposed for the HC and parietal cortex. Given the rigid nature of stimulus-response associations learned by the putamen (Graybiel, 2008), we also speculate that the finger-position map developed in the striatum is less flexible compared to the hippocampo-cortical map described above. However, these statements are speculative and warrant further investigation.
Our data further indicate that the contribution of cortical regions such as M1, PMC, and SMA to motor sequence learning might be attributed—at least in part—to movement coding. The results observed in M1 are consistent with earlier multivariate fMRI studies showing that M1 activation patterns relate to the execution of individual movements during motor sequence learning (Yokoi et al., 2018; Yokoi and Diedrichsen, 2019). Importantly, our data demonstrate that movement-based information is not uniquely represented in the M1 during motor sequence learning but also in secondary motor areas (PMC and SMA). This is in contradiction with earlier work showing that the premotor and supplementary motor regions encode the sequential context rather than individual movement components [Yokoi et al., 2018; Yokoi and Diedrichsen, 2019; Berlot et al., 2020; but see Yokoi et al. (2018) where no clear evidence for sequence representations was found in SMA]. However, it is worth noting that while our analyses suggest a contribution via movement coding, they do not allow us to conclude that these regions do not code for finger + position during motor sequence learning (and hence do not represent sequence order). It is possible that regions code for multiple representations (e.g., both sequence order and individual movements; Kornysheva and Diedrichsen, 2014). Yet, we argue that the predominant movement coding observed in the cortical ROIs in our research—in contrast to earlier work—might be attributed to differences in learning stages between studies. Whereas participants were extensively trained (up to 5 d) before the scanning session in previous work (Yokoi et al., 2018; Yokoi and Diedrichsen, 2019; Berlot et al., 2020), participants only completed 1 h of training in the current study. Taken together with evidence that sequence-specific activation patterns in secondary areas show less stability early in learning (Berlot et al., 2020) and that the ability to discriminate between new sequences is significantly lower than between consolidated sequences in these areas (Pinsard et al., 2019), it could be argued that secondary motor areas support individual movement representations early during learning while sequence representations—and therefore movement + position coding—might emerge at later learning stages.
In addition to the movement coding discussed above, the PMC and aSPL showed a profile consistent with position coding during random task practice. While this effect was unexpected in the aSPL, the role of the PMC in temporal processing of motor information is in line with these observations. Specifically, prior research has shown that the PMC encodes temporal features about motor sequences (e.g., interval between key presses) irrespective of the movements performed (Kornysheva and Diedrichsen, 2014). Furthermore, animal work indicated that PMC neurons are not only tuned to interval duration but also to specific positions in a series of movements (Merchant et al., 2013). Altogether, we propose that PMC position patterns might reflect the availability of a temporal scaffold (here of eight elements) within which movements are implemented. Although the availability of such a position framework seems especially important to efficiently prepare and implement responses in the sequence task, position coding was observed during random practice and did not significantly contribute to the pattern during sequence execution. It is possible that the visual cues indicating the ordinal position of movements in the eight-element stream might have triggered the development of such a framework in the random condition.
Lastly, we offer some considerations related to the reported effects and the approach used in this study. The first consideration is related to the nature of the task used in the current study as prior work suggests that the SRTT is not exclusively a motor learning task but also includes important (non-motor) perceptual and explicit components (Robertson, 2007; Ghilardi et al., 2009). Given the known role of the HC in explicit processes (Addante, 2015) and perceptual learning (Schapiro et al., 2012), it could be argued that the involvement of the HC in the current study is related to the explicit and/or perceptual components of the task and thus may not be generalizable to other motor sequence tasks not presenting these attributes. We acknowledge that the current design does not allow us to determine the extent to which perceptual or explicit processes contributed to the representations observed in the HC and that this is an important limitation of our design. The question therefore remains whether similar results would be observed when motor sequence learning takes place in the absence of these perceptual and/or explicit components. With respect to the explicit component of the task, recent memory models challenge the view that the HC is exclusively dedicated to explicit learning (Henke, 2010), and studies in the non-motor and motor domain have indeed demonstrated hippocampal involvement during sequence learning irrespective of the explicit awareness of the material to learn (Schendan et al., 2003; Rose et al., 2011; Jablonowski et al., 2018). Concerning the perceptual component of the task, previous work has shown significant hippocampal activations during motor sequence learning independent of whether the task is visually guided or not [see Lewis et al. (2011); Albouy et al. (2012, 2013c, 2015); Fogel et al. (2014); King et al. (2017); and Pinsard et al. (2019) for self-paced tasks without visual cues and Schendan et al. (2003); Albouy et al. (2008); and Cousins et al. (2016) for tasks with visual cues] and while controlling for the perceptual component of learning [Gheysen et al., 2010, 2011; but see Rose et al. (2011)]. Altogether, these prior studies suggest that the involvement of the HC in sequence learning is not limited to tasks presenting these particular attributes. We would therefore expect similar results as those reported in the current manuscript with a non-visually guided or with an implicit sequence learning task as long as the sequential order of the movements in the task needs to be preserved. However, this is speculative, and the contribution of the HC across motor sequence learning tasks of different nature remains to be tested in future research.
A second consideration relates to signal-to-noise ratio in the different regions of interest examined in the current study. It seems possible that the lack of position and/or movement coding in the HC is due to a generally lower signal-to-noise ratio in subcortical regions. However, given that there was evidence for effector and position (boundary) coding in striatal regions, this seems unlikely. Third, in all our ROIs, we found that pattern similarity was increased for boundary positions (i.e., Positions 1 and 8) as compared with positions in the middle of the movement pattern in both task conditions. It is possible that the perception of boundaries was facilitated by the visual cues indicating the ordinal position of movements in the eight-element stream. As these effects were observed in both the sequence and random tasks, they might, at least in part, be driven by general attentional processes which in turn modulated pattern similarity at these boundary positions (Aly and Turk-Browne, 2016; e.g., increased attention at the start and the end of the eight-element stream to adapt to/recognize the new condition or to prepare for a possible condition switch). Last, it should be noted that the functional imaging approach used in the current study is correlational in nature and does not allow for any causal conclusions nor does it allow to examine brain function in an integrated way, e.g., at the network level, but only offers the possibility to characterize brain function on a region-by-region basis.
In summary, the present results demonstrate that the HC, the parietal cortex, and the striatum represent information about movements in their learned position in the sequence and hence encode the temporal order of movements. We propose that these representations might result from different binding processes in these regions, i.e., the binding of response goals in hippocampo-parietal areas as opposed to motor responses in the striatum, to their ordinal position in the sequence. Our data also refine the functional role of motor cortical regions (M1, SMA, PMC) in motor sequence learning and indicate a contribution through movement coding. However, it is worth noting that while our analyses suggest a contribution via movement coding, they do not allow us to conclude that these regions do not represent sequence order. Altogether, our results do not only provide novel insight into the role of the HC in the procedural memory domain but also deepen our understanding of the involvement of striatal and cortical regions in motor sequence learning.
Footnotes
- Received March 26, 2024.
- Revision received June 27, 2024.
- Accepted July 25, 2024.
-
We thank Ather Mujitaba for his assistance with data collection and Brendan Ritchie for his advice on multivariate analyses of fMRI data. This work was supported by Research Foundation Flanders (G.A.: G099516N, 1524218N, G0D7918N, G0B1419N; S.R.: 1141320N; H.O.: G0D3322N), Excellence of Science (30446199, MEMODYN), Belgian Educational Fund (N.D.) and KU Leuven (H.O.: C14/21/047).
-
The authors declare no competing financial interest.
- Correspondence should be addressed to Genevieve Albouy at genevieve.albouy{at}kuleuven.be.
- Copyright © 2024 the authors




