Extracellular Spike Waveforms: Morphology, Biophysics, and Classification Strategies
- 1Department of Neurosurgery, Massachusetts General Hospital, Boston, Massachusetts 02114
- 2Department of Neurosurgery, Harvard Medical School, Boston, Massachusetts 02115
- 3Department of Biomedical Engineering, The University of Melbourne, Parkville, Victoria 3010, Australia
-
Author contributions: S.H.S. and M.R.I. wrote the paper.
Abstract
Extracellular spike waveforms provide critical insights into neuronal activity, morphology, and function. Their shape can reveal cell-type identity, excitatory versus inhibitory function, and afferent projections from distal regions. The development of dense, high-channel-count probes now permits recordings from thousands of sites simultaneously, revealing a wider diversity of waveform types than previously appreciated. These advances provide an unprecedented opportunity to link waveform shape to the underlying biophysical processes of neurons and their spatial arrangement relative to the recording electrode. This review examines and catalogs the diversity of extracellular waveforms (including negative, triphasic, and positive spike waveforms), focusing on their biophysical origins and roles in neural compartments. We also discuss classification strategies, ranging from traditional feature-based approaches that use specific waveform features (such as spike duration and peak-to-trough ratios) to emerging machine learning and multimodal methods that integrate waveform shape with firing dynamics and anatomical localization. These new approaches reveal novel neuronal populations but also highlight a pressing need for standardized classification frameworks to ensure reproducibility and facilitate cross-study comparisons. Finally, we review how experimental factors such as filtering, sampling biases, and spike-sorting algorithms shape the observed diversity of extracellular waveforms. By consolidating recent progress in both experimental and computational approaches, this review provides a comprehensive resource for interpreting extracellular recordings. A deeper understanding of waveform diversity will advance basic neuroscience and accelerate applications in brain–machine interfaces, diagnostics, and neural prosthetics.
Significance of Extracellular Spikes
Measuring and interpreting extracellular action potentials or spikes has been fundamental in advancing our understanding of neuroscience. Early electrophysiological studies recorded spikes to determine the timing of neural activity, helping researchers study the relationship between neurons and stimuli. Adrian's pioneering work in the 1930s demonstrated that spike frequency in sensory neurons correlates with stimulus intensity (Adrian, 1928), initiating neural coding theories. This approach has since been extended to groundbreaking discoveries, e.g., Hubel and Wiesel's identification of orientation-selective neurons in the visual cortex (Hubel and Wiesel, 1959; Hubel, 1960), Mountcastle's exploration of the somatosensory cortex (Mountcastle et al., 1969), and O'Keefe and Dostrovsky's discovery of place cells in the hippocampus (O’Keefe and Dostrovsky, 1971).
Over time, it became evident that extracellular spike shapes also offer important insights into neuronal function (Mountcastle et al., 1969). Specifically, the shape of these waveforms can be used to infer cell-type–specific morphoelectrical properties. Characteristics of the extracellular spike shape can correspond to specific biophysical processes within neurons (Fig. 1A), providing crucial information about the neuron's intracellular dynamics (McCormick et al., 1985; Csicsvari et al., 1999; Henze et al., 2000; Delgado Ruz and Schultz, 2014; Anastassiou et al., 2015), spatial relationship to the recording electrode (Barthó et al., 2004; Gold et al., 2006), and dendritic morphology (Pettersen and Einevoll, 2008). For example, waveform characteristics can indicate whether the recording site is near the soma, axon, or dendrite (Fig. 1B) while also offering clues about the neuron's function, e.g., excitatory versus inhibitory (Simons, 1978; McCormick et al., 1985; Barthó et al., 2004; Merchant et al., 2008; Johnston et al., 2009; Sukman and Stark, 2022) or feature-specific dynamics (Oemisch et al., 2015, 2019; Ceccarelli et al., 2023).

Biophysics and variations of extracellular spike waveforms. A, The biophysical phases of the extracellular waveform (blue) are approximately associated with its intracellular waveform (red) and closely associated with the inverted derivative of the intracellular waveform (dotted-red), at least for the negative phase. The phases of the intracellular waveform are described as (1) resting membrane potential, (2) depolarization, (3) repolarization, and (4) hyperpolarization. These illustrations are inspired from Henze et al. (2000). B, Schematic illustration of three example neurons: (i) cortical pyramidal, (ii) inhibitory, and (iii) thalamic pyramidal. The schematic illustrates varying waveform shapes from different spatial locations on a multielectrode array recording (gray). Note that the spike shape varies between neuron types and timing depends on the distance from the cell body. C, Several examples of extracellular waveforms that have not been well documented.
Recently, technological advancements have facilitated more comprehensive waveform sampling and expanded the diversity and complexity of observed spike waveforms. These advancements include improved electrode technology that enable dense and simultaneous recordings from thousands of sites [such as the Utah probe (Nordhausen et al., 1994), Neuropixels (Jun et al., 2017; Steinmetz et al., 2018; Ye et al., 2025), Neuroscroll (Liu et al., 2024), polymer array (Chung et al., 2019), ultraflexible arrays (Zhao et al., 2023)] as well as sophisticated spike-sorting algorithms that enhance the accuracy and resolution of spike detection from neural recordings (Buccino et al., 2022; Meyer et al., 2024). Studies utilizing these new tools have led to the characterization of coordinated spiking interactions between neurons (Barthó et al., 2004; Stevenson and Kording, 2011; Molden et al., 2013) and previously underreported spike types, including backpropagating spikes (Jia et al., 2019), doublet spikes (Murphy et al., 2020), fibers of passage spikes (Robbins et al., 2013; Sun et al., 2021; Sibille et al., 2022, 2024), and compound spikes (Sun et al., 2021; Jung et al., 2023). In addition, computational simulations have proven invaluable in studying extracellular spike waveforms, with tools like LFPy (Hagen et al., 2018) and NEURON (Hines and Carnevale, 1997) allowing researchers to simulate and study the effects of neuronal morphology, electrode position, and filtering on these waveforms. With deeper insights into the spatial and functional properties of neurons, researchers have shed light on their roles in communication and circuit dynamics.
Given the rapid progress in recording techniques, it is essential to review the many types of extracellular waveforms that have been described. We will catalog the waveforms, explain their biophysical origins, and discuss their implications for neuron localization and classification methods. While this review primarily focuses on cortical extracellular spike waveforms, the principles and mechanisms discussed are intended to be broadly applicable across brain regions and species. We do not examine in detail specialized waveforms such as Purkinje cell complex spikes or motor-unit potentials (e.g., the unusually high-amplitude spike waveform of Betz cells: Nolan et al., 2024), which have distinct biophysical origins specific to their respective structures, nor calcium spikes, which are nonsynaptic events that can contribute to the extracellular field (reviewed extensively in Ali and Kwan, 2019). Instead, our aim is to provide a generalized framework for interpreting extracellular spike shapes that can be broadly applied across various brain recording contexts. Most of the descriptions are not species-specific, as the fundamental biophysical processes underlying extracellular spikes (e.g., ion channel composition, membrane properties, and cellular morphology) are mostly conserved across species, but any species-dependent characteristics will be explicitly stated where relevant. By providing an accessible and comprehensive guide for researchers, we hope to enhance the interpretation of neural recordings, improving accuracy and promoting further contributions to the field.
Variations of Extracellular Spike Waveforms
Extracellular spikes, defined as voltage changes generated during action potentials, reflect neuronal activity from the aggregate electrical signals of a neuron within a specific volume of the tissue, which can indicate key aspects of the neuron's morphology, connectivity, and identity. The waveforms vary significantly based on multiple factors, including the types of ion channels, the relative position of the recording electrode and neuron, membrane capacitance, and the geometry of the neuronal architecture (Pettersen and Einevoll, 2008). This geometric arrangement of somatic, dendritic, and axonal compartments is particularly important because surrounding neuronal activity can influence the shape of a neuron's extracellular spike, often making it unique and difficult to interpret when spike sorting.
In this section, we will first describe the waveform characteristics observed when recordings are made close to the cell body, where waveforms are negative-dominant. We then outline how these waveforms change as the recording site moves farther from the soma, becoming increasingly positive-dominant (Fig. 1B). Along the way, we highlight reported waveform variations found in the literature. While we provide a general overview of the relevant biophysical mechanisms, more detailed explanations can be found in related articles (Heinricher, 2004; Bean, 2007; Buzsáki et al., 2012; Merchant et al., 2012; Einevoll et al., 2013). For a summary of all extracellular spike types referenced in this review, see Table 1.
Summary of types of extracellular spike shapes referenced in this review
Before describing specific waveform types, it is important to clarify that the atypical waveforms presented in this review are not the result of unresolved multiunit activity. These waveforms have been consistently reported after rigorous spike sorting and manual confirmation of single-unit isolation. Their inclusion here reflects accumulating evidence that these morphologies can arise from single-unit sources rather than from overlapping spikes of multiple neurons. Even so, careful evaluation of isolation quality remains essential when interpreting any extracellular waveform. Additionally, some waveforms have been reported to arise from multiple physiological mechanisms, and the studies reporting them provide complementary insight into their biophysical origins.
Negative-spiking waveforms
When a recording is made close to the soma of a neuron, the waveform has a fast initial negative trough, followed by a smaller and slower positive phase (Fig. 2A). These waveforms, commonly referred to as negative spikes, approximate the inverted intracellular somatic action potentials (for reviews, see Johnston and Wu, 1994; Bean, 2007; Drukarch and Wilhelmus, 2023): the initial negative trough reflects the influx of sodium (Na+) ions during depolarization, while the subsequent positive phase corresponds to the efflux of potassium (K+) ions during repolarization (Fig. 1A). This extracellular signal is strongest at the axon initial segment (AIS; Holt and Koch, 1999; Bakkum et al., 2019; Emmenegger et al., 2019) but is often referred to as a somatic spike due to its close association with the somatic intracellular action potential. Figure 2, B and C, illustrates the inferred recording locations and AIS waveform as the action potential is generated and propagates through the neuron.
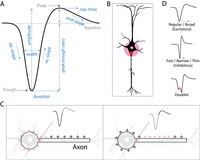
Negative-spiking extracellular waveform. A, The classical extracellular negative waveform (black) is commonly identified by its large trough and smaller and slower peak. Several waveform features (blue) have been used in the literature to classify negative waveforms. B, Negative waveforms are normally recorded near the AIS of the neuron (pink). C, Illustration of the effects of current sources and sinks on waveform shape as an action potential propagates from the soma to the axon. As the neuron depolarizes at the soma (left), the membrane under the electrode serves as a current sink (a negative deflection in the waveform). As the action potential propagates down the axon, the neuron hyperpolarizes, producing a positive deflection in the waveform. This illustration (and the following in Figs. 3C, 4C) is inspired from Heinricher (2004). D, From top to bottom, negative waveforms are typically subtyped into regular/broad (associated with excitatory neurons), fast/narrow/thin (associated with inhibitory neurons), and doublet (a rare subtype of neurons that are functionally intermediate).
It was initially proposed from theory that the extracellular negative spike approximates the negative derivative rather than the inverse of the intracellular action potential (because extracellular recordings measure voltage changes caused by transmembrane currents, not the membrane voltage itself: Rall and Shepherd, 1968; Meszéna et al., 2023), evident in in vitro studies (Anastassiou et al., 2015). However, an in vivo study in the rodent hippocampus reported that only the first negative component of the extracellular waveform, corresponding to the depolarization phase, is consistent with the first derivative of the intracellular waveform (Henze et al., 2000; Fig. 1A, red-dotted waveform). As noted by the authors, this discrepancy arises because the extracellular waveform reflects the combined influence of surrounding currents in the extracellular space (e.g., capacitive, ionic, and leak currents) across a morphologically complex membrane. Nonetheless, the extracellular waveform retains informative features that can be used to infer properties of the underlying intracellular action potential (Henze et al., 2000).
Common variations in negative spikes lie in their duration (length of the waveform) and peak amplitude. Longer waveform durations (broad-spiking or regular-spiking) are typically associated with pyramidal and spiny stellate excitatory cells. In contrast, shorter waveform durations (narrow-spiking or fast-spiking) are characteristic of inhibitory interneurons (e.g., basket and chandelier cells; Barthó et al., 2004; Mitchell et al., 2007; Niell and Stryker, 2008; Merchant et al., 2012; Mruczek and Sheinberg, 2012). Figure 2D gives examples of the two types. The difference in waveform length arises from the distinct expression of Na+ and K+ ion channels within each cell type. Specifically, fast-spiking neurons express Kv3 and Kv1 channels, which enable rapid repolarization (Martina et al., 1998; Bean, 2007). The functional differences between regular and fast spikes have been studied extensively and range from firing statistics (e.g., frequency, burstiness, Fano factor) to response dynamics (e.g., stimulus–response, synchronous fluctuations in local field potentials), which has been essential for understanding the cell-type–specific function of neuronal circuits (Baeg et al., 2001; Ardid et al., 2015; Oemisch et al., 2015, 2019; Trainito et al., 2019; Onorato et al., 2020; Banaie Boroujeni et al., 2021; Ceccarelli et al., 2023).
Several methods have been developed to classify negative-spiking waveforms, as follows (Fig. 2A, blue labels):
-
Duration: the time between the negative trough and the subsequent peak
-
Peak-to-trough ratio: the ratio between the amplitudes of the negative trough and the following positive peak, both measured relative to the baseline
-
Width: the width of the negative trough (usually calculated at the midpoint between the baseline and the trough's minimum)
-
Amplitude: the unsigned difference between the minimum and maximum
-
Slope gradient: the gradient at time x of the waveform before the trough (depolarizing slope), following the trough (recovery slope or repolarizing slope) and following the peak (end slope or hyperpolarizing slope)
-
Repolarization time: time from peak to the following inflection point during hyperpolarization
To differentiate regular- and fast-spiking populations, the spike duration is typically used to separate the cell population bimodally (e.g., determine whether the population is distributed bimodally and then finding the dip; McCormick et al., 1985; Freund and Buzsáki, 1996; Mitchell et al., 2007; Niell and Stryker, 2008; Sukman and Stark, 2022). Indeed, using optogenetics as ground truth, a near-perfect classification between excitatory (pyramidal) and inhibitory (parvalbumin) cells was obtained using only spike duration (Sukman and Stark, 2022). However, it is preferable to classify populations using two techniques, such as comparing end slope and peak-to-trough ratio (Niell and Stryker, 2008; Sun et al., 2021; Jung et al., 2023), width and duration (Barthó et al., 2004), or duration and repolarization time (Ardid et al., 2015; Oemisch et al., 2019; Trainito et al., 2019; Banaie Boroujeni et al., 2021). In addition to waveform shape, electrophysiological properties have been used to distinguish cell types. These include the basal firing rate (Merchant et al., 2008; Ardid et al., 2015), autocorrelogram features such as peak timing and shape, and crosscorrelogram features, for example, a short-latency peak (<3 ms) following a presynaptic spike suggests excitation, and a short-latency trough suggests inhibition (Barthó et al., 2004; Merchant et al., 2008).
Combining multiple features is important because spike duration alone can be unreliable. Notably, pyramidal neurons in the awake monkey motor cortex can produce narrow spikes (Vigneswaran et al., 2011; Kraskov et al., 2019, 2020), likely due to the expression of a specific potassium channel (Kv3.1b) that is not present in rodents. Conversely, some interneurons have been reported to produce broad spikes (for review, see Lemon et al., 2021). In addition, modeling studies suggest that spike duration can be influenced by the distance between the recording electrode and the neuron; as the distance increases, spikes become broader (Gold et al., 2006, 2007; Buzsáki et al., 2012). Together, these findings underscore the need for multifeature analyses in classification for reliable cell-type classification, as discussed later.
Besides the commonly reported regular- and fast-spiking waveforms, there have been several other varieties of negative-spiking waveforms reported in the literature. First, regular and fast waveforms have been subdivided based on their shape or physiological properties (Merchant et al., 2008; Ardid et al., 2015; Trainito et al., 2019; Lee et al., 2021). For example, the utilization of multichannel electrodes (see the seminal works of Wise et al., 1970; Legatt et al., 1980; Barna et al., 1981; BeMent et al., 1986; Nicolelis et al., 1997; Ulbert et al., 2001; Logothetis et al., 2007) made it possible to measure features associated with traveling waves of current sinks and sources along multichannel arrays positioned close to apical dendrites (Bereshpolova et al., 2007; Jia et al., 2019). This provided insight into the temporal profile of the spatiotemporal waveforms, with one report identifying a distinct class of backpropagating regular-spiking units in mice using this strategy (Jia et al., 2019).
Another rare waveform is doublet spiking, which consists of two closely spaced negative troughs, reflecting the near-simultaneous generation of action potentials (Murphy et al., 2020; Sun et al., 2024). Modeling studies attribute the resulting notch-like waveform to mechanisms such as somatic or somatodendritic coupling (Michalikova et al., 2018) or to reduced somatic excitability, which reveals a spike sequence beginning at the AIS, followed by an active dendritic spike and a passive somatic response (López-Jury et al., 2018). It is also speculated that this waveform may also result from distal inputs (dendrites, axons, somas; described as W-shaped) when spatially and temporally separated components of an action potential propagate through different neuronal compartments (Holt and Koch, 1999; Gold et al., 2006) or from converging afferent activity onto the same neuron (Murphy et al., 2020). Such doublet spikes have been observed in the ferret thalamus, where they appear influenced by rare retinal ganglion cells, suggesting that these waveforms may represent an intermediate neuronal subtype (Murphy et al., 2020).
Triphasic-spiking waveforms
As the recording site moves further from the cell body, the negative trough decreases in amplitude, and a positive peak preceding it emerges. This pattern creates three distinct phases (Fig. 3A): (1) an initial positive peak that is sometimes referred to as a prehyperpolarization peak (prepeak), resulting from a positive current source at specific locations of the dendritic tree and axon; (2) a negative trough, driven by Na+ ion influx during intracellular depolarization; and (3) a final positive rebound, sometimes referred to as a posthyperpolarization peak (postpeak), caused by K+ ion efflux during intracellular repolarization.

Triphasic extracellular waveform. A, The extracellular triphasic waveform (black) is commonly identified by its initial positive peak (prepeak, arising from a positive source: return/capacitive currents or a current source from the propagating action potential; Fig. 5), a large trough (depolarization), followed by a second peak (postpeak, posthyperpolarization). B, Triphasic waveforms are typically recorded away from the AIS, near the dendrites and axon (pink). C, Schematic of current sources and sinks on the triphasic waveform. As the action potential traverses from the soma and through the axon (or dendrite), the membrane under the electrode serves as a source (positive deflection; left inset), followed by a sink (negative deflection; middle inset), and finally a source again (positive deflection; right inset). As a result, the electrode (pink) records a triphasic waveform. D, Variations in triphasic waveforms. Common shapes include lower-amplitude prepeak or postpeak (left). Narrow and broad triphasic waveforms have been classified (middle). Triphasic waveforms characterized by very low amplitude and extended durations have been reported and are referred to as compound spiking (right).
Notably, the last two phases resemble those of negative-spiking waveforms. Triphasic spikes are typically narrower than negative spikes (Robbins et al., 2013; Someck et al., 2023) and are often identified by the relative amplitude of the initial positive peak (e.g., >10% of the trough's amplitude: Sun et al., 2021; Jung et al., 2023; Liu et al., 2024).
Because the positive prepeak is associated with either dendritic return currents or local current sources at the axon (see the section Biophysical explanations for the prepeak phase), triphasic waveforms are likely to originate from locations distal to the cell body (Fig. 3B). These sites of origin for triphasic spikes have been verified in in vitro culture studies (Bakkum et al., 2013, 2019; Pan et al., 2014; Lewandowska et al., 2015; Deligkaris et al., 2016) and in vivo cortical studies, specifically in dendritic (Someck et al., 2023) and axonal locations (Robbins et al., 2013; Sun et al., 2021; Sibille et al., 2022, 2024). Additionally, in vivo studies have shown triphasic spikes occurring in synchrony with or just before spikes from inhibitory units (Someck et al., 2023), while other studies have reported triphasic spikes with functional properties distinct from the local recording area, suggesting axonal activity originating from cell bodies located outside of the recording area (discussed further in a later section; Robbins et al., 2013).
Although triphasic waveforms are observed and studied less than negative waveforms, variations include broad or narrow triphasic waveforms (Lee et al., 2021), and one rare variation referred to as compound spiking (Sun et al., 2021; Jung et al., 2023; Fig. 3D). Compound spikes are characterized by small amplitudes, multiphasic shape, short stimulus–response latency, and abnormally long waveforms. The combination of these properties suggests they may result from synchronous activity of multiple sources, such as overlapping local dendrites and axons whose signals are combined at the recording site, or from coupled neurons (either local or distal) firing in synchrony, producing a composite spike waveform. If the latter, these complex waveforms may reflect intermediate neural activity states, functionally similar to doublet spikes, as described earlier. These waveforms may also be spikelets: waveforms thought to result from failed action potential generation at the soma, characterized by smaller and broader shapes than full spikes, as shown in simulations (Michalikova et al., 2018).
Positive-spiking waveforms
As the name suggests, positive-spiking waveforms are characterized by a prominent positive peak with an amplitude that exceeds the accompanying negative trough and, in some cases, a smaller positive peak (Fig. 4): (1) an initial large positive peak that can be explained in the same way as in triphasic spikes (see the section Biophysical explanations for the prepeak phase); (2) a negative trough that reflects membrane depolarization; and (3) a small positive peak that reflects membrane repolarization/hyperpolarization, which usually has minimal contribution to the positive waveform.

Positive extracellular waveform. A, The extracellular positive waveform (black) is identified by its large initial peak (return current or current source), a large trough (depolarization), and then sometimes followed by a second peak (posthyperpolarization peak). B, Positive waveforms are typically recorded distally from the AIS, near the dendrites and axon (pink). C, Schematic of current sources and sinks on the positive waveform. The process is similar to the triphasic waveform (Fig. 3C), but the recording electrode is more distal. D, Several subtypes of positive waveforms have been reported. Biphasic-positive waveforms are the most commonly reported positive waveforms, followed by positive-multiphasic or M-shaped, and finally, rarer HAPS. E, Schematic of positive and triphasic waveforms reflecting fibers of passage activity. As action potentials propagate along the afferent axon originating from distal brain areas (purple), a positive or triphasic waveform can be detected from the electrode (pink) in the recorded brain area (red).
Studies have shown that positive spikes, like triphasic spikes, reflect neural sources distal from the soma, likely in the dendrites and axons (Fig. 1B; Holt and Koch, 1999; Gold et al., 2006; Buzsáki et al., 2012). This distal source of positive waveforms has been observed in in vitro culture studies, where positive spikes were detected near axons and dendrites (Bakkum et al., 2013, 2019; Pan et al., 2014; Lewandowska et al., 2015), and in vivo studies that have reported positive and triphasic spikes are more frequently detected in white matter areas compared with gray matter areas (Hubel, 1960; Someck et al., 2023; Liu et al., 2024).
Positive spikes exhibit a variety of shapes and forms. As mentioned before, the most common type is positive-biphasic, with a large initial positive peak and then a smaller negative trough (Fig. 4D, left). Although modeling studies typically show a significantly smaller amplitude of positive spikes than negative spikes generated from the AIS (Holt and Koch, 1999; Gold et al., 2006; Buzsáki et al., 2012), in vivo studies have documented amplitudes from positive spikes comparable to those of negative and triphasic spikes (Gold et al., 2009; Sun et al., 2021; Paulk et al., 2022; Jung et al., 2023; Liu et al., 2024).
One positive-spiking variation worth noting is high-amplitude positive spikes (HAPS), reported in vivo in the cat visual cortex. These waveforms are up to three times larger in amplitude than corresponding negative spikes (Gold et al., 2009). HAPS have a large initial positive peak (capacitive/return phase), a moderate negative trough (Na+ phase), and then a weak positive phase (K+ phase; Fig. 4D, middle). The unexpectedly large amplitude of these spikes exceeds predictions from standard biophysical models, suggesting that additional unknown mechanisms may be involved and that there is a significant gap in the understanding of spike generation.
Another variation in positive spike waveforms is known as positive-multiphasic spike and consists of two prominent positive peaks surrounding a smaller negative trough, forming an M-shape (Fig. 4D, right). Although these spikes have not been extensively studied, they have been frequently found among positive-biphasic spikes in several species and brain regions, including the cat visual cortex (Sun et al., 2021), human cortex (Paulk et al., 2022), macaque cortex (Liu et al., 2024; Sun et al., 2024), and rodent cortical cultures (Bakkum et al., 2013).
The underlying biophysics of positive-multiphasic spikes remains uncertain. While their three phases resemble triphasic spikes (capacitive, Na+ and K+ phases), the unusually large second positive peak is inconsistent with standard extracellular models—the posthyperpolarization phase should always be smaller than the negative trough. Why is the second positive phase so large in positive-multiphasic spikes? We could not find any studies that can clearly explain this, but we speculate that the large second positive peak may be from impinging distal dendritic or axonal activity (Holt and Koch, 1999; Gold et al., 2006, 2007). Notably, however, based on an in vitro study, similar M-shaped spikes were reported to become more prevalent as recording times extended, perhaps suggesting a link to cellular pathology (Lewandowska et al., 2015). Additionally, it was noted that stimulation of two neighboring electrical sources produced similar complicated spike waveforms (Lewandowska et al., 2015). These positive-multiphasic spikes highlight the complexity of extracellular waveforms, underscoring the need for further research to understand the biophysics of spike generation.
Biophysical explanations for the prepeak phase
Both triphasic and positive waveforms are defined by a prominent prepeak. Having reviewed their phenomenology, we now turn to the underlying biophysical explanations that have been proposed for this feature.
The initial positive prepeak in triphasic and positive extracellular waveforms has been explained in the literature by two main mechanisms. The first explanation is that the prepeak reflects return currents, also referred to as capacitive currents. As an action potential begins at the AIS, positive Na+ ions flow into the cell. To maintain charge balance, positive charge flows out elsewhere. This outward current creates a positive potential in the extracellular space, which is detected by the electrode, typically at the dendrites (Holt and Koch, 1999; Gold et al., 2006, 2007, 2009; Buzsáki et al., 2012; Einevoll et al., 2013; Gulyás et al., 2016; Bakkum et al., 2019; Emmenegger et al., 2019; Bestel et al., 2021). As explained by Holt and Koch (1999), “current flowing in through the [axon] initial segment must flow out somewhere in the cell.” Figure 5 (top) provides an illustration of dendritic return currents. The second explanation is that the positive prepeak results from a current source/sink effect (for reviews on current source and sinks, see Mitzdorf, 1985; Buzsáki et al., 2012). Here, the electrode is near a part of cell membrane, typically axons, that is acting as a current source, sending current out into the extracellular space to help depolarize another part of the membrane farther away to support propagation. In other words, as the neuron depolarizes at the site of action potential initiation (due to Na+ influx), “the electrode will register a positive potential as the membrane under the electrode serves as a current source for the depolarized membrane some distance away” (Heinricher, 2004). Similarly, Barry (2015) notes that the nodes of Ranvier between myelinated segments of an axon generate a positive current as the action potential propagates past the stationary electrode. Both mechanisms result in a positive deflection before the negative trough but with different underlying biophysics. Return/capacitive currents are more related to dendritic balancing, while current source effects come from the geometry of the propagating action potential along the axon. Figure 5 (bottom) provides an illustration of current sources and sinks along an axon.

Schematic of return/capacitive currents and current source effects. Red, The extracellular spike is generated near the soma and strongly detected at the AIS. Top, Return currents (blue) describe an outflow of positive charge toward the dendrites (blue) due to the rebalance of current from the dominantly negative spike at the AIS. Bottom, The current source effect comes from the propagating action potential (red) along the axon. As the action potential traverses from the soma through the axon, negative current will flow inside the axonal membrane (negative intracellular current), while positive current exits the axonal membrane (positive extracellular current), providing a current source. The initial positive current source is indicated by the purple arrow and corresponds to the positive prepeak observed in triphasic and positive waveforms. Schematics were inspired by Heinricher (2004), Barry (2015), and Gulyás et al. (2016). All polarity signs refer to currents in the extracellular space.
Positive and triphasic waveforms are recordings from preceding areas
Early in vivo studies reported positive spikes (also called “fiber spikes”) in white matter regions (Hubel, 1960). Because these spikes were initially thought to reflect axonal activity, they were largely overlooked in subsequent studies, leaving them without clear functional classification. With the development of MEAs, which enable simultaneous recordings from multiple regions, it became increasingly difficult to ignore them.
Recent studies comparing the functional responses of positive- and triphasic-spiking units (nonsomatic activity) with negative-spiking units (somatic activity) highlight notable differences (Robbins et al., 2013; Sun et al., 2021; Sibille et al., 2022, 2024). Such studies (Sun et al., 2021; Sibille et al., 2022, 2024) found that nonsomatic spikes in one recorded brain area exhibited features characteristic of the upstream (or preceding) area. These units also exhibited shorter response latencies to the stimulus than the negative-spiking units, leading to the hypothesis that some nonsomatic waveforms are axonal recordings whose cell bodies originate in the upstream area.
This hypothesis was tested using silencing experiments in which neural activity in the recording region was selectively suppressed while extracellular activity was simultaneously monitored. During suppression, all negative-spiking units disappeared and only the nonsomatic waveforms (positive and triphasic) remained, all with functional features of the preceding area (Sun et al., 2021; Sibille et al., 2022, 2024). Such silencing experiments have shown triphasic spikes recorded in the rat hippocampus related to axons originating from distal brain areas (Robbins et al., 2013; Barry, 2015), positive and triphasic spikes in the cat visual cortex that exhibited functional and spiking features of the upstream lateral geniculate nucleus, and triphasic spikes in the mouse superior colliculus and visual cortex that were associated with activity in their preceding areas of retinal and thalamocortical axons, respectively (Sibille et al., 2022, 2024). Together, these in vivo studies strongly indicate that spike waveforms with a prominent positive prepeak (positive and triphasic spikes) reflect spikes from projecting axons with their cell bodies in distal brain areas.
Waveform Classification Methods
Having reviewed extracellular spike shapes, we now turn to the common methods used to classify them. It is important to note that this classification process differs from spike sorting (sometimes referred to as spike classification). While the two are related, waveform classification specifically refers to categorizing spike shapes after they have been isolated as single units. It is crucial to emphasize that high-quality single–unit isolation through spike sorting is essential for accurate waveform shape characterization and reliable classification (Vincent and Economo, 2024). Here, we focus on the classification of single-unit types based on their spike waveforms, after spike sorting has been performed.
As mentioned earlier, traditional classification relies on specific waveform features, incorporating spike duration, gradients, and peak ratios (Fig. 2A), and extrinsic electrophysiological properties, such as spiking statistics. Typically, two of these features are selected to create a two-dimensional feature space, followed by unsupervised classification using clustering algorithms. For example, applying k-means clustering to the posthyperpolarization slope and peak-to-trough ratio (Fig. 6A, example illustration; Niell and Stryker, 2008) or using a Gaussian mixture model to classify negative waveforms based on trough-to-peak duration and repolarization time (Trainito et al., 2019). Some studies have extended this approach to three-dimensional feature spaces to identify neuron classes with distinct physiological properties, such as those in the monkey prefrontal cortex (Asadi et al., 2025). While these methods are effective for distinguishing functionally distinct classes from negative-spiking waveforms, they may not capture the full diversity of extracellular spike shapes.

Schematics of common waveform classification techniques. A, Negative waveform classification involves identifying two key features (top inset), projecting them into a 2D feature space (middle inset), and clustering them into regular/broad (blue) and fast/narrow (orange) categories (bottom inset). B, Decision-tree classification. This process also uses traditional waveform features to filter out waveform types in a step-by-step process (like conditional statements). In this example illustration, waveforms with a larger peak than trough are positive, then waveforms with a peak-to-trough ratio >0.1 are triphasic, and then the remaining can be split into regular and fast based on their duration. C, Automated clustering algorithms can explore nuanced waveform types. An example automatic clustering pipeline includes dimensionality reduction of spike waveforms (e.g., principal components analysis), processing through a clustering algorithm (e.g., graph-based clustering or shared nearest neighbor), and sorting into waveform groups.
In some studies, a decision-tree classification system has been used to incorporate various spike shapes, relying on waveform features from traditional literature (Sun et al., 2021; Jung et al., 2023; Liu et al., 2024). This method involves a step-by-step classification process, where waveforms are grouped based on specific criteria at each step. For example, positive spikes (where the peak amplitude exceeds the trough) may be identified and filtered out first followed by triphasic spikes (which exhibit a significant prepeak). The remaining waveforms can then be classified into regular- and fast-spiking units (Fig. 6B). These steps can be adapted to suit the researcher's preference. However, this method requires prior knowledge of waveform types and can become problematic when significant differences in waveform features exist between species or brain regions.
While user-specified methods have successfully identified functionally distinct classes, choosing features in a principled way remains challenging. Different studies often select different features, resulting in inconsistent classifications. This inconsistency makes it difficult to compare putative cell types across studies and hinders the development of standardized classification.
Attempts at objective classification
Traditional methods often rely on one or two features, which oversimplifies the diversity of neuronal types. In contrast, multidimensional approaches incorporate voltage sampling points that span the length of the extracellular waveform, providing a less subjective assessment of cell types. These methods allow a more nuanced identification of the underlying waveform structure than earlier feature-based methods (Carr et al., 2025; Lopez-Peco et al., 2025). Notable examples include supervised algorithms like LOL-CAT that maps spiking patterns to transcriptomic cell types (Schneider et al., 2023) and unsupervised learning approaches like WaveMAP (Lee et al., 2021, 2023; Fig. 6C), which applies nonlinear dimensionality reduction with graph-based clustering. Inspired by methods from gene transcriptomics (Hao et al., 2024), WaveMAP identifies putative cell types directly from waveform shape without relying on predefined features, enabling the discovery of novel neuronal classes across datasets with minimal prior assumptions.
Beyond waveform shape, recent multimodal approaches integrate spiking dynamics with the extracellular waveform to enhance classification. For example, incorporating interspike interval (ISI) distributions has proven effective in identifying novel neural populations (Abbaspoor and Hoffman, 2024; Yu et al., 2024; Gonzalez-Ferrer et al., 2025). Other strategies combine ISI with poststimulus time histograms (Lee et al., 2024) or use anatomical localization to constrain classification (Beau et al., 2025). These integrative approaches further improve the sensitivity and specificity of extracellular waveform classification by capturing both structural and functional signatures of neuronal subtypes.
Other promising machine learning-based pipelines for classifying extracellular spike waveforms use a combination of unsupervised and supervised methods (Druckmann et al., 2013; Lopez-Peco et al., 2025) that outperform traditional feature-based methods and capture a wider diversity of extracellular waveform shapes. For in-depth reviews of the capabilities of machine learning and artificial intelligence in spike classification, refer to Sharifrazi et al. (2024) and Stringer and Pachitariu (2024).
Importantly, automated methods also come with some caveats. One is the requirement to have large, high-quality datasets. These methods can struggle to produce reliable results when using waveform data with small populations or with sparse, noisy, or poorly annotated spikes. Another drawback is that automated methods can be less interpretable than traditional approaches. For example, while deep learning models have shown strong performance in classifying extracellular spike waveforms, they often operate as “black boxes,” making it challenging to know which waveform features drive the classification. This limits our ability to validate these models biologically, especially when distinguishing subtle differences between waveform subtypes or when comparing across datasets and species. Finally, reproducibility can pose a challenge. The reliance on algorithms means that reproducing results may require precise replication of model parameters, datasets, and computational environments, which is not always feasible (for reviews on limitations, see Angermueller et al., 2016; Sharifrazi et al., 2024).
Choosing a classification method
Each classification method offers unique advantages, and careful consideration is needed when selecting the appropriate one for a given study. The increasing availability of advanced classification tools ensures that researchers have a wide range of options, but this abundance also introduces complexity and underscores the importance of selecting the method that aligns with the study's specific goals. Such methods include traditional feature-based classifiers, decision-tree approaches for distinguishing known waveform categories, and automated clustering algorithms for exploring high-dimensional waveform structure (Box 1).
Selecting an appropriate classification strategy depends on dataset characteristics and the specific scientific question. Below we outline some practical guidelines for choosing such approaches.
Classifying negative-spiking units into regular- and fast-spiking types.
When the dataset contains only negative waveforms and the objective is to distinguish broad/regular-spiking (typically excitatory) from narrow/fast-spiking (typically inhibitory) neurons, traditional feature-based methods are often sufficient. Metrics such as trough-to-peak duration and end slope have long been used for this purpose (Niell and Stryker, 2008). However, recent work indicates that automated clustering approaches can provide improved accuracy and reproducibility (Lopez-Peco et al., 2025).
Distinguishing known waveform classes.
If the goal is to identify known waveform classes, such as somatic and nonsomatic activity, decision-tree–based classification offers a flexible and interpretable approach (Sun et al., 2021; Liu et al., 2024). These methods demonstrate that clear feature thresholds (e.g., peak-to-trough ratios, polarity criteria) enable consistent classification across datasets.
Discovering the full diversity of waveform types.
To explore the full diversity of waveform types and uncover previously unreported neuronal subpopulations, automated clustering methods are preferable. These approaches (e.g., dimensionality reduction and graph-based clustering) can capture subtle, multifeature relationships that traditional metrics may miss (Lee et al., 2021, 2024; Paulk et al., 2022; Lopez-Peco et al., 2025). These methods are particularly well suited for large, heterogeneous datasets obtained with modern high-density probes.
Given the wide variability in classification techniques and the growing diversity of waveform types being discovered, the major challenge in this field is the lack of a standardized approach for cell-type classification. While many methods have been validated in specific contexts, their performance can vary depending on the quality of the dataset and biological variability (e.g., brain regions, species). Without consistent methodologies, it is difficult to compare results across studies or build cumulative knowledge. This variability underscores the need for a standardized classification framework: a gold standard. Establishing a standard for waveform classification would enhance reproducibility, improve cross-study comparisons, and accelerate the field's progress toward understanding the full diversity of neuronal cell types.
Here, we emphasize that a standardized classification framework does not imply a single method for all datasets. Different analytical approaches remain appropriate for different goals. Instead, our aim is to promote consistent definitions of waveform categories, clearly described feature metrics, and clear reporting and validation criteria (e.g., preprocessing, classifier boundaries) so that classifications remain comparable across studies, even when different methods are used.
The influence of signal processing
The effects of signal processing filters on waveform shape should not be overlooked. Filters can substantially alter the waveform shape, sometimes broadening, introducing additional phases, causing phase distortions, or smoothing that can affect spike shape and obscure biologically relevant spike features (Quian Quiroga, 2009; Yael and Bar-Gad, 2017). For example, filtering processes can transform biphasic spikes into triphasic spikes, suggesting that certain multiphase waveforms could be partially artifactual rather than reflecting the underlying biophysical mechanisms (Someck et al., 2023). To mitigate these distortions, methodological choices such as selecting optimal cutoff frequencies (Wang et al., 2023) or wavelet-based filtering (Wiltschko et al., 2008) are crucial for waveform characterization. This highlights the sensitivity of signal preprocessing pipelines and spike-sorting outcomes (for review, see de Cheveigné and Nelken, 2019).
Sampling Bias in Recordings
Differences between multichannel and single-channel recordings are often attributed to sampling bias. Studies have shown that manually controlled single-channel electrodes, combined with a search-stimulus (i.e., stimulus presentation while advancing the electrode through the brain and stopping when a responsive unit is encountered), may introduce a selection bias toward neurons favored by the user (Talebi and Baker, 2016; Sun et al., 2021). This bias is minimized by dense multichannel recordings (e.g., Neuropixels: Steinmetz et al., 2018), which capture a larger diversity of waveform shapes and offer a more comprehensive sampling of the extracellular space.
To illustrate this bias, consider an analogy: using a single electrode with a negative threshold is like fishing with a rod and bait targeted for specific species, whereas multichannel recordings act more like a fishing net that captures a wide variety of species. Recent studies using dense multielectrode probes, capable of recording from thousands of locations simultaneously, have revealed the vast diversity of extracellular spike waveforms (Bakkum et al., 2019; Steinmetz et al., 2021; Paulk et al., 2022; Liu et al., 2024). However, multichannel electrodes are not free of biases. Specifically, neurons that are larger with stronger extracellular signals, exhibiting higher firing rates, or responsive to the particular stimulus will be preferentially detected (Towe and Harding, 1970; Olshausen and Field, 2005). This idea that stronger signals are more likely to be detected may explain why reported positive spikes are more frequently associated with axons originating from distal areas rather than those originating locally. Longer axons tend to have larger diameters (Tomasi et al., 2012; Basu et al., 2023), which increases conductance and generates stronger extracellular signals that are more readily detected (FitzGerald et al., 2008). Therefore, even with a wider net, the recorded neural sample is not completely unbiased, highlighting the need for complementary approaches and careful methodological consideration.
Another potential source of bias in extracellular waveform classification is the spike-sorting method. The simple and traditional threshold-based methods inherently introduce biases toward high-amplitude spikes. While modern spike-sorting methods can effectively improve accuracy in neural recordings, they still have their disadvantages (for reviews, see Buccino et al., 2022; Meyer et al., 2024). For example, template-matching methods like Kilosort (Pachitariu et al., 2024) improve overlap resolution but still struggle with bursty or fast drifting units, while other sorters, from simulated data, have shown biases related to the firing rate and certain neuronal types (Laquitaine et al., 2025). Additionally, modern spike sorters require parameter adjustments and manual curation to correct for clustering errors and ensure unit isolation, exposing the data to selection biases (Rossant et al., 2016). Vincent and Economo (2024) found that publicly available “well-sorted” units often represent multiunit activity rather than true single-unit recordings, potentially risking misclassification. This emphasizes the importance of single-unit isolation for reliable waveform classification and accurate cell-type identification. Multiunit contamination can alter waveform geometry or create apparent multiphasic events, and some laboratories may remove such units during manual curation. We include doublet, compound, triphasic, and positive-multiphasic waveforms here because multiple studies—using high-density MEAs, in vitro axonal recordings, and compartmental modeling—have shown that these shapes can be generated by single physiological sources rather than by overlapping units. Nonetheless, these atypical waveforms require cautious interpretation, and their presence in a dataset should always be evaluated in the context of isolation quality and recording conditions.
In summary, it is important to consider the possible biases when recording extracellularly, and overcoming these biases is crucial for reliable waveform classification and obtaining an understanding of neuronal populations.
Concluding Remarks and Future Perspectives
This review highlights the growing diversity of extracellular waveform types and their importance in understanding neural biophysics. From well-established classes like the negative regular and fast spikes to more complex shapes such as triphasic, positive, doublet, and positive-multiphasic spikes, each waveform provides valuable insight into the underlying properties of neural circuits. As recording technologies continue to advance, so too does our ability to detect and characterize these diverse signals, offering new opportunities to map the structure of neural circuits with greater accuracy.
In parallel, waveform classification methods have become increasingly sophisticated. While traditional approaches use specific waveform features for distinguishing cell types, recent machine learning tools enable a more nuanced, data-driven exploration of waveform diversity to uncover novel populations. Despite these advances, a major challenge remains: the lack of a standardized classification framework. Without consistency in methodology, it is difficult to compare results across studies or integrate findings into a unified understanding of cell types. Such a framework will improve reproducibility, reduce subjectivity, and support the wider application of waveform-based cell-type analysis for future research questions.
Looking ahead, several critical directions emerge. First, improving our understanding of extracellular spike biophysics could enhance the interpretation of related neural signals, such as electroencephalogram and local field potential recordings, thereby improving cross-modality integration. Second, as higher-density electrodes continue to reveal rare and previously uncharacterized waveform types, clarifying their roles in neural computation will be an important frontier. Third, because extracellular waveforms depend on neuronal architecture, changes in waveform shape may reflect alterations in the underlying biophysical and structural organization of the surrounding circuit. As such, waveform features have the potential to serve as sensitive indicators of tissue health, circuit integrity, or pathological remodeling in long-term recordings. Finally, electrophysiology methods must overcome current sampling biases that favor large, frequent, or stimulus-driven spikes. Optimizing recording, spike sorting, and classification pipelines to capture the full spectrum of neuronal activity is crucial for a complete understanding of neuronal circuitry.
In conclusion, extracellular waveform research is entering an essential phase. Advances in recording technologies, combined with more rigorous classification strategies, are opening the door to a fuller representation of neuronal diversity. By addressing current limitations, the field can move toward a more comprehensive understanding of how extracellular spikes reflect cellular and circuit-level dynamics. This progress will not only refine basic neuroscience but also strengthen the translational potential of extracellular recordings for brain–machine interfaces, diagnostics, and therapeutic applications.
Footnotes
- Received September 17, 2025.
- Revision received December 1, 2025.
- Accepted December 10, 2025.
-
S.H.S. was supported by William M. Wood Foundation, the National Eye Institute Award EY027888, the NIMA Foundation, and generous donations from Peter and Yayi Pezaris, Michael Gersh, and Don Good. M.R.I. was supported by the Australian Research Council Centre of Excellence for Integrative Brain Function (CE140100007). We thank Joanne Lee for her assistance with figure illustrations.
-
The authors declare no competing financial interests.
- Correspondence should be addressed to Michael R. Ibbotson at michael.ibbotson{at}unimelb.edu.au.
- Copyright © 2026 the authors




