SMARCA4 Loss and Mutated β-Catenin Induce Proliferative Lesions in the Murine Embryonic Cerebellum
- 1Department of Pediatric Hematology and Oncology, University Medical Center Hamburg-Eppendorf, Hamburg D-20251, Germany
- 2Research Institute Children’s Cancer Center Hamburg, Hamburg D-20251, Germany
- 3Bioinformatics Core, University Medical Center Hamburg-Eppendorf, Hamburg D-20251, Germany
- 4Institute of Neuropathology, University Medical Center Hamburg-Eppendorf, Hamburg D-20251, Germany
-
Author contributions: C.G., Melanie Schoof, D.H., and U.S. designed research; C.G., Melanie Schoof, and D.H. performed research; C.G., Melanie Schoof, and Michael Spohn analyzed data; C.G. wrote the paper.
Abstract
Almost all medulloblastomas (MB) of the Wingless/Int-1 (WNT) type are characterized by hotspot mutations in CTNNB1, and mouse models have convincingly demonstrated the tumor-initiating role of these mutations. Additional alterations in SMARCA4 are detected in ∼20% of WNT MB, but their functional role is mostly unknown. We, therefore, amended previously described brain lipid binding protein (Blbp)-cre::Ctnnb1(ex3)fl/wt mice by the introduction of floxed Smarca4 alleles. Unexpectedly, mutated and thereby stabilized β-catenin on its own induced severe developmental phenotypes in male and female Blbp-cre::Ctnnb1(ex3)fl/wt mice in our hands, including a thinned cerebral cortex, hydrocephalus, missing cerebellar layering, and cell accumulations in the brainstem and cerebellum. An additional loss of SMARCA4 even resulted in prenatal death for most mice. Respective Blbp-cre::Ctnnb1(ex3)fl/wt::Smarca4fl/rec mutants (male and female) developed large proliferative lesions in the cerebellum evolving from E13.5 to E16.5. Histological and molecular analysis of these lesions by DNA methylation profiling and single-cell RNA sequencing suggested an origin in early undifferentiated SOX2-positive cerebellar progenitors. Furthermore, upregulated WNT signaling, altered actin/cytoskeleton organization, and reduced neuronal differentiation were evident in mutant cells. In vitro, cells harboring alterations in both Ctnnb1 and Smarca4 were negatively selected and did not show tumorigenic potential after transplantation in adult female recipient mice. However, in cerebellar explant cultures, mutant cells displayed significantly increased proliferation, suggesting an important role of the embryonic microenvironment in the development of lesions. Altogether, these results represent an important first step toward the unraveling of tumorigenic mechanisms induced by aberrant WNT signaling and SMARCA4 deficiency.
Significance Statement
Our study shows the cooperative effects between activated Wingless/Int-1 (WNT) signaling induced by a stabilizing β-catenin mutation and a loss of chromatin remodeler SMARCA4 in driving the development of highly proliferative cerebellar lesions. This observation could have important implications for WNT medulloblastoma patients, who are frequently affected by both alterations with the functional role of SMARCA4 mutations in tumorigenesis not deciphered so far. Additionally, this work highlights the divergence of mouse phenotypes after brain-specific activation of WNT signaling from previously published studies and proposes potential reasons for varying recombination using the brain lipid binding protein (Blbp)-cre mouse strain.
Introduction
Aberrant activation of Wingless/Int-1 (WNT) signaling is associated with a variety of cancers and is typically induced by mutations in core components of the signaling pathway such as the β-catenin–encoding gene CTNNB1. These mutations stabilize β-catenin, which enters the nucleus to drive the expression of WNT targets including MYC and cyclin D1 to promote tumor cell proliferation (Liu et al., 2022). Outside of tumors in the CNS, β-catenin mutations are frequently detected in melanoma, endometrial cancer, hepatocellular carcinoma, and colorectal cancers (Kim and Jeong, 2019). Within brain tumor entities, they are mostly associated with WNT medulloblastoma (MB), occurring in ∼95% of cases (Northcott et al., 2017; Gajjar et al., 2021). WNT is one of the four molecular types of MB that are routinely classified based on their global DNA methylation profile: WNT, sonic hedgehog (SHH), Group 3, and Group 4 (Taylor et al., 2012; Capper et al., 2018). WNT MB show a classic morphology and a very good prognosis with a median 5-year overall survival of 90–100% (Gajjar et al., 2021; Goschzik et al., 2022). However, patients still suffer from long-term treatment-related morbidities, which is why several clinical studies aim at treatment de-escalation with reduced doses of radiation and chemotherapy (Thompson et al., 2020; Mynarek et al., 2021). Meanwhile, targeted therapies for WNT MB are still lacking (Gatto et al., 2022).
The first WNT MB mouse model Blbp-cre::Ctnnb1(ex3)fl/wt::Trp53fl/wt combined a stabilizing mutation in Ctnnb1 with a loss of tumor suppressor p53, which resulted in tumors originating from progenitor cells of the lower rhombic lip (LRL; Gibson et al., 2010). Later, a comparison of WNT MB transcriptomes to a single-cell transcriptome atlas of the murine and human developing brain more specifically defined pontine mossy fiber neurons as the cells of origin for WNT MB (Jessa et al., 2019). The WNT MB model described by Gibson et al. showed low penetrance (15%) and long latency, which was later amended by an additional introduction of a phosphatidylinositol 3-kinase (Pik3ca) mutation, resulting in accelerated tumor development with 100% penetrance (Robinson et al., 2012). However, although mutations of TP53 or PIK3CA occur in WNT MB (both at a frequency of 5–10%), the combination of both alterations is extremely rare (Gajjar and Finlay, 2015; Northcott et al., 2017). In contrast, concurrent mutations of CTNNB1 and SMARCA4 are detected in roughly 20% of WNT MB cases (Robinson et al., 2012; Northcott et al., 2017; Gajjar et al., 2021; Goschzik et al., 2022). This co-occurrence of both mutations may indicate a functional interplay between both proteins and might hint toward a tumor-promoting effect of a simultaneous alteration of CTNNB1 and SMARCA4.
SMARCA4 (SWI/SNF related, matrix-associated, actin-dependent regulator of chromatin, subfamily A, member 4; also known as BRG1) is a catalytic subunit of the BAF (BRG1/BRM-associated factor) chromatin remodeling complex, which greatly influences gene expression by altering accessibility of DNA regions for the binding of transcription factors (Clapier et al., 2017; Alfert et al., 2019). Functional SMARCA4 is essential for brain development, and alterations are associated with a wide range of neurodevelopmental diseases (Wieczorek et al., 2013; Bögershausen and Wollnik, 2018). Moreover, deleterious SMARCA4 mutations can be found throughout several cancer entities, including non-small-cell lung cancer, pancreatic cancer, hepatocellular carcinoma, head and neck cancer, and small-cell carcinoma of the ovary (Ramos et al., 2014; Hodges et al., 2018; Fernando et al., 2020). Within the CNS, biallelic loss of SMARCA4 is detected in rare cases of atypical/teratoid rhabdoid tumors (ATRT) with dismal prognosis (Hasselblatt et al., 2014; Holdhof et al., 2021b). Meanwhile, SMARCA4 mutations in MB mostly comprise somatic heterozygous missense mutations, which are suggested to have a dominant-negative effect leading to a loss of function (Hodges et al., 2018; Fernando et al., 2020). Despite the high frequency of SMARCA4 alterations, their role in WNT MB tumorigenesis has not been deciphered yet. We, therefore, combined a SMARCA4 deficiency with mutated β-catenin in a new Blbp-cre::Ctnnb1(ex3)fl/wt::Smarca4fl/fl mouse model to explore the interactions between aberrant WNT signaling and chromatin remodeling in WNT MB tumorigenesis.
Material and Methods
Transgenic animals
All experimental procedures on animals were approved by the Government of Hamburg, Germany (N113/16, N099/2019) and were performed according to national regulations. Mice were kept on a 12 h dark/light cycle, and water and food were available ad libitum. Animals of both sexes were used for experiments. The strain Smarca4fl/fl (also known as Brg1fl/fl) has been previously described and was provided by Dr. Pierre Chambon, IGBMC (Sumi-Ichinose et al., 1997; Indra et al., 2005), Blbp-cre mice were obtained from the NCI Mouse Repository (strain #01XM9; Hegedus et al., 2007), and Ctnnb1(ex3)fl/wt mice were provided by M. M. Taketo, Kyoto University (Harada et al., 1999). All strains were maintained on a C57Bl6/J background. The day of vaginal plug detection in the morning after mating and ovulation was defined as embryonic day 0.5 (E0.5). Postnatal days were counted starting with postnatal day 0 (P0) on the day of birth. Genotyping was performed by PCR using genomic DNA from ear or tail biopsies with the following primer pairs (5′-3′): cre (fw): TCCGGGCTGCCACGACCAA, cre (rv): GGCGCGGCAACACCATTTT, Smarca4 floxed (fw): GTCATACTTATGTCATAGCC, Smarca4 floxed (rv): GCCTTGTCTCAAACTGATAAG, Smarca4 recombined (fw): GATCAGCTCATGCCCTAAGG, Smarca4 recombined (rv): GCCTTGTCTCAAACTGATAAG, Ctnnb1(ex3) floxed (fw): CGTGGACAATGGCTACTCAA, Ctnnb1(ex3) floxed (rv): TGTCCAACTCCATCAGGTCA, Ctnnb1(ex3) recombined (fw): GTTCTCTTCCCTTCTGCACAC, Ctnnb1(ex3) recombined (rv): CTCTGAGCCCTAGTCATTGCATA, Ctnnb1(ex3) recombined for formalin-fixed paraffin-embedded (FFPE; fw): ATCACGAGGCCCTTTCGTCT, Ctnnb1(ex3) recombined for FFPE (rv): TAGTCATTGCATACTGCCCGT, red fluorescent protein (RFP) floxed (fw): AAAGTCGCTCTGAGTTGTTAT, RFP wildtype (rv): GGAGCGGGAGAAATGGATATG, RFP floxed (rv): GCGAAGAGTTTGTCCTCAACC. Cre-negative littermates shown as controls belong to three different genotypes: Ctnnb1(ex3)fl/wt:Smarca4fl/wt, Ctnnb1(ex3)fl/wt::Smarca4fl/fl (with cre-positive fathers), and Ctnnb1(ex3)fl/wt::Smarca4fl/rec (with cre-positive mothers). As neither of them showed any phenotype and all mice were viable and healthy at all time points analyzed, we summarized them as cre-negative controls unless otherwise stated in the figure legends.
Immunohistochemistry
For histological examination of brains, tissue was fixed in 4% formaldehyde for at least 12 h. The tissue was dehydrated, embedded in paraffin, and sectioned at 2 µm according to standard protocols. Hematoxylin and eosin (HE) stainings were applied according to standard protocols. DAB stainings were performed on a Ventana BenchMark XT system using the ultraView or OptiView DAB detection kit (Roche Diagnostics). The following antibodies were used: β-catenin (Agilent catalog #M3539; RRID, AB_2086135; 1:100), calbindin (Millipore catalog #AB1778; RRID, AB_2068336; 1:100), cre (BioLegend catalog #908001; RRID, AB_2565079; 1:100), GFAP (Agilent catalog #M0761; RRID, AB_2109952; 1:200), Ki67 (Abcam catalog #ab15580; RRID, AB_443209; 1:100), nestin (Abcam catalog #ab221660; RRID, AB_2909415; 1:2,000), NeuN (Millipore catalog #MAB377; RRID, AB_2298772; 1:50), OLIG2 (Millipore catalog #AB9610; RRID, AB_570666; 1:200), parvalbumin (Millipore catalog #MAB1572; RRID, AB_2174013; 1:2,000), PAX6 (BioLegend catalog #901301; RRID, AB_2565003; 1:1,000), RFP (Antibodies-Online catalog #ABIN129578; RRID, AB_10781500; 1:50), S100 (Agilent catalog #Z0311; RRID, AB_10013383; 1:100), SMARCA4 (Abcam catalog #ab110641; RRID, AB_10861578; 1:25), and SOX2 (Abcam catalog #ab92494; RRID, AB_10585428; 1:200).
Immunofluorescence (IF) stainings
IF stainings of FFPE tissue were performed manually after deparaffinization and antigen retrieval with citrate buffer. Cytospins were used directly for IF stainings after fixation with 4% formaldehyde. Blocking was performed with 10% NGS in 0.3% Triton X-100. The following primary antibodies were used for incubation at 4°C over night: BrdU (Invitrogen catalog #B35128; RRID, AB_2536432; 1:100); GLUT-1 (Millipore catalog #07-1401; RRID, AB_1587074; 1:500), PAX2 (Thermo Fisher Scientific catalog #71-6000; RRID, AB_2533990; 1:200), pHH3 (Cell Signaling Technology catalog #9706; RRID, AB_331748; 1:200), BLBP (Abcam catalog #ab131137; RRID, AB_11157091; 1:100), and SMARCA4 (Abcam catalog #ab110641; RRID, AB_10861578: 1:25). Secondary antibodies (1:500) and DAPI (1 µg/ml) were added for 1 h at room temperature on the next day: anti-mouse Alexa 488 (Cell Signaling Technology catalog #4408; RRID, AB_10694704), anti-mouse Alexa 555 (Cell Signaling Technology catalog #4409; RRID, AB_1904022), anti-rabbit Alexa 488 (Cell Signaling Technology catalog #4412; RRID, AB_1904025), and anti-rabbit Alexa 546 (Thermo Fisher Scientific catalog #A-11035; RRID, AB_2534093).
Image analysis and quantification
All immunohistochemistry (IHC) and HE stainings were imaged using the Olympus BX43 brightfield microscope and the Olympus cellSens software (Olympus). For imaging of IF stainings, the Nikon Ti2 microscope with the camera DS Qi2 and the corresponding software NIS-Elements (v5.11.03) was used (Nikon). White balance correction of brightfield images was performed using the GIMP image manipulation software (v2.10.28, freeware at www.gimp.org).
Quantification of areas in IHC was performed with ImageJ (v1.53). Total brain area and cerebellar area were measured with the Measure tool using HE-stained sagittal sections of comparable brain layers. Area measurement of the Ki67-positive area on IHC slides was performed after cropping pictures to display a region of 200 µm in height measured from the fourth ventricle. Then, images were converted into 8-bit format, and the same black/white threshold was applied to all pictures analyzed. The tools Erode, Dilate, and Remove Outliers were used to optimize the mask before applying the area_fraction tool to measure the fraction of the white area corresponding to a positive Ki67 signal.
To determine the percentage of labeled cells in IF stainings, the Automatic Measurement tool of the NIS-Elements software (v5.11.03, Nikon) was used. The threshold for fluorescence intensity and cell size was adjusted separately for each fluorescence channel and was applied to all samples to retrieve cell counts. At least three representative images were analyzed for each sample and staining. When big piles of cells were present within pictures, single cells were separated manually within these regions. Binary levels were created to analyze the overlay of two different fluorescent channels.
DNA methylation analysis
DNA isolation from FFPE punch biopsies was performed using the Maxwell RSC DNA FFPE kit (Promega). At least 150 ng of total DNA was used for bisulfite conversion with the EZ DNA methylation kit (Zymo Research). Then, samples were analyzed on the Infinium Mouse Methylation BeadChip array covering >285,000 CpG sites within the mouse genome on an iScan array scanner (Illumina). Human tumor samples were analyzed on the MethylationEPIC 850 k BeadChip array (Illumina). The use of biopsy specimens for research upon anonymization was always in accordance with local ethical standards and regulations at the University Medical Center Hamburg–Eppendorf.
Data processing and analysis was performed with R (v4.1.2). For a comparison of methylation profiles between mouse samples only, samples were preprocessed with SeSaMe (Zhou et al., 2018) and quantile normalized. Principal component analysis (PCA) was performed with the prcomp function using the 10,000 most differentially methylated CpG sites. Overrepresentation analysis (ORA) was applied using the methylGSA package with methylRRA adjustment (Ren and Kuan, 2019) with user-supplied mapping between CpG ID and gene name in the mouse genome. Gene ontology (GO) terms associated with biological processes were summarized and visualized with REVIGO (Supek et al., 2011). The resulting interactive graph was further adjusted using the Cytoscape software v3.9.1 (Shannon et al., 2003).
For a comparison of murine samples to human brain tumors, previously published data (Capper et al., 2018; Sharma et al., 2019) were combined with data generated in-house (in total n = 1,683). Preprocessing of raw data was performed with the Minfi package (Aryee et al., 2014) for human data, whereas the SeSaMe package was used for mouse data as described above. Then, quantile normalization of data was performed. Within the human dataset, the 15,000 most differentially methylated CpG sites were identified. Out of these, 491 CpGs that are orthologous between the human and mouse genome were chosen for further analysis. Human and mouse datasets were combined, and again, quantile normalization was performed. Uniform Manifold Approximation and Projection for Dimension Reduction (UMAP; McInnes et al., 2018) and hierarchically clustered heatmaps (Complex Heatmap package; Gu et al., 2016) were generated based on the differential methylation of the previously chosen 491 CpGs.
Culture of hindbrain progenitor cells
For the isolation of hindbrain progenitor cells (HPCs), E14.5 embryos (Blbp-cre::Ctnnb1(ex3)fl/wt::Smarca4fl/rec, Blbp-cre::Ctnnb1(ex3)fl/wt::Smarca4fl/wt, or cre-negative littermates) were collected by cesarean section and were killed by decapitation. Hindbrains were dissected under a dissecting microscope (Leica M165 FC, Leica Camera) and were digested in papain/DNase solution (papain, 20 U/ml; DNase, 400 µg/ml) at 37°C for 30–60 min. Singularized cells were transferred into T25 flasks in neural stem cell (NSC) medium (DMEM/F-12 + GlutaMAX, 40 mM HEPES, 1× B27 supplement, 1× MEM non-essential amino acid solution, 50 U/ml Pen-Strep, 20 ng/ml EGF, 20 ng/ml FGF) to form neurospheres in suspension cultures. EGF and FGF were freshly added every 2–3 d during the cultivation period. Every week, neurospheres were singularized using Accutase, and cells were counted and reseeded into new T25 flasks at 1 mio cell per flask. Population doublings (PD) were then calculated as follows: PD = log2 (cell count/cells seeded). To fix HPC neurospheres on cytospins for stainings, ∼5 × 10⁵ cells were resuspended in PBS and centrifuged at 500 rpm with low acceleration for 5 min in a Cytospin 4 centrifuge (Thermo Fisher Scientific). Then, cells were fixed by applying 4% formaldehyde for 20 min. For adherent cell cultures, HPCs were singularized and seeded onto poly-ʟ-ornithine (PLO) coated 24-well plates (15 µg/ml) at a density of 200,000 cells per well.
Transplantation of HPCs
Transplantation of HPCs was performed directly after isolation and cell counting. The cell pellet was washed in 50 µl of cold NSC medium, transferred into a new tube, and resuspended in 4 µl of 3:1 NSC medium with Matrigel (Growth Factor Reduced). Cells were kept on ice until ready for injection. During stereotactic transplantations, recipient mice (6-week-old CD1nu/nu) were anesthetized by isoflurane inhalation. They additionally received analgesia by subcutaneous injections of carprofen (6 mg/kg) before transplantation and on the day after. For the procedure, mice were placed in a stereotactic frame (David Kopf Instruments) on a heating pad, and eye ointment was applied to avoid dehydration. Local anesthesia (2% lidocaine) was applied before performing a skin incision and puncturing the skull for injection. Total HPCs derived from one embryonal hindbrain each were injected using a Hamilton syringe (World Precision Instruments) at coordinates x, +1 mm; y, −1 mm; and z, −2 mm from the lambda suture at 30° from the skull surface. Mice were monitored daily for any sign of tumor development within the following 6 months.
Cerebellar explants
For explant cultures, cerebella of E14.5 embryos were dissected, minced with a scalpel, and transferred into 24-well plates coated with PLO (15 µg/ml) and laminin (20 µg/ml). They were cultured in an NSC medium supplied with EGF and FGF as described for the HPC culture above.
Single-cell gene expression analysis
Single-cell RNA sequencing was performed using HPCs from E16.5 embryos isolated as described above. Three controls (cre-negative littermates) and three mutants (Blbp-cre::Ctnnb1(ex3)fl/wt::Smarca4fl/rec) were chosen for further processing, and living cells were sorted by excluding dead 7-aminoactinomycin D–positive cells using a BD FACSAria fusion flow cytometer (BD Biosciences). Before starting library preparation, samples were pooled together in similar quantities to generate one control and one mutant sample. Preparation of single-cell gene expression libraries was performed at the Single Cell Core Facility of the University Medical Center Hamburg using the Chromium Next GEM Single Cell 3′ v3.1 kit (10x Genomics) with 40,000 cells of each pooled sample. The sufficient quality of the generated library was confirmed on a TapeStation with the High Sensitivity D5000 ScreenTape (Agilent). Paired-end sequencing of libraries was performed at Novogene UK on a NovaSeq 6000 sequencing system (Illumina).
Raw sequencing reads were aligned against a murine reference genome (mm10-2020-A, provided by 10x Genomics) and were simultaneously counted with the Cell Ranger pipeline (v7.0.1; Zheng et al., 2017) employing the count command. The output from Cell Ranger was loaded into R (v4.1.1) via the Seurat package (v4.0.5; Hao et al., 2021), including only genes expressed in a minimum of three cells and cells expressing a minimum of 200 features. Control and mutant datasets were merged and further filtered to include only cells expressing >1,500 and <7,500 features, <5% mitochondrial genes, and <40,000 overall reads. The merged dataset was then normalized and scaled, and the PCA was calculated based on the 2,000 most variable genes. The first 50 dimensions and a resolution of 0.5 were chosen for UMAP and clustering. To annotate cell classes and subclasses in the resulting clusters, a label transfer method based on Stuart et al. (2019) was chosen using a murine reference dataset (La Manno et al., 2021). Briefly, anchor cells between the query dataset and reference are chosen in low dimensional PCA space, and labels are transferred by a weights matrix that defines the association between the query cells and the anchor cells and a binary matrix of the label and the anchor cells. Similarly, the age of cells was predicted using the La Manno et al. (2021) dataset from E10.0 to E16.5 as a reference. The following modifications were performed for predicted subclasses: exclusion of subclasses with <10 cells; summary of “meninges” (Pia1/2/3, intermediate meninges, dura, arachnoid); summary of “microglia” (axon tract-associated microglia, cycling microglia, noncycling microglia); and undefined cells with prediction class “blood” also defined as “blood” in subclasses. Cell cycle scores were assigned using the CellCycleScoring tool in Seurat. To determine differentially expressed genes (DEGs) between two sets of cells, a fold change of the average expression values plus a pseudocount of one was calculated, and a Wilcoxon rank sum test was performed. The resulting p-value was Bonferroni corrected, and a gene was called a DEG with |average log2 fold change| > 1 and adjusted p < 0.01. GSEA was performed using the fgsea (v1.20.0) R-package with the category WIKIPATHWAYS chosen from MsigDB via the msigdbr (v7.5.1) R-package. Gene lists ranked by average log2Foldchange were used as input and the lower bound for p-value calculation was set to zero. To infer the development of different brain cell types, a trajectory analysis by the monocle R-package (v2.2.0) was applied to cells originating from the mutant sample. Again, DEGs were estimated, but this time employing monocle's inherent differentialGeneTest function between the beforehand assigned cell types. After reducing dimensions to two by the DDRTree method, the cells were ordered by DEGs with q < 0.01, and trajectory was estimated in the reduced dimensional space. Lastly, we examined RNA velocity with Python (v3.6.8) and the corresponding package scVelo (v0.2.5). Visualizations are based on UMAP embeddings imported from Seurat.
Experimental design and statistical analysis
All statistical analysis was performed using the GraphPad Prism (v9.4.1) or R (v4.1.2) software. The statistical tests applied to the data shown are stated in the respective text passages within the results. For each comparison, at least n = 3 samples per group were used, and/or n = 3 independent experiments were conducted. When comparing two groups only, two-tailed unpaired Welch's t test or, in the case of paired data, two-tailed paired t tests were performed. For comparisons between more than two groups, Tukey's multiple-comparisons tests after ANOVA were applied. Dunnett's multiple-comparisons test after ANOVA was applied when comparing means to a control group only. To determine DEGs in single-cell RNA sequencing, the Wilcoxon rank sum test with Bonferroni’s correction was applied. The chi-square test was applied when comparing expected versus counted values in mouse breeding. p values were corrected for multiple testing whenever more than two groups were compared. All graphs depict mean ± SD.
Results
Severe developmental phenotypes and early lethality of Blbp-cre::Ctnnb1(ex3)fl/wt mice
In the first step, we analyzed postnatal mice harboring mutated β-catenin, SMARCA4 loss, or a combination of both alterations under the control of the Blbp promoter. Blbp-cre::Ctnnb1(ex3)fl/wt mice developed a severe neurodevelopmental phenotype with a median survival of only 2 d (Fig. 1A). All mice were either found dead shortly after birth (n = 10) or had to be killed due to ataxia and hydrocephalus within the first 3 weeks of life (n = 8). This was unexpected since this phenotype had not been described before for Blbp-cre::Ctnnb1(ex3)fl/wt mice (Gibson et al., 2010). An additional heterozygous loss of SMARCA4 in Blbp-cre::Ctnnb1(ex3)fl/wt::Smarca4fl/wt mice did not influence observed phenotypes or survival (median survival, 2.5 d). In contrast, mice bearing a homozygous loss of SMARCA4 alone (Blbp-cre::Smarca4fl/fl) died even earlier (median survival, <1 d). Only one mouse survived until P11 when it had to be killed due to severe ataxia. Lastly, combined mutation of β-catenin and homozygous SMARCA4 loss in Blbp-cre::Ctnnb1(ex3)fl/wt::Smarca4fl/fl mice resulted in the highest lethality. All mice born with this genotype were either found dead at birth or died on the same day (n = 8). Blbp-cre::Smarca4fl/wt mice did not show any phenotype and were treated as equivalent to controls in further investigations.
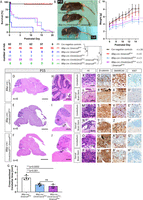
Early lethality and severe developmental phenotypes of Blbp-cre::Ctnnb1(ex3)fl/wt mice. A, Survival curves of different mouse genotypes stated in the legend beneath. All Blbp-cre::Ctnnb1(ex3)fl/wt::Smarca4fl/fl mutants died at birth or within the first day of life. The table beneath the graph depicts numbers at risk for the respective genotypes and postnatal days. Log-rank tests with Bonferroni’s correction were performed (see detailed statistical values in Extended Data Table 1-1). B, Macroscopic hydrocephalus and reduced size of mutant mice at sacrifice (P15). C, Significantly reduced weight of mutant mice compared with controls within the second week of life (**p ≤ 0.01, ***p ≤ 0.001, ****p ≤ 0.0001, see detailed statistical values and n values for each comparison in Extended Data Table 1-1). D–F, HE staining of sagittal brain sections reveals hydrocephalus and hypoplastic cerebella in Blbp-cre::Ctnnb1(ex3)fl/wt and Blbp-cre::Ctnnb1(ex3)fl/wt::Smarca4fl/wt mice compared with Blbp-cre::Smarca4fl/wt controls. The asterisk indicates the location where hindbrain lesions develop in mutant animals. G, Cross-sectional cerebellar area is significantly reduced in mutants as measured in HE sagittal sections of four mice each. H–J, HE stainings show defective lamination and foliation in the cerebella of both Blbp-cre::Ctnnb1(ex3)fl/wt and Blbp-cre::Ctnnb1(ex3)fl/wt::Smarca4fl/wt mice. K–H′, HE and IHC of aberrant cell accumulations in the cerebellum and dorsal brainstem of mutants (corresponding to black rectangles in H–J with and without asterisks, respectively). Cell accumulations show nuclear accumulation of β-catenin (S, T, U, V), partial loss of SMARCA4 only in Blbp-cre::Ctnnb1(ex3)fl/wt::Smarca4fl/wt mutants (A′, B′), and weak proliferation in both mutants at both locations (E′–H′). Scale bars in D and E, and F correspond to 2 mm; in H, I, and J to 500 µm; and in K–P to 50 µm (also applicable to panels Q–H′).
Table 1-1
Detailed statistical values corresponding to the survival analysis and weight analysis in Figure 1. (A) Statistical values for all comparisons of postnatal survival between the five genotypes Blbp-cre::Smarca4fl/wt, Blbp-cre::Smarca4fl/fl, Blbp-cre::Ctnnb1(ex3)fl/wt, Blbp-cre::Ctnnb1(ex3)fl/wt:Smarca4fl/wt, Blbp-cre::Ctnnb1(ex3)fl/wt::Smarca4fl/fl, and cre-negative littermates. Log-rank tests with Bonferroni correction were applied. (B) Detailed statistical values for all comparisons of postnatal weight of the three genotypes Blbp-cre::Smarca4fl/wt, Blbp-cre::Ctnnb1(ex3)fl/wt, and Blbp-cre::Ctnnb1(ex3)fl/wt::Smarca4fl/wt to cre-negative littermates. Dunnett’s multiple comparisons test after mixed-effect analysis was performed. Right table shows the number of mice (n) analyzed of each genotype at each postnatal day. Download Table 1-1, XLSX file.
Blbp-cre::Ctnnb1(ex3)fl/wt and Blbp-cre::Ctnnb1(ex3)fl/wt::Smarca4fl/wt mice that survived up until P15 showed macroscopic hydrocephalus and were smaller compared with cre-negative controls (littermates; Fig. 1B). Their weight was significantly reduced in comparison with controls within their second week of life (Fig. 1C, **p ≤ 0.01, ***p ≤ 0.001, ****p ≤ 0.0001, Dunnett's multiple comparisons). Histologically, both genotypes showed a severe hydrocephalus and hypoplastic cerebella with significantly reduced sizes in comparison with controls (F(2,9) = 25.72, p = 0.0002, ANOVA; adjusted p = 0.001/p = 0.0002, Tukey's multiple comparisons, Fig. 1D–G). The cerebellum of mutants showed severe architectural abnormalities with disturbed layering and cell accumulations in both the cerebellum and dorsal brainstem (Fig. 1H–P). IHC stainings revealed nuclear accumulation of β-catenin in cellular accumulations of both regions and both mutants, while partial SMARCA4 loss was only visible in cell accumulations of Blbp-cre::Ctnnb1(ex3)fl/wt::Smarca4fl/wt mice (Fig. 1Q–B′). Altogether, proliferation as indicated by Ki67 expression was very low in all cell accumulations detected, pointing toward a neurodevelopmental phenotype rather than tumorous lesions (Fig. 1C′–H′). Both accumulations in brainstem and cerebellum of Blbp-cre::Ctnnb1(ex3)fl/wt mice showed similar patterns in IHC by staining positive for cre, nestin, and SOX2 with sparse expression of GFAP and OLIG2 and no signal for parvalbumin, PAX6, S100, NeuN, and calbindin, suggesting an origin in undifferentiated neural progenitor cells (Fig. 2A–J′).

Histological characterization of cell accumulations in the cerebellum and brainstem of Blbp-cre::Ctnnb1(ex3)fl/wt mutants. Cell accumulations in both locations at P15 display similar immunohistochemistry, staining positive for Cre (A, A′), SOX2 (B, B′), and nestin (C, C′) with sparse to no expression of GFAP (D, D′) and OLIG2 (E, E′) and negativity for PAX6 (F, F′), S100 (G, G′), NeuN (H, H′), parvalbumin (I, I′), and calbindin (J, J′). Scale bars in A, A′ correspond to 50 µm and are applicable to all remaining panels.
To find an explanation for the unexpected severity of phenotypes in our breeding of Blbp-cre::Ctnnb1(ex3)fl/wt mice, we generated fate-mapping mice to track the expression of BLBP. Staining of RFP in Blbp-cre::IsIR26tdRFPfl/wt mice at embryonic day 14.5 (E14.5) revealed broad expression throughout the whole developing cerebellum, the brainstem, and parts of the midbrain and rostral cerebral cortex (Fig. 3A–F). This pattern of RFP expression correlates with BLBP expression, although the expression of RFP is visible in more cells. This is due to the fact that BLBP staining marks all cells expressing BLBP at E14.5, whereas RFP is expressed in all cells that have expressed BLBP since its onset of expression at E9.5 (Fig. 3G–I). In contrast, Gibson et al. previously showed recombination by Blbp-cre at the same developmental stage mostly restricted to the germinal zones of the cerebellum (LRL, upper rhombic lip [URL], ventricular zone [VZ], external granular layer; Gibson et al., 2010).
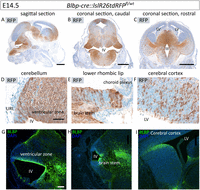
Fate-mapping mice show broad recombination by Blbp-cre throughout the embryonic brain. A, RFP staining of Blbp-cre::IsIR26tdRFPfl/wt embryos at E14.5 (sagittal section of whole head) reveals recombination in the cerebellum, midbrain, and cortex, which was also verified in coronal sections (B, C). D–F, High-power images show positive stainings throughout the whole cerebellum (D), no signal in the choroid plexus (E), and scattered expression in the dorsal brainstem (E) and rostral part of the cerebral cortex (F). G–I, BLBP expression corresponds to RFP expression but is more restricted in all analyzed tissues. Scale bars in A–C correspond to 500 µm, and scale bar in D corresponds to 50 µm and is applicable to E–I. LV = lateral ventricle, III = third ventricle, IV = fourth ventricle, URL = upper rhombic lip.
An analysis of mutants at birth (P0) revealed that the phenotype of Blbp-cre::Ctnnb1(ex3)fl/wt mice with severe hydrocephalus and dorsal brainstem lesions was already evident at this point in time (Fig. 4A–T). Additionally, mice displayed lesions in the cerebral cortex at this stage. At the same time, Blbp-cre::Smarca4fl/fl mice developed a hydrocephalus and a hypoplastic cerebellum while showing a loss of SMARCA4 but no aberrant cell accumulations in either the brainstem or cerebral cortex (Fig. 4U–D′). Blbp-cre::Ctnnb1(ex3)fl/wt::Smarca4fl/fl mice displayed hydrocephalus and severely hypoplastic cerebellum and showed no signs of tumor development (Fig. 4E′–N′). However, counted versus expected genotypes in our breeding revealed that both mutants Blbp-cre::Smarca4fl/fl and Blbp-cre::Ctnnb1(ex3)fl/wt::Smarca4fl/fl were born at a highly reduced frequency relative to expected Mendelian ratio, with 22% and 26% of expected mice born, respectively (chi-square = 63.07, DF = 5, p < 0.0001, Fig. 4O′). These values suggested prenatal lethality of both mutant genotypes and prompted us to additionally analyze mice at the embryonic stage.
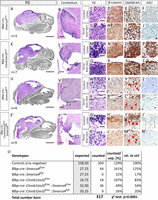
Severe developmental phenotypes but no tumor development in mutants at P0. A, HE staining of the sagittal section of the whole head (brain in color) of Blbp-cre::Smarca4fl/wt mice at P0 reveals no phenotype. B–J, High-power images show normally developing cerebellum, cortex, and dorsal brainstem. The cerebral cortex region is indicated by the black rectangle in A, while the dorsal brainstem region is indicated by the black rectangle in B. K–T, Blbp-cre::Ctnnb1(ex3)fl/wt mutants already display severe hydrocephalus, hypoplastic cerebella, and aberrant cell accumulations in both cerebral cortex and dorsal brainstem with nuclear accumulation of β-catenin at P0. Blbp-cre::Ctnnb1(ex3)fl/wt::Smarca4fl/wt mutants showed the exact same phenotype and are therefore not displayed (n = 11 analyzed). U–D′, Blbp-cre::Smarca4fl/fl mutants also show hydrocephalus and hypoplastic cerebella but no cell accumulations in both the cortex and brainstem. Partial SMARCA4 loss is visible in both regions, with examples marked by red arrowheads (Y, C′). E′–N′, Blbp-cre::Ctnnb1(ex3)fl/wt::Smarca4fl/fl mutants were mostly found dead at birth and showed severe hydrocephalus and the most prominent hypoplastic cerebella. Aberrant cell accumulations in the cerebral cortex were detected in reduced quantity and size, whereas cell accumulations in the dorsal brainstem were never found. O′, Counted versus expected (Mendelian ratio) genotypes detected after birth. Scale bars in A, K, U, and E′ correspond to 2 mm, in B, L, V, and F) to 200 µm, and in C, M, W, and G′) to 50 µm (applicable to all remaining panels).
Blbp-cre::Ctnnb1(ex3)fl/wt::Smarca4fl/rec mice develop proliferative cerebellar lesions at embryonic age
Blbp-cre::Ctnnb1(ex3)fl/wt::Smarca4fl/rec mice (further referred to as “mutants”) displayed big cerebellar lesions in the developing cerebellum at E14.5 that were not visible in cre-negative controls (Fig. 5A–D). Lesions were mainly located within the two developing cerebellar hemispheres (Fig. 5E–H). They were cell dense, were interspersed with blood vessels, and showed nuclear accumulation of β-catenin and a loss of SMARCA4 in all cells (Fig. 5I–N). Furthermore, they expressed Cre and stained positive for SOX2, the expression of which is usually restricted to the VZ (Fig. 5O,P,R,S). Proliferation as measured by Ki67-positive area was significantly increased in mutants compared with the corresponding region in controls (t = 5.036, DF = 4.314, p = 0.0060, Welch's t test; Fig. 5Q,T–U). Additionally, lesions often displayed rosette-like features, a characteristic attributed to neural stem cells, and a phenomenon also occurring in some MB cases (Wilson and Stice, 2006; Orr, 2020; Fig. 5V–W). The adjustment of the mutant genotype Blbp-cre::Ctnnb1(ex3)fl/wt::Smarca4fl/fl to Blbp-cre::Ctnnb1(ex3)fl/wt::Smarca4fl/rec was caused by our finding of Smarca4 germline recombination in the offspring of cre-positive mothers, which strongly influenced phenotypes. While 12 of 13 mutants derived from breeding with cre-positive mothers (Blbp-cre::Smarca4fl/wt females crossed with Ctnnb1(ex3)fl/fl::Smarca4fl/fl males) displayed cerebellar lesions at E14.5, 0 of 5 mutants derived from cre-positive fathers (Blbp-cre::Smarca4fl/wt males crossed with Ctnnb1(ex3)fl/fl::Smarca4fl/fl females) developed cerebellar lesions (three litters analyzed). Consequently, we investigated Smarca4 recombination in embryonic tail biopsies to test for germline recombination since BLBP is not physiologically expressed in this region. PCR analysis revealed a recombined Smarca4 allele in the tails of all Blbp-cre::Ctnnb1(ex3)fl/wt::Smarca4fl/rec and Ctnnb1(ex3)fl/wt::Smarca4fl/rec offspring derived from cre-positive mothers (Extended Data Table 5-1). The fact that recombination was independent of the cre status of the embryos themselves suggested that Smarca4 recombination had already occurred in the oocytes of mothers (Hayashi et al., 2003; Luo et al., 2020). In contrast, none of the embryos derived from cre-positive fathers showed germline recombination of Smarca4 (Fig. 5X, breeding scheme). The parents themselves were not chimeras for Smarca4 recombination as tested in multiple tissues (Extended Data Table 5-1). Furthermore, recombined Ctnnb1 alleles were never found in tail biopsies of embryos derived from cre-positive mothers. We concluded that the preceding loss of one Smarca4 allele in the germline before the cre-induced loss of the second Smarca4 allele and cre-induced mutation of Ctnnb1 greatly influences observed phenotypes in mutants. Therefore, we decided to perform all the following analyses with offspring of cre-positive mothers only.
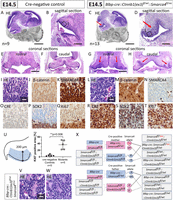
Combined activation of WNT signaling and loss of SMARCA4 induces proliferative lesions at embryonic age in Blbp-cre::Ctnnb1(ex3)fl/wt::Smarca4fl/rec mutants. A–D, HE stainings show a large lesion in the VZ of the developing cerebellum at E14.5 in Blbp-cre::Ctnnb1(ex3)fl/wt::Smarca4fl/rec mutants (red arrow in C and D) compared with cre-negative littermates (A, B). E–H, HE staining of coronal sections reveals the presence of lesions in the rostral as well as caudal section of the cerebellum within both hemispheres (red arrows) but excluding the midline. I–T, High-power images of lesions compared with control cerebella (corresponding to black rectangles in B–D) display high cell density interspersed with blood vessels (L), nuclear accumulation of β-catenin (M), loss of SMARCA4 (N), and positivity for cre (R) and SOX2 (S). Ki67 staining indicates high proliferation within the lesions (T) with a significantly increased area staining positive for Ki67 in mutants (U; area measured shown on the left). V, W, Rosette-like structures detected in HE within cerebellar lesions of mutants. X, Breeding scheme of mice employed in the project illustrating the differences in breeding with cre-positive mothers passing on the recombined Smarca4 allele (rec) and cre-positive fathers passing on the floxed Smarca4. A detailed description of all tissues tested for Smarca4 recombination is provided in Extended Data Table 5-1. Scale bars in A, C correspond to 1 mm, in B, D to 250 µm, in E, G to 500 µm (also applicable to F, H), and in I, V to 25 µm (applicable to I–T, W).
Table 5-1
Recombination of Smarca4 as tested by PCR in different genotypes and tissues. Download Table 5-1, XLSX file.
We further characterized cerebellar lesions in Blbp-cre::Ctnnb1(ex3)fl/wt::Smarca4fl/rec mutants by IF costaining of SMARCA4 and mitotic marker phosphohistone H3 (pHH3; Fig. 6A–H). While cell density was not significantly increased in the lesions (Fig. 6E; t = 1.341, DF = 5.055, p = 0.2371, Welch's t test), SMARCA4 knockdown was visible in ∼90% of cells (Fig. 6F; t = 76.49, DF = 4, p < 0.0001, one-sample t test). The mitotic cell count was significantly increased in the lesions compared with controls (Fig. 6G; t = 3.167, DF = 5.224, p = 0.0234, Welch's t test) with significantly more SMARCA4-negative mitotic cells than SMARCA4-positive mitotic cells (Fig. 6H; t = 4.821, DF = 4, p = 0.0085, paired t test). Next, we had a closer look at cell populations within the cerebellar VZ, where the lesions seemed to originate. During embryonic hindbrain development, the cerebellar VZ gives rise to PAX2-positive inhibitory interneurons, which migrate radially inside the cerebellum from E12.5 on (Seto et al., 2014). While migrating PAX2-positive precursors were visible in controls at E14.5, they were not detected throughout the whole mutant cerebellum, suggesting disturbed differentiation toward this lineage in mutants (Fig. 6I–L). Furthermore, we stained for GLUT-1 in blood vessels, which is needed to facilitate glucose transport across the blood–brain barrier (Pardridge et al., 1990; Dermietzel et al., 1992). Phoenix et al. have shown the absence of GLUT-1 in human WNT MB and brainstem lesions of Blbp-cre::Ctnnb1(ex3)fl/wt::Trp53fl/fl mice that both display a defective blood–brain barrier (Phoenix et al., 2016). However, blood vessels in cerebellar lesions of our mutants stained positive for GLUT-1, suggesting a maintained blood–brain barrier in our model (Fig. 6M–P). The lesions also expressed BLBP, which is expressed only in the VZ in the controls (Fig. 6Q-T). The BLBP expression aligns well with the expression of Cre in the lesions shown in Figure 5R.

Cerebellar lesions in Blbp-cre::Ctnnb1(ex3)fl/wt::Smarca4fl/rec mutants show increased mitotic count, loss of interneuron progenitor populations, and an intact blood–brain barrier. A–D, IF costaining of SMARCA4 and pHH3 in the VZ of controls and mutants (Blbp-cre::Ctnnb1(ex3)fl/wt::Smarca4fl/rec) at E14.5 (controls n = 4, mutants n = 5). E, Cell density according to DAPI signal in SMARCA4/pHH3 costaining. F, SMARCA4-positive cells according to SMARCA4/pHH3 costaining. G, Mitotic cell count according to SMARCA4/pHH3 costaining. H, Mitotic cell count with or without concurrent SMARCA4 signal within mutant samples. I, J, PAX2 staining shows the migration of interneuron progenitors from the VZ inwards in control animals. K, L, PAX2-positive interneuron progenitors are not detected in the VZ of mutant animals. M–P, Blood vessels in controls as well as mutants show positivity for GLUT-1, suggesting a maintained blood–brain barrier within the lesion. Q–T, The cells in the VZ in controls and in the lesions in the mutants express BLBP. Scale bars in A, C correspond to 200 µm, in B, D to 25 µm; in I, K to 200 µm; in J, L to 25 µm; in M, O, Q, and S to 100 µm; in N, P to 25 µm; and in R and T to 50 µm.
In addition to Blbp-cre::Ctnnb1(ex3)fl/wt::Smarca4fl/rec mutants described above, we also analyzed other mutant genotypes at E14.5, none of which developed any proliferative cerebellar lesions (Fig. 7A–H). Blbp-cre::Ctnnb1(ex3)fl/wt and Blbp-cre::Ctnnb1(ex3)fl/wt::Smarca4fl/wt mice had not developed any hindbrain phenotype yet, whereas Blbp-cre::Smarca4fl/rec mice showed a partial loss of SMARCA4 in the VZ (Fig. 7I–T). The phenotype of Blbp-cre::Ctnnb1(ex3)fl/wt::Smarca4fl/fl mutants derived from cre-positive fathers was similar to Blbp-cre::Smarca4fl/rec mutants without any evidence of proliferative lesions (Fig. 7U–X).
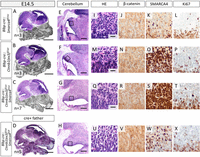
Cerebellar lesions are not detected in other mutant genotypes at E14.5. A–D, HE stainings of whole head sagittal sections of Blbp-cre::Smarca4fl/rec, Blbp-cre::Ctnnb1(ex3)fl/wt, and Blbp-cre::Ctnnb1(ex3)fl/wt::Smarca4fl/wt mutants derived from cre-positive mothers and Blbp-cre::Ctnnb1(ex3)fl/wt::Smarca4fl/fl mutants derived from cre-positive fathers at E14.5. E–H, Higher magnification of cerebellar areas in sagittal HE stainings. I–X, HE and DAB stainings of the VZ, areas correspond to black rectangles in E–H. J–W, Nuclear accumulation of β-catenin is not evident in any of the genotypes, whereas partial loss of SMARCA4 is visible in Blbp-cre::Smarca4fl/rec and Blbp-cre::Ctnnb1(ex3)fl/wt::Smarca4fl/fl mice only. L–X, Proliferation in the VZ is not increased in mutants according to Ki67 stainings. Scale bars in A–D correspond to 1 mm, in E–H to 200 µm, and in I, M, and Q to 20 µm (also applicable to J–X).
Cerebellar lesions develop from E13.5 to E16.5
To find out more about the origin and developmental window of the embryonic cerebellar lesions, we analyzed Blbp-cre::Ctnnb1(ex3)fl/wt::Smarca4fl/rec mutants at different embryonic time points (E12.5, E13.5, E14.5, E16.5, E18.5). Cerebellar lesions were detected earliest at E13.5 and expanded until E16.5, at which point they spanned great parts of the developing cerebellum (Fig. 8A–D). Although the loss of SMARCA4 was already visible in the cerebella of mutant mice at E12.5, accumulation of β-catenin was not detected yet (Fig. 8E,F). From E13.5 on, lesions with a complete loss of SMARCA4 and nuclear accumulation of β-catenin were evident (Fig. 8G–L). In contrast, E18.5 and P0 mutants were only found at highly reduced frequencies without displaying any cerebellar lesions (Fig. 8M). Histologically, the few mutants found and analyzed at E18.5 or P0 showed a complete loss of SMARCA4 in the cerebellum, whereas nuclear accumulation of β-catenin was not visible (Fig. 8N-S). To find an explanation for this discrepancy between phenotypes, we investigated the recombination of Smarca4 in the germline as well as the local recombination of Smarca4 and Ctnnb1 in FFPE brain sections of the mutants histologically analyzed from E12.5 to P0. Germline recombination of Smarca4 was detected in all mutants including mice without lesions at P0 (Fig. 8T). Furthermore, the recombination of Smarca4 in the brains at P0 was confirmed using DNA extracted from FFPE sections (Fig. 8U). However, recombination of Ctnnb1 was not detected in P0 brains compared with mutants at E14.5 or E16.5, indicating incomplete recombination as a possible cause for the missing lesions and prolonged survival of a few mutants (Fig. 8V).

Cerebellar lesions develop from E13.5 to E16.5. A–D, HE stainings of Blbp-cre::Ctnnb1(ex3)fl/wt::Smarca4fl/rec brains show cerebellar development from E12.5 to E16.5 with lesions visible from E13.5 to E16.5. E–L, SMARCA4 and β-catenin stainings of the cerebellar VZ (black rectangle in A–D) reveal a partial loss of SMARCA4 at E12.5 and complete SMARCA4 loss from E13.5. Nuclear accumulation of β-catenin is visible in lesions from E13.5 to E16.5. M, Expected versus counted genotypes in litters of cre-positive mothers at different embryonic stages and P0. Column “%” = percentage counted/expected; column “lesions” = count of cerebellar lesions in histologically analyzed mutants. N–O, Blbp-cre::Ctnnb1(ex3)fl/wt::Smarca4fl/rec cerebella without any evidence of lesions. P–S, SMARCA4 and β-catenin stainings of the cerebellar VZ (corresponding to the black rectangle in N and O). T, Recombination of Smarca4 tested by PCR in genomic DNA from tail biopsies of histologically analyzed mutants from E12.5 to P0 shows recombination at all ages tested. U, Smarca4 recombination was also detected using DNA isolated from FFPE sections of mutant brains. V, Using the same DNA samples as in U, recombination of Ctnnb1 was only detected at E14.5 and E16.5 but not in mutants analyzed at P0. Scale bars in A and N correspond to 250 µm (also applicable to B–D and O) and in E, F, P, and R to 25 µm (also applicable to G–L and Q–S).
Brainstem cell accumulations do not develop after SMARCA4 loss
A detailed comparison of brains at E16.5 revealed that the cell accumulations in the dorsal brainstem previously detected in Blbp-cre::Ctnnb1(ex3)fl/wt mice at P15 and P0 were already visible at this age (Fig. 9A–L). In contrast, none of the Blbp-cre::Ctnnb1(ex3)fl/wt::Smarca4fl/rec mutants with cerebellar lesions developed any aberrant accumulations in the brainstem but only showed a loss of SMARCA4 in this region (Fig. 9M–R). Brainstem lesions were already described as missing in Blbp-cre::Ctnnb1(ex3)fl/wt::Smarca4fl/fl mutants at P0 (Fig. 4). However, in this case, the presence of cerebellar lesions at E16.5 proved successful Ctnnb1 recombination in mutants. Consequently, missing cell accumulations are either attributed to insufficient recombination of Ctnnb1 only in the brainstem region or to the SMARCA4 loss in this region.

Blbp-cre::Ctnnb1(ex3)fl/wt::Smarca4fl/rec mutants do not develop brainstem lesions. A–F, HE stainings of cre-negative controls at E16.5 show normally developing cerebellum with low cell density in HE (B, C), absence of β-catenin accumulation (D), positivity for SMARCA4 (E), and low proliferation (F). Meanwhile, Blbp-cre::Ctnnb1(ex3)fl/wt mice display aberrant cell accumulations in the dorsal brainstem with high cell density (G, H), nuclear accumulation of β-catenin (J), and SMARCA4-positive cells with increased proliferation (K, L). Blbp-cre::Ctnnb1(ex3)fl/wt::Smarca4fl/rec mutants display the beforementioned cerebellar lesions (M, N) but do not develop any cell accumulations in the brainstem (O, P). Loss of SMARCA4 is apparent in the affected region (Q). Scale bars in A, G, and M correspond to 2 mm; in B, H, and N to 250 µm; and in C, I, and O to 20 µm (also applicable to the remaining panels). Only the offspring of cre-positive mothers were included in the analysis.
Cerebellar lesions show deregulated global DNA methylation
To characterize cerebellar lesions of Blbp-cre::Ctnnb1(ex3)fl/wt::Smarca4fl/rec mutants on a molecular level, we isolated DNA from FFPE punches of control and mutant cerebella at E16.5. Subsequent global DNA methylation analysis was performed using the Mouse Methylation BeadChip (Illumina). PCA based on the 10,000 most differentially methylated CpG sites showed a clear separation of control and mutant samples (Fig. 10A). ORA revealed the top 25 differentially methylated gene sets associated with neural development, GTPase activity, cytoskeleton organization, transmembrane transport, and β-catenin binding, providing further evidence for aberrant WNT signaling in the mutants (Fig. 10B). Moreover, all significantly differentially methylated GO terms designated as “biological processes” were summarized by REVIGO (Supek et al., 2011) and showed similar trends. Differential DNA methylation was detected within gene sets involved in nervous system development, signal transduction, actin/cytoskeleton organization, and transmembrane transport with a high degree of connectivity (Fig. 10C). Additionally, GO terms associated with protein phosphorylation, cell migration, and proliferation and apoptosis were identified.
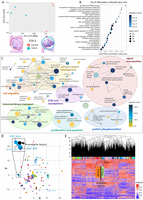
DNA methylation analysis of cerebellar lesions at E16.5. A, E16.5 control cerebella and lesions of Blbp-cre::Ctnnb1(ex3)fl/wt::Smarca4fl/rec mutants can be clearly separated according to 10,000 most differentially methylated CpG sites in PCA analysis. Recombined alleles of Smarca4 and Ctnnb1 in the cerebellar DNA of mutants were confirmed by PCR. B, Top 25 differentially methylated gene sets between controls and lesions according to adjusted p-value (methylRRA was applied; Ren and Kuan, 2019) sorted by gene ratio (count/size of gene sets). C, All significantly differentially methylated gene sets of the category “biological process” found with methylRRA were summarized by REVIGO to remove redundant terms (Supek et al., 2011). Here, 3% of the strongest GO terms pairwise similarities are designated as edges in the graph. The size of bubbles corresponds to the size of gene sets. D, UMAP embedding according to DNA methylation of cerebellar lesions of Blbp-cre::Ctnnb1(ex3)fl/wt::Smarca4fl/rec mice at E16.5 (Mouse Methylation BeadChip, Illumina) and human brain tumors (Capper et al., 2018; Sharma et al., 2019; in-house analyzed samples, total n = 1,683) using 491 orthologous CpG sites out of the 15,000 most differentially methylated CpG sites within the human dataset. Mouse samples show the most similarity to ATRT subgroups. E, Heatmap clustering according to DNA methylation of the same samples and CpG sites shows the proximity of cerebellar lesions to PGGnC [paraganglional, spinal non-CIMP (CpG island methylator phenotype)] and PTPR-A (papillary tumor of the pineal region, group A). MB, G3 = Group 3 MB; MB, G4 = Group 4 MB; MB SHH INF = infant SHH MB; ATRT, TYR = ATRT of the tyrosine kinase subgroup; ATRT, MYC = ATRT of the MYC subgroup; ATRT, SHH = ATRT of the SHH subgroup.
To compare the methylation profile of murine cerebellar lesions to human brain tumors, we integrated our data with a brain tumor dataset comprising in-house analyzed samples and previously published cohorts (Capper et al., 2018; Sharma et al., 2019). Differential methylation of 491 orthologous CpG sites efficiently separated human tumor subtypes in both UMAP and Euclidian clustering (Fig. 10D–E). However, integration of our murine cerebellar lesions yielded non-conclusive results with proximity to ATRTs in UMAP and to spinal paraganglioma in Euclidian clustering (Fig. 10D–E).
Single-cell gene expression analysis of cerebellar lesions reveals an undifferentiated nature and upregulation of WNT targets in mutant clusters
To further characterize mutant cell populations in the cerebellum of Blbp-cre::Ctnnb1(ex3)fl/wt::Smarca4fl/rec mice, we performed single-cell RNA sequencing of cerebellar cells isolated at E16.5. In UMAP embedding, mutant cerebella displayed distinct clusters that were not present in cre-negative control cerebella (Fig. 11A). According to predicted cell classes as described by La Manno et al., these mutant clusters mainly resembled radial glia, neuroblasts, and neurons (Fig. 11B; La Manno et al., 2021). Especially radial glia were overrepresented in the mutant cerebellum with a count of 2,282 cells (16.6% of total cells) compared with 886 cells (6.4% of total cells) in the control cerebellum (Extended Data Table 11-1A,B). A more detailed prediction of cell subclasses according to La Manno et al. predominantly assigned cells within mutant clusters to “hindbrain,” “hindbrain glycinergic,” “hindbrain glutamatergic,” “Bergmann glia,” or “undefined” populations (Extended Data Table 11-1C,D). Overall, the number of glutamatergic cerebellar cells in mutants was highly reduced compared with controls [3,090 in control (22.5% of total cells) vs 1,062 in mutant (7.74% of total cells); Extended Data Table 11-1C,D].
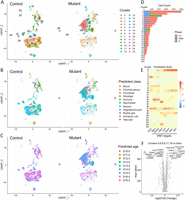
Single-cell RNA sequencing analysis at E16.5 reveals distinct mutant clusters of undifferentiated nature. A, UMAP embedding of clusters derived from single cells of control and mutant (Blbp-cre::Ctnnb1(ex3)fl/wt::Smarca4fl/rec) cerebella at E16.5. In total, 25 clusters were identified, of which Clusters 0, 6, 8, 9, 17, 19, and 24 mainly consist of mutant cells. B, Cell classes were predicted according to a murine reference dataset (La Manno et al., 2021), showing an increased number of radial glia cells in mutant clusters. Cell counts of each class are listed in Extended Data Table 11-1A and B. A more detailed prediction of cell subclasses is shown in Extended Data Table 11-1C and D. C, Age predictions according to the La Manno et al. (2021) reference dataset from E10.0 to E16.5 suggest a more undifferentiated nature of cells within mutant clusters. Respective cell counts for predicted ages are listed in Extended Data Table 11-2. D, Cell cycle analysis identified high mitotic activity in both Cluster 2 and mutant Cluster 9 with all cells assigned to the G2M and S phase. E, The expression level of Sox2 and WNT target genes is increased in mutant clusters, especially affecting Clusters 0, 9, and 17. F, DEGs in Clusters 0, 6, 8, 9, 17, and 19 compared with other clusters (labeled green with cut off at log2 fold change ≥ 1 and adjusted p < 0.01, Wilcoxon rank sum test, Bonferroni’s correction). A list of DEGs and enriched gene sets in mutant clusters is provided in Extended Data Table 11-3.
Table 11-1
Cell counts for predicted classes and subclasses in single-cell RNA sequencing analysis of control and mutant cerebella at E16.5. (A) Predicted classes in E16.5 control cerebellum. (B) Predicted classes in E16.5 mutant (Blbp-cre::Ctnnb1(ex3)fl/wt::Smarca4fl/rec) cerebellum. (C) Predicted subclasses in E16.5 control cerebellum. (D) Predicted subclasses in E16.5 mutant cerebellum. Predictions are based on a murine reference dataset (La Manno et al., 2021) with each cell assigned to the class or subclass with the highest score. Download Table 11-1, XLSX file.
Table 11-2
Cell counts for predicted age in single-cell RNA sequencing analysis of control and mutant cerebella at E16.5. Predictions are based on a murine reference dataset including data from E10.0 to E16.5 only (La Manno et al., 2021) with each cell assigned to the age with the highest score. Cells are sorted by clusters with the distribution of control and mutant cells within each cluster shown on the right side. The column ‘mean’ shows the mean predicted age averaged across cell counts for each cluster. Download Table 11-2, XLSX file.
Table 11-3
List of differentially expressed genes and enriched gene sets in mutant clusters 0, 6, 8, 9, 17, and 19 compared to remaining clusters. (A) Differentially expressed genes in mutant clusters 0, 6, 8, 9, 17, and 19 compared to remaining clusters sorted according to average log2 fold change. Wilcoxon Rank Sum test with Bonferroni correction was applied. Pct1 = percentage 1, describing the percentage of cells within mutant clusters where expression of the gene was detected; Pct2 = percentage 2, describing the percentage of cells within remaining clusters where expression of the gene was detected. (B) Gene set enrichment analysis (Wikipathway database) in mutant clusters 0, 6, 8, 9, 17, and 19 compared to remaining clusters sorted by adjusted p-value. Log2err = expected error for standard deviation of the p-value; ES = enrichment score; NES = normalized enrichment score; Size = size of gene set; leadingEdge = subset of genes accounting for the gene set's enrichment signal. Download Table 11-3, XLSX file.
Next, we predicted the age of cells according to the same reference dataset, including only data from E10.0 to E16.5 (La Manno et al., 2021). While most cells within the control clusters were assigned to E15.0-E16.5, mutant clusters also included a considerable number of cells with predicted ages between E11.0 and E14.0, hinting toward a rather undifferentiated nature of mutant cells (Fig. 11C). Cluster 6 displayed the highest deviation from expected age with a mean predicted age of 14.38 embryonic days (Extended Data Table 11-2).
Cell cycle analysis identified both Clusters 2 and 9 as mitotically active, with all cells assigned to the G2M or S phase (Fig. 11D). While Cluster 2 mainly consists of cells derived from the control cerebellum, Cluster 9 is a mutant cluster that could represent a potentially tumorigenic aberrant cell population within the lesions. Increased expression of SOX2, which stained positive in previous histological analyses of cerebellar lesions, was evident in mutant Clusters 9 and 17 and to a smaller extent in Cluster 0 (Fig. 11E). Additionally, all three clusters displayed high levels of Dkk3, Wnt5a, Dkk2, Lef1, Axin2, Dkk1, and Wif1, which have all been associated with activated WNT signaling before (Gibson et al., 2010; Zhang et al., 2011; Latour et al., 2021). The top significantly higher expressed genes within Clusters 0, 6, 8, 9, 17, and 19 compared with remaining clusters included WNT targets Wif1 and Nkd1, which both act as negative regulators of WNT signaling and also show increased expression in WNT MB (Gibson et al., 2010; Phoenix et al., 2016; Luo et al., 2021; Fig. 11F, Extended Data Table 11-3A). Moreover, genes associated with the extracellular matrix and actin cytoskeleton (e.g., Tmem132c and Lingo2) were overexpressed in mutants (Sanchez-Pulido and Ponting, 2018; Jo et al., 2019). Other highly expressed genes in mutant clusters play an important role in neurogenesis and synaptic transmission (Rbfox1, Tenm2, and Rgs6; Ahlers et al., 2016; Vuong et al., 2018; Zhang et al., 2022). In contrast, mutant clusters displayed lower expression of genes associated with the differentiation of glutamatergic cerebellar neurons (Neurod1, Pax6, and Gm2694; Engelkamp et al., 1999; Pan et al., 2009; Jin et al., 2021). GSEA further validated the upregulation of WNT signaling in mutant clusters (Extended Data Table 11-3B).
To gain insights into the origin of aberrant mutant clusters and their developmental trajectory, we performed trajectory analysis using only cells from mutant Clusters 0, 6, 8, 9, 17, and 19. According to pseudotime, cells of mutant Cluster 9 were rather assigned to the beginning of the trajectory, while Cluster 0 was distributed across all stages and Cluster 6 represented the major population at the end of the trajectory (Fig. 12A,B). RNA velocity analysis resulted in similar patterns, with cells originating from Cluster 9 and transitioning to Cluster 6 via Cluster 0 (Fig. 12C,D). Gene expression patterns along this transition first showed increasing expression of WNT targets (Lef1, Wif1, Nkd1) followed by high expression of genes associated with neuronal differentiation (e.g., Tubb3 and Map1b) in Cluster 6 (Meixner et al., 2000; Tischfield et al., 2010; Fig. 12D).
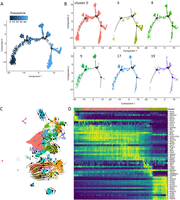
Single-cell trajectory and RNA velocity analysis of mutant cerebellum. A, B, Trajectory analysis of single cells from mutant (Blbp-cre::Ctnnb1(ex3)fl/wt::Smarca4fl/rec) E16.5 cerebella with (A) pseudotime of all cells shown or (B) cells of each cluster (according to UMAP in Fig. 11) depicted separately. Cells of Cluster 9 are rather situated at the beginning of the trajectory, Cluster 0 is distributed along the whole trajectory, and Cluster 6 forms the main cell population at the end of the trajectory. C, RNA velocity analysis according to RNA splicing applied as stream onto UMAP embedding of mutant cells (as shown in Fig. 11). Cells are transitioning from Cluster 9 to Cluster 0, within which there is less dynamic change. D, Cells are ordered according to their latent time in RNA velocity analysis, showing a transition from Cluster 9 to Cluster 6 via Cluster 0. Standardized expression of genes selected by fit-likelihood to the model is shown in the heatmap.
Analysis of in vitro proliferation and tumorigenic potential of cerebellar lesions
To evaluate the tumorigenic potential of cerebellar lesions detected in Blbp-cre::Ctnnb1(ex3)fl/wt::Smarca4fl/rec mutants, HPCs were isolated from controls and mutants at E14.5. Cumulative PD during cell culture as neurospheres for four weeks did not show any significant differences between the proliferation of cre-negative controls, mutants (Blbp-cre::Ctnnb1(ex3)fl/wt::Smarca4fl/rec), and heterozygous mutants (Blbp-cre::Ctnnb1(ex3)fl/wt::Smarca4fl/wt; Fig. 13A). Morphologically, neurospheres of mutants did not differ from controls (Fig. 13B,C). Moreover, mutants maintained dependency on EGF and FGF in adherent cell cultures on PLO-coated wells (Fig. 13D–G). IF stainings at early time points in culture (Passage 0) showed a loss of SMARCA4 in the majority of cells derived from mutants (Fig. 13H). However, the percentage of SMARCA4-positive cells significantly increased until Passage 1, suggesting a selection for SMARCA4-positive cells in vitro over time (t = 5.223, DF = 3.898, p = 0.0069, Welch's t test; Fig. 13I,J). According to IF costaining of SMARCA4 and BrdU, SMARCA4-positive cells already showed significantly higher proliferation at Passage 0 in mutants (t = 3.297, DF = 3, p = 0.0458, paired t test; Fig. 13K). Additionally, an evaluation of recombined β-catenin in DNA isolated at different passages of mutant HPCs showed a loss of the recombined allele from Passage 2 (Fig. 13L). Altogether, data pointed toward a loss of recombined cells after HPC culture from mutant cerebella in vitro. We hypothesized that the in vitro environment did not provide the required scaffold and paracrine signals from surrounding cells needed for survival and extensive proliferation of recombinant cells. Therefore, we transplanted E14.5 HPCs of controls, mutants, and heterozygous mutants (n = 10 each) into the cerebella of adult immunodeficient mice to evaluate tumorigenic potential in vivo. To avoid negative selection of recombined cells, we performed transplantation directly after papain digestion and singularization of hindbrain tissue (Fig. 13M). However, no tumor development was detected in any of the groups 6 months after transplantation. To further evaluate the impact of an embryonic microenvironment on cell proliferation, we cultured cerebellar explants of E14.5 mutant cerebella on coated dishes without dissociation into single cells. In this setting, SMARCA4-deficient cells efficiently migrated from the explants and showed significantly increased proliferation compared with SMARCA4-positive cells (t = 3.697, DF = 9, p = 0.0049, paired t test; Fig. 13N,O). Altogether, these observations suggest an important role of the embryonic microenvironment in the development of lesions and maintenance of high proliferation.
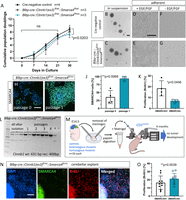
Mutant cerebellar cells show decreased growth in vitro and no tumorigenic potential after transplantation but increased proliferation when cultured as cerebellar explants. A, Cumulative PD of HPCs grown as neurospheres isolated at E14.5 from controls, heterozygous mutants (Blbp-cre::Ctnnb1(ex3)fl/wt::Smarca4fl/wt), and homozygous mutants (Blbp-cre::Ctnnb1(ex3)fl/wt::Smarca4fl/rec) with weekly passaging. No significant difference observed on Days 7, 14, and 21 in culture but slightly reduced cumulative PD in homozygous mutants vs controls at Day 30 (mean = 7.390 and 8.884, respectively; Tukey's multiple-comparisons test after two-way ANOVA, adjusted p = 0.023, q = 5.884, DF = 4.964). N corresponds to biological replicates . B, C, Morphologically, neurospheres of controls and homozygous mutants do not differ from each other (both Passage 0). D–G, Both mutant and control HPCs show adherent growth when seeded in PLO-coated wells after dissociation with a dependency on EGF/FGF for cell growth (both Passage 1, 4 d after seeding). H–J, SMARCA4 IF staining of neurosphere cytospins shows a loss of SMARCA4 at Passage 0 (Day 7) in the majority of cells, which is almost undetectable at Passage 1 (Day 14). J, Statistic evaluation of SMARCA4 IF stainings shows an increase of SMARCA4-positive cells in mutant HPC neurosphere cultures from Passage 0 to Passage 1. K, IF costaining of SMARCA4 and BrdU in mutant HPC neurospheres at Passage 0 reveals significantly reduced proliferation of SMARCA4-deficient cells. L, PCR for recombined Ctnnb1 with DNA isolated from mutant HPC neurosphere pellets at isolation and at Passages 1–4. M, Transplantation of E14.5 hindbrains (n = 10 of each control, heterozygous mutants, and homozygous mutants) into immunodeficient CD1nu/nu mice did not result in tumor development. N, SMARCA4 and BrdU IF costaining of Blbp-cre::Ctnnb1(ex3)fl/wt::Smarca4fl/rec E14.5 cerebellar explants at Day 4 of culture. O, SMARCA4-negative cells show significantly higher proliferation compared with SMARCA4-positive cells in Blbp-cre::Ctnnb1(ex3)fl/wt::Smarca4fl/rec cerebellar explant culture as evaluated by IF stainings (t = 3.697, DF = 9, p = 0.0049, paired t test). Scale bar in B corresponds to 200 µm (applicable to C), in D to 200 µm (applicable to E–G), and in H and N to 100 µm (applicable to I).
Discussion
In this work, we generated Blbp-cre::Ctnnb1(ex3)fl/wt::Smarca4fl/rec mice that were not viable after birth but presented highly proliferative lesions in the embryonic cerebellum. Lesions did not occur upon alteration of Ctnnb1 or Smarca4 alone, which provides proof for a cooperative interaction between aberrant WNT signaling and a loss of SMARCA4. An in-depth analysis of lesions by histology, DNA methylation profiling, and single-cell RNA sequencing revealed their probable cellular origin and potentially involved deregulated pathways. Furthermore, in vitro experiments showed a negative selection of recombined cells and suggested an important role of the embryonic microenvironment in the development of lesions.
Our first observation was the severe phenotype of Blbp-cre::Ctnnb1(ex3)fl/wt mice with short survival, severe hydrocephalus, and hypoplastic cerebella that was not described before (Gibson et al., 2010). Fate mapping confirmed much broader recombination driven by our Blbp-cre line than previously published, which could easily explain the discrepancy between phenotypes (Gibson et al., 2010). In fact, our model displayed phenotypes similar to previously described hGFAP-cre::Ctnnb1(ex3)fl/wt mice with hydrocephalus, hypoplastic cerebella, and underdeveloped cerebral cortices (Pöschl et al., 2013). Consequently, it is quite probable that our Blbp-cre line encompasses a broad overlap with cell populations targeted by hGFAP-cre in the brain. This is further supported by phenotypes of our Blbp-cre::Smarca4fl/fl mutants at P0, which resemble previously described hGFAP-cre::Smarca4fl/fl mice (Holdhof et al., 2020). A mix-up of mouse lines per accident was ruled out by the detection of lacZ in the PCR analysis of our Blbp-cre mice (data not shown). Furthermore, our Blbp-cre::Ctnnb1(ex3)fl/wt mutants did not develop other characteristics specific to hGFAP-cre::Ctnnb1(ex3)fl/wt mice such as no development of fur, missing ability to open their eyes or missing hippocampal structures (Pöschl et al., 2013). Hydrocephalus is also known to occur spontaneously in C57Bl6/J mice and can be enriched by inbreeding (Vogel et al., 2012). Therefore, we evaluated the influence of the genetic background by performing backcrossings of our Ctnnb1(ex3)fl/fl and Blbp-cre lines to both C57Bl6/J and 129S2/Sv mice for at least five generations. However, both variations did not result in any alteration of the phenotype in Blbp-cre::Ctnnb1(ex3)fl/wt offspring (data not shown). Consequently, we hypothesize that the difference in cre expression is a result of genetic drift between our Blbp-cre line and previously used colonies, a common phenomenon for inbred mouse strains (Stevens et al., 2007; Benavides et al., 2020).
Cell accumulations in the brainstem lesions of our Blbp-cre::Ctnnb1(ex3)fl/wt mice were similar to those described before and can be attributed to stalled migration of mossy fiber neuron precursors (Gibson et al., 2010). The additional non-proliferative cell accumulations in the cerebellum of our mice might similarly consist of neural progenitors unable to differentiate and migrate to their final position in the cerebellum. This is further supported by their expression of SOX2 and nestin and the absence of markers associated with more differentiated cell types. The fact that Blbp-cre::Ctnnb1(ex3)fl/wt::Smarca4fl/rec mice did not develop any cell accumulations in the brainstem suggests that SMARCA4 loss prevents stalled migration of mossy fiber neuron precursors. Since SMARCA4 plays an important role in neurogenesis, a loss of SMARCA4 might hamper early differentiation toward this lineage, consequently also blocking their accumulation (Matsumoto et al., 2006; Holdhof et al., 2020).
In contrast to cell accumulations in the postnatal cerebellum, embryonic cerebellar lesions in Blbp-cre::Ctnnb1(ex3)fl/wt::Smarca4fl/rec mutants were highly proliferative and vastly expanded from E13.5 to E16.5. Lesions were localized in the VZ, stained positive for SOX2, and prevented the formation and migration of PAX2-positive interneuron progenitors. This observation suggests an origin in GABAergic progenitors, which reside in the VZ in embryonic brain development and give rise to Purkinje cells and inhibitory interneurons (Martinez et al., 2013; van Essen et al., 2020). However, Zhang et al. have recently described a SOX2-positive progenitor cell population that can give rise to all known cerebellar precursors of both URL and VZ and could be affected by Blbp-targeted recombination (Hegedus et al., 2007; Zhang et al., 2021).
The count of Blbp-cre::Ctnnb1(ex3)fl/wt::Smarca4fl/rec mutants was as expected from E12.5 until E16.5 but highly reduced at E18.5 and P0, suggesting prenatal lethality induced by the expanding lesions. Moreover, the few mutants found at E18.5 and P0 did not develop cerebellar lesions, which we attributed to the missing recombination of Ctnnb1 as detected by PCR. Different degrees of recombination between animals of the same genotype have been described before, for example, in GFAP-cre–driven models (Requardt et al., 2009; Pöschl et al., 2013). Moreover, floxed alleles have differential sensitivities to cre-mediated recombination, which could explain a more efficient recombination of Smarca4 than Ctnnb1 in our mice (Liu et al., 2013; Luo et al., 2020). In addition to this phenomenon, we detected germline recombination of Smarca4 in all offspring of cre-positive mothers, which highly influenced observed phenotypes. A recent evaluation of recombination in CNS-specific cre-driver lines revealed unexpected germline recombination as a very common phenomenon, affecting more than half of all commonly used lines (Luo et al., 2020). In our model, germline recombination of one Smarca4 allele was essential for the development of cerebellar lesions in mutants. These observations stress the necessity to test for germline recombination in every new cre-driven mouse model.
The fact that lesions were not located in the brainstem but in the cerebellum and stained positive for GLUT-1 indicating a functional blood–brain barrier argues against similarity to early tumorous lesions in the WNT MB model Blbp-cre::Ctnnb1(ex3)fl/wt::Trp53fl/fl (Gibson et al., 2010). This was also reflected by our comparison of global DNA methylation of cerebellar lesions to human brain tumors, which did not yield a reliable match. Hence, our model probably does not recapitulate the biological origin of WNT MB in the mossy fiber neuron lineage. However, the transformation of cells in the cerebellar VZ raises the question if other cell populations might be prone to tumor development upon deregulated WNT signaling and chromatin remodeling. Moreover, our Blbp-cre::Ctnnb1(ex3)fl/wt::Smarca4fl/rec model is the first one to show a cooperative effect between mutated β-catenin and loss of SMARCA4 in promoting extensive proliferation. Others have hypothesized before that the development of WNT MB requires disruption of chromatin remodeling at WNT-responsive genes in addition to the stabilization of β-catenin (Robinson et al., 2012). This is reflected by the finding that WNT MB not only show a high frequency of SMARCA4 mutations but also of other chromatin modifiers such as acetyltransferase CREBBP, BAF complex subunits ARID1A/ARID2, or methyl transferase KMT2D (Robinson et al., 2012; Northcott et al., 2017; Gajjar et al., 2021). Nuclear β-catenin can directly interact with both SMARCA4 and CBP proteins to regulate transcription of WNT-responsive genes (Mosimann et al., 2009; Sharma et al., 2023). Changing or eliminating this interaction might be essential for the transformation of cells since both Ctnnb1 and Smarca4 alterations on their own did not suffice to form lesions.
Molecular analysis of cerebellar lesions revealed aberrant WNT signaling and deregulated organization of the actin cytoskeleton on both DNA methylation levels and in single-cell RNA sequencing. Remodeling of the actin and tubulin cytoskeleton is essential for brain tumor cell migration and invasion and emphasizes the potentially tumorigenic nature of cerebellar lesions (Hall, 2009; Nürnberg et al., 2011). Furthermore, mutant clusters identified in single-cell RNA sequencing revealed characteristics of radial glia cells with a resemblance to early embryonic ages, which supports their previously suspected origin in early progenitor cells. The fact that the majority of glutamatergic cerebellar cells were missing in mutants compared with controls suggests that progenitors of the glutamatergic lineage were affected by recombination, again reinforcing the theory about an origin in SOX2-positive bipotent cerebellar progenitors (Zhang et al., 2021). Additionally, we identified high mitotic activity specifically in mutant Cluster 9, which could represent the cellular origin of cerebellar lesions according to trajectory and RNA velocity analysis.
In vitro, HPCs of Blbp-cre::Ctnnb1(ex3)fl/wt::Smarca4fl/rec mutants did not show increased proliferation and were prone to selection for non-recombined cells over time. We have shown before that SMARCA4-deficient neurospheres have a selection disadvantage in vitro (Holdhof et al., 2021a). However, even direct transplantation of mutant HPCs into adult immunodeficient mice did not induce brain tumor formation, which argues against their tumorigenic potential. Nevertheless, the tumorigenic potential of Ctnnb1 and Smarca4 altered cells might depend on an embryonic microenvironment that cannot be provided by adult brain tissue of immunodeficient mice. This was supported by cerebellar explant cultures without dissociation into single cells, which resulted in increased proliferation of SMARCA4-deficient HPCs migrating from the explants. Consequently, the scaffold provided by the extracellular matrix and a variety of surrounding embryonic cell types might play an important role in the development of lesions. Therefore, transplantation of mutant HPCs into younger mice such as P0 pups might provide a more suitable environment for the development of tumors (Ho et al., 2020; Olivetti et al., 2020).
Altogether, our new mouse model provides the first evidence for a cooperative effect of aberrant WNT signaling and a SMARCA4 deficiency in driving cell transformation. Our findings on deregulated genes and pathways involved and the suggested importance of the tumor microenvironment might pave the way to identify new therapeutic targets for tumors affected by both alterations.
Data Availability
Raw and processed data may be obtained from Gene Expression Omnibus under the accession numbers GSE240627 for DNA methylation data and GSE241018 for single-cell RNA sequencing data. All other data or materials used in this study are available upon request.
Footnotes
- Received August 24, 2023.
- Revision received January 26, 2024.
- Accepted January 31, 2024.
-
This work was supported by the Deutsche Krebshilfe, Bonn, Germany (#70113754). Ulrich Schüller was additionally supported by the Fördergemeinschaft Kinderkrebszentrum Hamburg, Germany. We thank Jacqueline Tischendorf, Vanessa Thaden, Margarethe Gregersen, Jessica Prey (University Medical Center Hamburg–Eppendorf, Germany), Gundula Pilnitz-Stolze and Arne Düsedau (Leibniz Institute of Virology, Hamburg, Germany), and Kristin Hartmann (Mouse Pathology Facility, University Medical Center Hamburg–Eppendorf) for their excellent technical support. We thank the diagnostic team at the Institute of Neuropathology for their histological help and the Single Cell Core Facility of the University Medical Center Hamburg–Eppendorf for their support. We thank Dr. Pierre Chambon (IGBMC, Illkirch-Graffenstaden, France) for providing the Smarca4fl/fl mouse strain and Dr. Makoto M. Taketo (Kyoto University, Kyoto, Japan) for providing Ctnnb1(ex3)fl/fl mice. Finally, we acknowledge the support of the small animal models core facility of the Leibniz Institute of Virology, Hamburg, Germany.
-
The authors declare no competing financial interests.
- Correspondence should be addressed to Ulrich Schüller at u.schueller{at}uke.de.
- Copyright © 2024 the authors




