Coupling of Sharp Wave Events between Zebrafish Hippocampal and Amygdala Homologs
- Ismary Blanco1,
- Adam Caccavano1,
- Jian-Young Wu1,2,
- Stefano Vicini1,3,
- Eric Glasgow4, and
- Katherine Conant1,2
- 1Interdisciplinary Program in Neuroscience, Georgetown University Medical Center, Washington, DC 20057
- 2Departments of Neuroscience, Georgetown University Medical Center, Washington, DC 20057
- 3Pharmacology and Physiology, Georgetown University Medical Center, Washington, DC 20057
- 4Oncology, Georgetown University Medical Center, Washington, DC 20057
-
Author contributions: I.B., S.V., and K.C. designed research; I.B. performed research; E.G. and K.C. contributed unpublished reagents/analytic tools; I.B., A.C., J.-Y.W., S.V., and K.C. analyzed data; I.B. wrote the paper.
Abstract
The mammalian hippocampus exhibits spontaneous sharp wave events (1–30 Hz) with an often-present superimposed fast ripple oscillation (120–220 Hz) to form a sharp wave ripple (SWR) complex. During slow-wave sleep or quiet restfulness, SWRs result from the sequential spiking of hippocampal cell assemblies initially activated during learned or imagined experiences. Additional cortical/subcortical areas exhibit SWR events that are coupled to hippocampal SWRs, and studies in mammals suggest that coupling may be critical for the consolidation and recall of specific memories. In the present study, we have examined juvenile male and female zebrafish and show that SWR events are intrinsically generated and maintained within the telencephalon and that their hippocampal homolog, the anterodorsolateral lobe (ADL), exhibits SW events with ∼9% containing an embedded ripple (SWR). Single-cell calcium imaging coupled to local field potential recordings revealed that ∼10% of active cells in the dorsal telencephalon participate in any given SW event. Furthermore, fluctuations in cholinergic tone modulate SW events consistent with mammalian studies. Moreover, the basolateral amygdala (BLA) homolog exhibits SW events with ∼5% containing an embedded ripple. Computing the SW peak coincidence difference between the ADL and BLA showed bidirectional communication. Simultaneous coupling occurred more frequently within the same hemisphere, and in coupled events across hemispheres, the ADL more commonly preceded BLA. Together, these data suggest conserved mechanisms across species by which SW and SWR events are modulated, and memories may be transferred and consolidated through regional coupling.
Significance Statement
We provide a comprehensive analysis of spontaneous activity within the telencephalon of juvenile zebrafish, demonstrating that sharp wave ripples (SWRs) are intrinsically generated and maintained within this structure. SWs are modulated by the cholinergic system and possibly other cortical/subcortical areas. We also show that SW events are associated with neuronal ensemble activity. Additionally, we provide evidence that the basolateral amygdala (BLA) exhibits SWR events. Spontaneous activity between the anterodorsolateral lobe (ADL) and BLA shows bidirectional communication, suggesting conserved mechanisms by which learned experiences are transferred and consolidated in this vertebrate. Findings showcase conserved memory-related mechanisms between mammals and zebrafish, supporting the use of zebrafish to better understand molecular/cellular mechanisms that interfere with processes critical to learning and memory consolidation.
Introduction
During periods of awake immobility and slow wave sleep, the mammalian hippocampus exhibits intrinsic spontaneous neural activity/oscillations characterized by a relatively slow (1–30 Hz) strong deflection or sharp wave (SW) event, with an often-present superimposed fast ripple oscillation (150–250 Hz for rodents and 80–140 Hz for humans). When an SW event is associated with at least one ripple event, they are referred to as a sharp wave ripple (SWR) complex (Buzsáki et al., 1983; Buzsáki, 1996, 2015; Skaggs and McNaughton, 1996). SWRs are associated with the rapid and sequential replay of hippocampal place cell assemblies previously activated during learning experiences (Joo and Frank, 2018). Moreover, bidirectional coupling between the hippocampus and other brain regions through SWR events is crucial for learning and memory (Buzsáki, 1986, 1996, 2015; Buzsaki et al., 1992; Fell et al., 2001; Axmacher et al., 2006; Ego-Stengel and Wilson, 2009; Girardeau et al., 2009, 2014; Schlingloff et al., 2014; Colgin, 2016; Sadowski et al., 2016; Mégevand et al., 2017; Sjulson et al., 2018; Jones et al., 2019; Skelin et al., 2021).
Human studies have corroborated the translational relevance of using mammalian models for recording and measuring spontaneous activity, including SWR events by showing that these events are critical for memory consolidation and recall (Feng et al., 2018; Norman et al., 2019; Vaz et al., 2020). Evidence shows that electrical or optogenetic disruption of SWRs impairs these processes (Ego-Stengel and Wilson, 2009; Girardeau et al., 2009; Jadhav et al., 2012). Additionally, bidirectional communication between brain regions is crucial for the integration of sensory/contextual modalities of the learned experience (Katori et al., 2018; Sjulson et al., 2018; Cox et al., 2020; Skelin et al., 2021).
In addition to the hippocampus, the basolateral amygdala (BLA), a subcortical brain region integral for the processing, consolidation, and recall of emotional memories (Stork and Pape, 2002; McGaugh, 2004; Bocchio et al., 2017; O’Neill et al., 2018; Pignatelli and Beyeler, 2019), exhibits SWRs (Paré, 2002; Ponomarenko et al., 2003; Popescu and Paré, 2011; Perumal et al., 2021). In humans, Cox et al. (2020) showed that SWRs in the amygdala are temporally coupled to hippocampal SWRs during nonrapid eye movement sleep, which may allow for the consolidation of hippocampal-dependent memories accompanied by emotional valence. Though much is known about spontaneous neuronal activity and specifically SW and SWR events in the mammalian hippocampus, less is known regarding the modulation of these events in the zebrafish hippocampus homolog—the anterodorsolateral lobe (ADL). Moreover, potential regional coupling has not been examined. The zebrafish is a vertebrate with brain anatomy that differs from mammals (Porter and Mueller, 2020), despite remarkable gene homology to humans (Howe et al., 2013). It is widely used in biomedical research due to their ability to perform complex behavioral tasks, high-throughput drug screening, and whole-brain calcium imaging (Tavares and Santos Lopes, 2013; Freeman et al., 2014; Kalueff et al., 2014; Cassar et al., 2020; Bashirzade et al., 2022).
Vargas et al. (2012) previously described spontaneous activity in the ADL of adult zebrafish through local field potential (LFP) recordings of ex vivo whole-brain preparations, finding that these events were composed of an SW event with embedded ripples modulated by excitation and inhibition. Previously, we also showed the presence of SWR events in juvenile zebrafish (Blanco and Conant, 2020), and in the current study, we sought to better understand the generation of these events by leveraging a novel in vitro model using de-tectomized (telencephalon-only) preparations. Additionally, we combined single-cell confocal calcium imaging and LFP recordings in the ADL of whole-brain preparations to visualize the firing pattern of single neurons in relation to SW events. Moreover, dual LFP recordings were performed to access the temporal coupling of SW events between the ADL and the BLA. Finally, we investigated the modulation of SW events by the cholinergic system. Our findings support the conservation of memory-related processes across species and suggest that zebrafish can be an appropriate model to study mechanisms by which SWR events and regional coupling may be modulated.
Materials and Methods
Experimental animals
Zebrafish were housed in groups of 10–20 in 2 L tanks with water temperature kept at 28°C. Female and male juvenile zebrafish were used without sex distinction due to our inability to confidently separate them due to their age. In our colonies, however, we expect an approximate ratio of 50:50 females and males. Zebrafish were fed either once or twice a day and were maintained on a 14/10 h light/dark cycle (lights on 9 A.M. and lights off at 11 P.M.). All procedures were performed in accordance with the Institutional Animal Care and Use Committee of Georgetown University, Washington, DC, Protocol #2020-0034 (Table 1).
SW/SWR events are modulated by GABAA and AMPA but not by NMDA receptor signaling
Strain and developmental period of the zebrafish used
Local field potential
LFP recordings were done in whole-brain and de-tectomized (carefully removing the tectum using a sharp blade and cutting straight down between the telencephalon and tectum) ex vivo preparations from juvenile zebrafish. Recordings were obtained after zebrafish were deeply anesthetized with an overdose of Tricaine-S (MS-222, Syndel, Bin A02F01G, ANADA # 200-226), and their brains were extracted with the olfactory bulb intact.
Recovery period
After extraction, the preparations were incubated in a chamber containing oxygenated (95% O2, 5% CO2) artificial cerebrospinal fluid (aCSF) previously described by Brenet et al. (2019), containing the following (in mM): 134 NaCl, 2.9 KCl, 2.1 CaCl2, 1.2 MgCl2, 10 HEPES, and 10 glucose, pH 7.4 for at least 30 min at room temperature.
Recordings
We acquired 20–90 min of LFP recordings per animal—each animal is an n of 1. Recordings were obtained from the ADL in the telencephalon, previously described by Vargas et al. (2012) to exhibit spontaneous events characterized as SW with (SWR) and without embedded ripples similar to mammals. SW and SWRs were also recorded from the BLA.
Electrode
Electrodes were made from borosilicate glass pipettes pulled using a Sutter P87 puller with 5 controlled pulls, resulting in an approximate 150 kΩ tip resistance. The electrodes were filled with aCSF.
Bath perfusion
The preparations were constantly perfused with oxygenated aCSF inside a submerged recording chamber at a high flow rate (20 ml/min) at room temperature.
Drugs
In vitro
The drugs used in whole brains from juvenile zebrafish are shown in Table 2. Stock concentrations were dissolved in distilled water. After recovery, brains were transferred to the recording chamber and baseline LFP was obtained. After ∼20–30 min of baseline, the desired drug was added to the perfusion bath and recordings were continued for another 30–40 min.
Drugs used in whole brains from juvenile zebrafish
Concomitant local field potential and calcium imaging
For calcium imaging, ex vivo whole brains from Tg(elevI3:Hsa:H2B:GCaMP6s)jf5 juvenile zebrafish (Freeman et al., 2014) were kept in oxygenated aCSF at room temperature to recover for a minimum of 30 min. After the recovery period was completed, brains were moved to an upright laser scanning confocal microscope system (Thor Imaging Systems Division) with constant perfusion and held down using a SHD-42/15 WI 64-1420 Harp (Warner Instruments) for recording both LFP in the ADL and single-cell Ca2+ transient activity in the entire telencephalon. The microscope was equipped with a 488 nm laser to visualize Ca2+ transient activity. Time-lapse videos were captured using 512 × 512 pixel frames at a sample rate of 10 Hz. Imaging was done using a 20/40× objective and an imaging field of 100–150 mm to ensure a complete view of the telencephalon while retaining single-cell resolution.
Local field potential and calcium imaging analysis
Analysis of LFP recordings was performed using a custom MATLAB script previously described (Caccavano et al., 2020), with some modifications. After removing 60 Hz line noise and its high-frequency harmonics, a Gaussian finite impulse response bandpass filter with corrected phase delay was applied between 1 and 1,000 Hz and subsequently filtered between 1 and 30 Hz for detecting the SW and 120–220 Hz for ripples. The root mean square (RMS) of the SW and ripple was computed in sliding 30 and 5 ms windows, respectively. SW and ripple events were detected from the RMS signals that exceeded 6 and 4 standard deviations (SDs) above baseline, while the event start and end times were determined when the RMS signals exceeded 4 and 3 SDs above baseline, respectively. SWR events were defined as a subset of SW events with a concurrent ripple. For both SWs and ripples, events with a duration of <25 ms were discarded, and successive events with <150 ms interevent interval were treated as one continuous event. To determine the baseline SD for each RMS signal in a way that accounts for both inactive and active recordings, the entire time series was binned into a histogram, and a two-term Gaussian fitting technique was employed to estimate both the baseline noise and true signal.
Calcium imaging data were first preprocessed with custom ImageJ (FIJI) macros previously described (Caccavano et al., 2020), before analysis in MATLAB. Raw image stacks were corrected for photobleaching, which was modeled as an exponential decay. Circular region of interests (ROIs) were manually placed around cell somas. For regional ROIs, neuronal clusters were chosen based on the pattern of activation before and during a silent period (moments with no detectable LFP activity). The change in fluorescence over total fluorescence (ΔF/F) was then computed as (F − F0)/(F0 − Fb), where F0 was defined as the average of the 10 lowest intensities for each ROI, and Fb was defined as the lowest intensity pixel across the entire image and time series. These ROI time series were subsequently imported into MATLAB for coincidence detection with the LFP. Slow changes in the baseline fluorescence were corrected with a smoothed moving average spanning 25% the duration of the file. ΔF/F signals were then interpolated from a 100 ms (10 Hz) to a 2 ms (500 Hz) sampling rate, while the LFP was down-sampled to the same common sampling rate. Calcium transients were detected above 6 SD of each ΔF/F signal, with event start and end times determined when the ΔF/F exceeded 4 SD. The baseline SD and event detection was carried out by the same algorithm as described for the SW and ripple detection.
Classification of calcium transient–SWR coincidence and ensemble participation was performed as previously described (Caccavano et al., 2020). A calcium transient event was categorized as coincidental with an SWR event if there was any overlap in the start and end between these events. If no overlap was found, calcium transients were considered spontaneous. The ensemble participation of cells during SWRs was investigated by constructing a simplified Boolean event matrix with the SWR in one dimension and cellular participation in the other. A Jaccard similarity index was computed pairwise between each SWR event, in which a value of zero signified two SWR events had no cellular participation in common and a value of one signified exact overlap of cellular participation.
Peak coincidence difference calculation after time-locking of SW events
The peak coincidence difference between events from the ADL and BLA was determined using a threshold of 100 ms, above which events were considered noncoincident. Any two events within a 5 ms peak coincidence difference were considered simultaneous. Coincident events with a positive peak coincidence difference (5–100 ms) were considered ADL preceding whereas those with negative peak coincidence difference (−100 to −5 ms) were considered ADL succeeding. Relative frequency histograms of the peak coincidence differences were plotted as positive values for the ROI. To ensure coincidence detection occurred at greater than chance levels, the BLA time series was shuffled 1,000 times with a random offset value from 0 to the length of the file, the peak coincidence detection repeated, and the fraction of coincident events calculated for each. The fraction of coincident shuffled events and the true unshuffled fraction were plotted as histograms to confirm the unshuffled coincidence detection was significantly greater than the shuffled data.
Electrical stimulation
PMPa was electrically stimulated (n = 3 whole-brain preparations) with a glass microelectrode with a tip opening of 10–50 µm (∼50 kΩ). The stimulus pulse duration was 0.05 ms (generated by a Masters 8 stimulator); 100 pulses at 50 Hz were used. The stimulus intensity was 1–5 µA.
DiI dye injections
1,1′-Dioctadecyl-3,3,3′,3′-tetramethylindocarbocyanine perchlorate (DiI) is a lipophilic fluorescence (red) molecule that diffuses within cell membrane. It is used as a retrograde tracer to investigate connections between two regions. We used 0.2 mg/ml DiI (Invitrogen, DiI’; DiIC18(3), catalog #D282) in 100% ethyl alcohol (Sigma-Aldrich, catalog #E7023) for injections into the PMPa region. Freshly dissected zebrafish brains were positioned under a stereomicroscope equipped with a pipette micromanipulator. Three to five nanoliters of DiI were pressure injected into the PMPa. After injections, zebrafish brains were stored in 4% PFA at room temperature in the dark for over 2 weeks. Images were taken using an upright laser scanning confocal microscope system (Thor Imaging Systems Division) at 20× in different planes.
Code accessibility
Open-source and available in public repositories, including versions under development (GitHub) as well as archival copies used for this manuscript (Zenodo). MATLAB R2022a functions are available at https://github.com/acaccavano/SWR-Analysis (archival copy: DOI: 10.5281/zenodo.10463625). ImageJ (FIJI) macros are available at https://github.com/acaccavano/deltaFoF (archival copy: DOI: 10.5281/zenodo.362513).
BioRender
Figures were created with BioRender.com.
Statistics
All statistical tests were done using GraphPad Prism 10. Data normality and outlier test were analyzed when appropriate using the Shapiro–Wilk test and the ROUT outlier test, respectively. Paired and unpaired Student's t tests were performed for groups of two nonindependent and independent datasets, respectively. Tukey's multiple-comparisons test was conducted as the post hoc test following a significant one-/two-way ANOVA. The chi-square (X2) test was also performed for categorical variables.
Results
SWRs are intrinsically generated and maintained within the zebrafish telencephalon
Murine hippocampal slices exhibit SWR events while lacking cortical and subcortical connections, suggesting their intrinsic hippocampal generation and maintenance (Buzsáki et al., 1983; Maier et al., 2003). To characterize the spatial generation and maintenance of SWR events in juvenile zebrafish, independent LFP recordings were performed from the ADL of whole brains and de-tectomized (telencephalon only) preparations (Fig. 1A, top). Like whole-brain recordings, de-tectomized preparations exhibited SWR events composed of an SW (1–30 Hz) with the occasional embedded fast oscillatory ripple (120–220 Hz; Fig. 1A, bottom), suggesting their local generation and maintenance within the telencephalon. The multiband spontaneous activity of the ADL exhibited SW events containing from subthreshold ripples to ripple doublets (Fig. 1B,C). Recordings revealed a significant increase in the abundance of SW events in de-tectomized (13.87 ± 1.015) compared with that in whole-brain (10.68 ± 0.964) preparations (unpaired t test; t(33) = 2.279; p = 0.0293; Fig. 1D). The amplitude of SW events was unchanged (unpaired Student's t test; t(28) = 0.9252; p = 0.3628; Fig. 1E); however, removing the tectum and other extra-telencephalic areas increased their duration (unpaired t test; t(33) = 3.507; p = 0.0013; Fig. 1F). Additionally, de-tectomized preparations exhibited an approximate 12-fold increase in the percentage of SW events with embedded ripples (Mann–Whitney test; U = 14; p = 0.0001; Fig. 1G). Given that only 39% of whole-brain recordings exhibited at least 10 SWR events, further analyses comparing SWR events between whole-brain and de-tectomized preparations were not performed. Together, the data show that SWR events are intrinsically generated and maintained within the telencephalon and SW abundance and duration may be modulated by extra-telencephalic brain regions.
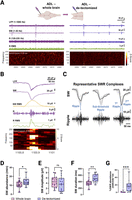
SWR events are locally generated and maintained within the telencephalon. Basic properties of SW events between whole-brain and de-tectomized preparations. A, Top, Representative electrode placement positions in the ADL of whole-brain preparations (left) and de-tectomized preparations (right). LFP recordings were done independently in either whole-brain or de-tectomized preparations. Bottom, Representative traces with LFP, SW, R (ripple), and R root mean square (RMS). Frequency spectrogram is also shown. B, A representative trace from a whole-brain preparation showing LFP, SW, SW RMS, R, and R RMS together with the spectogram frequency for better ripple frequency visualization. C, Representative SWR complexes from a whole-brain recording showing an SW containing a single ripple (left), one with subthreshold (middle), and one with a ripple doublet. D, Quantification of SW abundance (nwhole brain = 18; nde-tectomized = 17); E, amplitude (nwhole brain = 16; nde-tectomized = 14); and F, duration (nwhole brain = 18; nde-tectomized = 17) between whole-brain and de-tectomized recordings. G, Quantification of the percentage of SW events with at least one embedded ripple (nwhole brain = 10; nde-tectomized = 17). ROUT test was performed for each quantification. Unpaired t test and Mann–Whitney tests were performed. *p < 0.05, **p < 0.005, ***p < 0.0005.
SW events are known to be modulated by excitation and inhibition in both mammals and adult zebrafish (Ylinen et al., 1995; Maier et al., 2003; Behrens et al., 2005; Wu et al., 2005; Sipilä et al., 2006; Vargas et al., 2012; Schlingloff et al., 2014; Buzsáki, 2015; Eller et al., 2015); therefore, to characterize the susceptibility of these events to changes in excitation and inhibition in juvenile zebrafish, whole-brain preparations were exposed to 30 μM AP-5, an NMDA receptor antagonist; 25 μM AP-5 + 5 μM NBQX, an AMPA and kainate receptor antagonist for glutamatergic signaling elimination; or 30 μM BMI, a GABAA receptor antagonist (Fig. 2). Blocking NMDA receptors did not affect the average abundance (paired t test; t(7) = 1.357; p = 0.2169), amplitude (paired t test; t(7) = 0.3872; p = 0.7101), or duration (paired t test; t(7) = 0.1375; p = 0.8945) of SW events (Fig. 2A,B). The percentage of SW events containing an embedded ripple was also unchanged (paired t test; t(7) = 0.1705; p = 0.8694; Fig. 2B). However, the addition of 5 μM NBQX to the bath solution in the presence of 25 μM AP-5 abolished these events (paired t test; t(3) = 4.867; p = 0.0166; Fig. 2C,D). Furthermore, the GABAA receptor antagonist BMI (30 μM) did not change the abundance of spontaneous events (paired t test; t(7) = 0.1850; p = 0.8585) or their amplitude (paired t test; t(7) = 0.6274; p = 0.5503) but it increased their duration (paired t test; t(7) = 4.544; p = 0.0027; Fig. 2E,F). The increase in SW duration without a change in abundance, prompted us to investigate whether inhibiting GABAA receptors modulated the ripple oscillations associated with the SW events. We found that GABAA receptor inhibition significantly increased the occurrence of ripple oscillations associated with the SW (paired t test; t(7) = 3.067; p = 0.0182). Ripple power was also increased (paired t test; t(7) = 2.384; p = 0.0486; Fig. 2H). Thus, while BMI had no effect on the overall abundance of all SW events, it did enhance and elongate the ripple oscillation. The increase in the excitability of the system due to BMI exposure is congruent with what is reported in the rodent literature (Gulyás and Freund, 2015) and in adult zebrafish after disinhibition (Vargas et al., 2012). The results are shown in Table 3. Overall, these data suggest that spontaneous events in the ADL of zebrafish are modulated by excitation and inhibition which is consistent with previous reports (Ylinen et al., 1995; Maier et al., 2003; Behrens et al., 2005; Wu et al., 2005; Sipilä et al., 2006; Vargas et al., 2012; Schlingloff et al., 2014; Buzsáki, 2015; Eller et al., 2015).
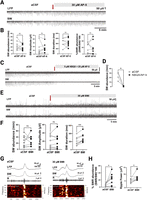
SW/SWR events are modulated by GABAA and AMPA but not by NMDA receptor signaling. A, Representative trace showing LFP and SW events before and during bath perfusion containing 30 μM AP-5. B, Quantification of SW abundance, amplitude, duration, and percentage of SW events with an embedded ripple at baseline (aCSF) or during drug exposure (n = 8). C, Representative trace of LFP and SW events during baseline and bath exposure to 5 μM NBQX + 25 μM AP-5 (n = 4). D, Quantification of SW abundance before and during drug exposure. E, Representative trace of LFP and SW events before and during bath perfusion containing 30 μM BMI. F, Quantification of SW abundance, amplitude, and duration before and during BMI exposure (n = 8). G, Representative trace of LFP, SW, and ripple (R) during baseline and BMI exposure. Frequency spectrogram is also shown (n = 8). H, Quantification of the percentage of SW events containing at least one embedded ripple and ripple power during baseline and drug exposure. Red arrows indicate when the drug was added to the bath perfusion. Paired Student's t tests were performed, *p < 0.05, **p < 0.005.
Ca2+ imaging reveals varied ensembles of neurons participating in SW events
We then wanted to better understand the single-cell firing patterns of neurons within the dorsal pallium, where the ADL is located, that were associated with SWR events. However, due to the low percentage of SWR events, we used SW events instead. We therefore analyzed calcium transient signals that were coincidental with SW events using the nuclear-localized pan-neuronal Tg(elevI3:H2B:GCaMP6s)jf5 (Freeman et al., 2014) transgenic zebrafish (Fig. 3A–D). Overall, 93.5 ± 2.1% of SW events had coincident calcium transients and 67.7 ± 4.9% of cells had calcium transients coincident with SWs (Fig. 3E). The occurrence of calcium transients exhibited a significant elevation during SW events, as evidenced by analysis across seven movies from two juvenile zebrafish (coincidental calcium events: 16.2 ± 3.8 events/min vs spontaneous calcium events: 1.57 ± 0.23 events/min; paired Student's t test t(6); p = 0.0071; Fig. 3F). The average ensemble size of cells participating in an SW was 7.83 ± 2.08 neurons or 9.73 ± 1.94% of active cells (data not shown). To assess the ensemble composition during SW events, we calculated the pairwise Jaccard similarity of cellular participation between all SW events revealing that on average, 17.29 ± 1.87% of participating cells were shared between any two SW events (Fig. 3G). Finally, we pooled whole-brain LFP recordings from Figure 1 (13 recordings) together with recordings from the dual LFP/calcium transient recordings (seven movies) and found that ∼9% of SW events contain at least one embedded ripple event (9.07 ± 2.69; data not shown). Together, these data corroborate the presence of varied neuronal ensembles in the brain of zebrafish and show their relationship with the generation of SW events.
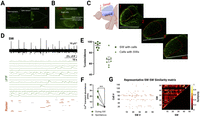
Single-cell activity in the ADL shows a small fraction of neurons participating in an SW event. A, Representative confocal image of the brain of a pan-neuronal calcium indicator Tg(elevI3:Hsa.H2B:GCaMP6s) juvenile zebrafish. Ro, rostral; C, caudal. B, Field of view under a confocal microscope showing dual recording of LFP in the right ADL and calcium transients. C, Sagittal view of the telencephalon of the zebrafish showing the dorsal pallium where the ADL is located and the ventral pallium. Single-cell calcium transients were recorded from three transverse slices of the dorsal telencephalon (1, 2, 3). ROIs were drawn within the red dashed lines from the right telencephalon. D, Representative SW trace aligned to single-cell calcium transients (ΔF/F). The raster shows events that were identified above threshold and were either coincident with SWs (orange) or spontaneous (light gray). E, Average percentage of SW events coincident with calcium transients (circles) and average percentage of cells with calcium transients coincident with SW events (triangles). F, Quantification of calcium transients that were coincident with SW events or that happened spontaneously. Individual data point represents a movie (n = 7, from 2 zebrafish, each movie represents a different field of view corresponding to the three transverse sections shown in C). G, Left, Representative event matrix showing SW events on the x-axis and number of cells on the y-axis. Right, Pairwise Jaccard similarity between SW events (rows in event matrix). Similarity matrix is symmetric with the diagonal = 1. Average similarity for each recording was computed as the grand mean of this matrix, representing the average similarity between any two SWs. Paired t test, **p < 0.005.
Cholinergic tone modulates SW events in the zebrafish brain
During our calcium transient recordings, we noticed transient periods of no LFP activity that corresponded to a massive neuronal activation that propagated in a caudal-to-rostral fashion (Fig. 4A,B). These silent periods were characterized by exceeding 20 s in duration and the returning of SW events that had similar morphology to presilent period events. Analysis of time-lapse images from dual LFP and calcium transient recordings using regional ROIs of brains undergoing silent periods showed that this activation began in the posteromedial pallial amygdala (PMPa) area (Fig. 4B), an area of putative acetylcholinesterase-positive neurons (Clemente et al., 2004), culminating in the silencing of activity in both the ADL and BLA. The PMPa is functionally connected to the BLA (Northcutt, 2008; Folgueira et al., 2012), possibly underlying the propagation of this activity through the midline. Using DiI tracing, we corroborated that the PMPa area is structurally connected to areas of the amygdala through the midline (Fig. 4C). We then recapitulated the suppression of SW events in the ADL by stimulating the PMPa (Fig. 5D), further corroborating its involvement in generating these silent period events. The suppression of SW events lasted longer than endogenously generated silent periods (Fig. 4D, blue vs pink) and its suppression after the first stimulation was significant (paired t tests; t(2) = 4.507; p = 0.0459). In mammals, LFP events are similarly modulated by the cholinergic system (Hasselmo, 1999; Fischer et al., 2014; Buzsáki, 2015) with high cholinergic tone inhibiting these events and low cholinergic tone having the opposite effect. Therefore, to investigate whether the cholinergic tone modulated the number of silent periods per brain, we made use of our de-tectomized preparations which lack cholinergic efferents that are present in whole-brain preparations (Clemente et al., 2004). We also exposed whole brains to 10 µM atropine, a muscarinic receptor antagonist, and 20 µM mecamylamine (MEC), a nicotinic receptor antagonist. De-tectomized preparations and whole brains treated with atropine showed approximately a 50% reduction of recordings containing at least one silent period (X2 = 13.50; df = 3; p = 0.0037; Fig. 4E). This was accompanied by an expected significant increase in the abundance of SW events (F(2,37) = 9.123; p = 0.0006) specifically after exposure to atropine (18.78 ± 2.82) compared with whole brains (8.79 ± 0.93; p = 0.0004; Fig. 4F). MEC, however, did not have any effect on the number of silent periods per brain or the abundance of these events (p = 0.4435). We propose a model by which fluctuations in telencephalic cholinergic tone coming from the PMPa area plays a role in modulating ADL SW events after a massive neuronal activation that propagates rostrally through the midline (Fig. 4G), a phenomenon similar to what was observed during sleep in this animal model (Leung et al., 2019).
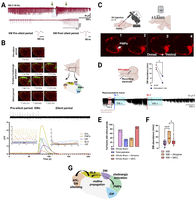
Cholinergic modulation of SW events. A, Representative trace showing a silent period event (light blue shaded area) lasting ∼80 s. Trace of the silent period is expanded below. The green arrows show the location from which an SW event before and after the silent period were taken and expanded. Morphology is unchanged. B, Top left, Representative time-lapse images of the left telencephalon undergoing a silent event. Top right, Representative diagram of the left zebrafish telencephalon demarcating the different brain areas (regional ROIs) participating and/or affected by the silent period: ADL (hippocampus homolog), BLA (basolateral amygdala), DM (dorsomedial lobe), PMPa (posterior pallial amygdaloid zone), and IOP (integrative olfactory pallium). Bottom, Representative alignment between LFP and ΔF/F of regional ROIs for one zebrafish. This pattern, however, was observed in at least three independent recordings (n = 3 fish). ADL and BLA show SW events and synchronized calcium transient signals during the presilent period that are abolished during the silent period event. C, Representative image of the dorsal telencephalon injected with DiI dye tracer in the PMPa region with confocal images taken at different depths (1 → 4 = dorsal → ventral). Representative images of DiI injected dorsal to ventral showing fibers going from the PMPa region to the dorsomedial pallium/BLA through the midline. The injection site is highlighted by the white arrow (n = 3). D, Representative diagram of the brain showing the placement of the stimulating electrode in the PMPa region and recording electrode in the ADL. Representative LFP trace showing an endogenously occurring silent period (red shaded area), followed by the return of LFP activity. First electric stimulation (St 1) leads to LFP activity suppression with returning events after 588 s. A second stimulation (St 2) leads to SW suppression for 846 s with returning events. Quantification of SW events accounting for the first 10 min after the first stimulation compared with baseline (n = 3 stimulated brains). E, Modulation of SW events by the cholinergic system. Percent represents the number of brains with at least one silent period over the total amount of brains recorded per treatment (nwhole brains = 18; natropine = 10; nMEC = 12). F, Quantified abundance after cholinergic modulation. G, Proposed working model of caudal-to-rostral inhibition of SW events based on cholinergic activation in the PMPa region (n = 3). Paired Student's t test, chi-square test, and one-way ANOVA with Tukey's multiple-comparisons test. *p < 0.05, **p < 0.005, ***p < 0.0005.
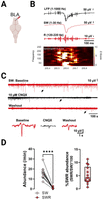
SWR complex in the BLA. A, Electrode placement in the BLA (frontomedial side). B, Representative SWR complex with frequency spectrogram shown. In this example the presence of extracellular spikes and embedded ripple can be seen. C, Example from a brain (n = 1) treated with 10 μM CNQX: top red trace is the baseline, black represents the addition of the drug, and the bottom red trace shows the washout step. Bottom panel, Representative events from baseline, CNQX exposure, and during washout. D, Left, Quantification of SW and SWR abundance. Right, Percentage of SW events with embedded ripples (n = 14). For all plots, individual data point represent an animal. Paired and unpaired Student's t tests. ****p < 0.0001.
The BLA exhibits SW events with embedded ripples: conserved bidirectional relationship between the ADL and BLA
The presence of calcium transients in the BLA prompted us to record spontaneous activity in this region. Filtered LFP recordings showed the presence of SWR events in the BLA susceptible to 10 µM CNQX (Fig. 5A–C). The presence of SWRs in the BLA agrees with mammalian literature showing SWR/high-frequency events in this region (Ponomarenko et al., 2003; Cox et al., 2020; Perumal et al., 2021), suggesting a conservation in the electrophysiological properties of the BLA across species. Quantification of SW abundance (16.24 ± 1.35) versus SWR events (0.86 ± 0.18) showed a significantly smaller subset of SWR events in this region (paired t test; t(13) = 12.33; p < 0.0001) with 5% (5.22 ± 0.86) of SW events containing at least one embedded ripple (Fig. 6D).
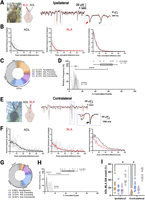
The ADL and BLA exhibit bidirectional communication. A, Left, Representation of ipsilateral electrode positioning in the BLA (red) and ADL (black). Right, Superimposed representative raw LFP trace showing a coincident event where the BLA precedes the ADL (red arrow) and one where the ADL precedes the BLA (green arrowhead) by ∼20 ms. B, Left and Middle, Relative frequencies (in percentage) of the peak coincident difference (ms) of spontaneous activity (SW) between ADL and BLA per brain analyzed (n = 10). Average is shown as thicker solid lines. Right, Plotted average. C, Quantification of the percent of events that were simultaneous (peak detection between −5 and 5 ms), ADL-preceding (peak detection between −100 and −5 ms), ADL-succeeding (peak detection 5–100 ms), and noncoincident (peak detection >100 ms; n = 10). Shaded areas represent the SEM for each group. One-way ANOVA with Tukey's multiple-comparisons tests was performed. D, Histogram of the percentage of coincident events (simultaneous, ADL-preceding, and ADL-succeeding) for both shuffled and unshuffled data. Peak events from the BLA were randomly shuffled (1,000 times) for each recording and the relative frequency plotted. The unshuffled percentage of coincident events per brain (true data points) is shown as dots with a relative frequency of 100%, similar fraction event coincidence values overlap—hard to see. E–H, The same as before but for the contralateral side. Green arrow shows a coincident event where ADL precedes the BLA by ∼90 ms, and the black arrow shows a simultaneous event. I, Quantification of events between ipsilateral and contralateral brain regions (dashed blue visually separates the regions on the graph). Two-way ANOVA with Tukey's multiple-comparisons tests. Only significance between same group from the ipsilateral and contralateral is shown. *p < 0.05, **p < 0.005, ***p < 0.0005, ****p < 0.0001. Paired Student's t test was performed on the percentage averages between the shuffled and unshuffled data.
In mammals, the hippocampus and BLA demonstrate bidirectional connectivity and information sharing (Felix-Ortiz and Tye, 2014; Skelin et al., 2019; Cox et al., 2020). Therefore, we explored the possibility of bidirectional communication between the ADL and BLA in juvenile zebrafish. Our focus was on SW events for several reasons: the relatively low occurrence of SWRs, the absence of a difference in abundance of SW events between regions, and previous studies highlighting the importance of SW events in establishing the temporal window for the transfer of learned information between brain regions (Battaglia et al., 2004; Born, 2010; Shein-Idelson et al., 2016). Thus, we performed dual recordings from the ADL and the contralateral (inter-) or ipsilateral (intrahemispheric) BLA of juvenile zebrafish and assessed if these events were time-locked to investigate the directionality of their communication (Fig. 6). We considered events within a peak coincidence of 5 ms to be simultaneous and those with a peak coincidence of >100 ms to be noncoincident. Coincident events were then sorted into those where the ADL preceded the BLA and vice versa (peak coincidence, >5 and <100 ms). We found evidence for both intra- (Fig. 6A–D) and inter- (Fig. 6E–H) hemispheric bidirectional coupling between the ADL and BLA. Intrahemispherical recordings (Fig. 6A–D) showed a significance difference (F(3,36) = 0.1655; p < 0.0001) between noncoincident events (42%) compared with coincident ADL-preceding (19%; p = 0.0002), coincident ADL-succeeding (15%; p < 0.0001), and simultaneous events (24%; p = 0.005; Fig. 6C). Shuffle analysis confirmed that the percentage of all coincident events (ADL-preceding, ADL-succeeding, and simultaneous) were greater than chance, here defined as the grand mean of the shuffled data percent coincidence (t(9) = 14.10; p < 0.0001; Fig. 6D). Events recorded from the contralateral sides revealed a significant interhemispheric difference (F(3,32) = 4.533; p < 0.0001) between noncoincident events (55%) compared with coincident ADL-preceding (24%; p < 0.0001), coincident ADL-succeeding (15%; p < 0.0.001), and simultaneous events (7%; p < 0.0001). Additionally, there were a significantly higher number of ADL-preceding events compared with simultaneous events (p = 0.0017; Fig. 6G). Shuffle analysis again confirmed that the percentage of all coincident events was greater than chance (t(8) = 11.64; p < 0.0001; Fig. 6H). A comparison between events from both hemispheres (F(3,68) = 46.79; p < 0.0001) found that the contralateral side has significantly less simultaneous (7%) events compared with the ipsilateral side (24%; p = 0.0104; Fig. 6I). Together, these data support a bidirectional communication between the ADL and BLA within the telencephalon of juvenile zebrafish.
Discussion
Here we show for the first time that ADL-specific SWR events are intrinsic to the zebrafish telencephalon and that SW events from this region further show bidirectional coupling with SW events from the BLA. Furthermore, fluctuations in cholinergic tone modulate SW events to generate silent periods. These data highlight zebrafish as a model system to study SW/SWR events in learning and memory consolidation/recall.
In this study we build upon previous data showing the presence of SWR events in the ADL of juvenile zebrafish (Blanco and Conant, 2020) and show that SWRs represent ∼9% of the total SW population and are intrinsically generated and maintained within the telencephalon. Though Vargas et al. (2012) first demonstrated the presence of SWR events in the ADL of whole-brain preparations from adult zebrafish, the authors did not observe SWR events in any other dorsal brain region nor did they study the intrinsic generation or modulation of SW events by extra-telencephalic efferents. The percent of SWs with an embedded ripple differs from that observed in rodent models where, on average, most SWs contain an embedded ripple (Buzsáki, 2015). The spectrum of SWs and ripple events follows that of a lognormal distribution (Buzsáki and Mizuseki, 2014; Buzsáki, 2015) and subthreshold events in our recordings could be missed due to variables including electrode placement. In rodent studies, there is evidence suggesting that small-amplitude SWR events are generated locally, as opposed to larger-amplitude events which are observed across greater distances (Buzsáki, 2015; Nitzan et al., 2022). We thus acknowledge that SWs and the percentage of SWs with ripple events might exceed what we can detect. This is supported by the range of both SW abundance and SWR percentages in our study with some brains exhibiting up to 50 SW events per min and up to 40% SWR events. Species-related differences in the percent of SWRs, however, would not be surprising and could reflect differences in memory capacity and/or neuronal number and anatomy.
Moreover, our BMI results are complicated in that BMI did not fully inhibit the SWRs as seen in rodents. In rodent hippocampal slices, blocking inhibition generates spontaneous “interictal-like” spikes that share features of SWRs but may differ in terms of generation (Karlócai et al., 2014). The generation could involve synchronous bursting of disinhibited pyramidal cells (Gulyás and Freund, 2015). Overall excitation and inhibition in the fish may be weaker than those in the mammalian brain, which could also influence SWR generation. Additional studies will be necessary to better understand comparative differences in local circuits.
Similar to murine studies (Ylinen et al., 1995; Hajos et al., 2013), we note that not all neurons in SWR-generating regions (ADL and BLA) participate in an SW event. Using a pan-neuronal calcium indicator, we show that SW event generation is achieved by the participation of, on average, ∼10% of neurons. This is consistent with the mammalian literature showing a dynamic range of neuronal firing where some neurons stay inactive or have slow firing to a small portion exhibiting high activity during an event (Buzsáki, 2015). Indeed, in mammals, the participation of single neurons in an SWR event is between 0 and ∼50% (Ylinen et al., 1995; Ellender et al., 2010; Hajos et al., 2013; Evangelista et al., 2020). Additionally, we found that the ensemble size associated with an SW event is approximately seven neurons within our imaging plane, with an average of 17% of neurons being shared between any two SW events. This may suggest that zebrafish SW events are generated by coordinated ensemble patterns carrying information to be transferred to other brain areas such as the BLA.
Indeed, in mammals, during slow wave sleep and periods of quiescent wakefulness, diverse cortical/subcortical regions exhibit an increase in the synchrony of neuronal oscillations, including SWRs, sleep spindles, and slow wave oscillations, allowing for the transfer, replay, and consolidation of different memory types (Fell et al., 2001; Fries, 2005; Ji and Wilson, 2007; Buzsáki, 2010; Logothetis et al., 2012; Eller et al., 2015; Wilber et al., 2017; Buzsáki and Tingley, 2018; Skelin et al., 2019, 2021; Cox et al., 2020; Swanson et al., 2020; Tukker et al., 2020; Nitzan et al., 2022). In humans, SWR events in the BLA are bidirectionally coupled to hippocampal SWRs and thought to be important for the consolidation of hippocampal-dependent memories with emotional valence (Cox et al., 2020; Skelin et al., 2021). In line with the mammalian literature, a novel finding of our study is the temporal coupling between ADL and BLA SW events. Interhemispheric recordings exhibited a significant shift toward ADL preceding events compared with simultaneous events. Moreover, the percentage of simultaneous SW events between these two regions was significantly higher when originating from the same hemisphere. This may suggest a stronger intrahemispheric interaction between regions compared with those farther away. This echo human studies show inter- and intrahemispheric time-locked events between the hippocampus and other cortical/subcortical areas with a higher intrahemispheric interaction (Skelin et al., 2021).
In mammals the occurrence of SWR events is modulated by cholinergic tone with high cholinergic tone inhibiting SWR events and transition to theta–gamma burst (TGB) activity, crucial for explorative behavior (Konopacki et al., 1987; Buzsaki et al., 1992; O’Keefe, 1993; Wilson and McNaughton, 1994; Fisahn et al., 1998; Hasselmo, 1999; S. Zhang et al., 2000; Osipova et al., 2006; Sederberg et al., 2006; Nyhus and Curran, 2010; Sullivan et al., 2011; Csicsvari and Dupret, 2014; Li et al., 2019; Herweg et al., 2020; Ma et al., 2020; Y. Zhang et al., 2021; Fuchsberger and Paulsen, 2022). In murine hippocampal slices, in the absence of external sensory inputs, the spontaneous occurrence of SWRs is observed (Buzsáki, 1986; Buzsaki et al., 1992; Bragin et al., 1995; Ylinen et al., 1995), and the transition to TGB activity can be achieved through exposure to exogenous cholinergic agents (Fisahn et al., 1998; Hasselmo, 1999; Fischer et al., 2014; Ballinger et al., 2016). Though we do not yet fully understand the circuitry modulating SWs and TGB activity in zebrafish, cholinergic nuclei are present in the diencephalon, mesencephalon, and rhombencephalon (Clemente et al., 2004; Toledo-Ibarra et al., 2013). Acetylcholinesterase-positive neurons have been found in the telencephalon and the olfactory bulb, and choline acetyltransferase immunoreactivity fibers have been found in the caudal telencephalon (Clemente et al., 2004). Therefore, we hypothesized that cholinergic tone might also modulate SWs in zebrafish. A difference between recordings from ex vivo hippocampal murine slices versus whole brains from zebrafish is that the former lack septo-hippocampal connections, impairing endogenous modulation of SWR events in murine slices.
Both de-tectomized and whole-brain preparations exhibited periods of endogenous-induced silencing of spontaneous activity. Concurrently, there was an approximate 50% reduction of recordings with at least one silent period in both de-tectomized and atropine-exposed preparations, with atropine-treated brains also having increased SW event abundance. MEC, however, did not change the number of recordings containing silent periods nor did it affect the number of SW events as compared with that in whole brains in aCSF. The lack of an effect by MEC exposure can be explained by differences in the contribution of nicotinic receptors to the generation and maintenance of SW events in zebrafish and different routes of exposure (bath exposure vs local exposure) as well as kinetics of receptor desensitization. Drugs such as nicotine which target nicotinic receptors have varied effects on the aforementioned parameters (Fischer et al., 2014).
Single-cell calcium imaging revealed that these silent events were preceded by neuronal activation in the PMPa, housing putative cholinergic neurons (Clemente et al., 2004), and propagates through the entire telencephalon in a caudal-to-rostral manner. Electrical stimulation of the PMPa corroborated its involvement in the silencing of SW events. The zebrafish PMPa region is homologous to the PMCo (posteromedial cortical nucleus of the amygdala) region in mammals (Porter and Mueller, 2020), which projects to the cholinergic ventrolateral septum (Canteras et al., 1992). Though the activation of the PMPa may be sufficient for the suppression of these events, it could also be the case that this region further increases cholinergic tone by targeting other areas within the telencephalon, to abolish SW events. It was previously shown that in sleep-deprived zebrafish the transition from slow bursting sleep to propagating wave sleep, which respectively share characteristics of slow wave sleep and rapid eye movement sleep in mammals, is stimulated by cholinergic agents and characterized by propagating caudal-to-rostral waves of activation and silencing (Leung et al., 2019). This aligns with the generation of silent periods observed in ex vivo zebrafish preparations supporting the modulation of spontaneous events by the cholinergic system. We therefore postulate that in our in vitro preparations, acetylcholine tone is decreased during SW events and increased during these silent periods.
In conclusion, our data demonstrate SW coupling between the zebrafish hippocampal and amygdala homologs, which may be important for fear memory consolidation in this prey species, and suggest that additional features of zebrafish SWs, described herein, make it a valuable model system for future studies of neurological and psychiatric disorders.
Footnotes
- Received August 2, 2023.
- Revision received March 1, 2024.
- Accepted March 6, 2024.
-
This work was supported by National Institute of Neurological Disorders and Stroke 5T32NS041218 (I.B.), F99NS130872 (I.B.), and R21MH118749 (K.C.). We apologize to the investigators whose research work may not have been cited.
-
The authors declare no competing financial interests.
-
A.C.’s present address: Section on Cellular and Synaptic Physiology, Eunice Kennedy Shriver NICHD, NIH, Bethesda, Maryland 20892.
- Correspondence should be addressed to Katherine Conant at kec84{at}georgetown.edu or Ismary Blanco at ib379{at}georgetown.edu.
- Copyright © 2024 the authors




