MTCL2 Is Essential for the Bipolar-to-Multipolar Transition in the Dendrite Extension of Cerebellar Granule Neurons
- 1Molecular Cellular Biology Laboratory, Yokohama City University Graduate School of Medical Life Science, Yokohama 230-0045, Japan
- 2Department of Biochemistry and Cellular Biology, National Institute of Neuroscience, National Center of Neurology and Psychiatry, Tokyo 187-8551, Japan
-
Author contributions: A.S. designed research; M.M., T.A., and A.S. performed research; M.M. and A.S. analyzed data; T.A., M.H., and A.S. edited the paper; M.M. and A.S. wrote the paper.
Abstract
The dynamic regulation of neuronal polarity is essential for the formation of neural networks during brain development. Primary cultures of rodent neurons recapitulate several aspects of this polarity regulation, providing valuable insights into the molecular mechanisms underlying axon specification, dendrite formation, and neuronal migration. However, the process by which the preexisting bipolarity of migrating neurons is disrupted to form multipolar dendrites remains to be elucidated. In this study, we demonstrate that MTCL2, a microtubule-crosslinking protein associated with the Golgi apparatus, plays a crucial role in this type of polarity transformation exhibited by cerebellar granule neurons (CGNs) in mice of either sex. MTCL2 is highly expressed in CGNs and gradually accumulates in dendrites as the cells develop polarity. MTCL2 knockdown inhibited the bipolar-to-multipolar transition of dendrite extension observed in their differentiation in vitro as well as in vivo. During this transformation, the Golgi apparatus shifts from the base of the preexisting bipolar neurites to the lateral or apical side of the nucleus in the cell body. There, it forms a close association with the microtubule cage that wraps around the nucleus. The resulting upward extension of the Golgi apparatus is tightly coupled with the randomization of its position in the x–y plane. Knockdown and rescue experiments demonstrated MTCL2 promotes these changes in the Golgi position in a microtubule- and Golgi-binding activity-dependent manner. These results suggest that MTCL2 promotes the development of multipolar short dendrites by sequestering the Golgi apparatus from the base of the preexisting neurite into the microtubule cage.
Significance Statement
The Golgi apparatus acts as the central hub for intracellular vesicle transport. It is known that neurons polarize the localization of the Golgi apparatus, thereby regulating the direction of dendrite elongation. In contrast, the present study suggests the existence of a reverse process: cerebellar granule neurons may promote symmetrical dendritic outgrowth by sequestering the Golgi apparatus within a microtubule cage surrounding the nucleus, thereby suppressing polarized vesicle transport. These findings reveal a novel function of microtubule cages, which have primarily been studied in the context of neuronal migration. This process also involves microtubule-crosslinking factor 2 (MTCL2), which connects the Golgi apparatus to microtubules, and the linker of the nucleoskeleton and cytoskeleton (LINC) complex, which connects microtubules to the nuclear membrane.
Introduction
Neurons are highly polarized cells that develop two functionally distinct processes: a long, thin axon and short dendrites. To establish elaborate neuronal circuits in the brain, developing neurons gradually establish this polarity as they migrate to appropriate regions.
Neuronal polarization is intrinsically programmed and can be recapitulated in vitro to some extent, even without specific cell-to-cell contacts or extracellular matrix molecules (Tahirovic and Bradke, 2009). Rodent hippocampal neurons are the most extensively studied model system for investigating neuronal polarity (Dotti et al., 1988; Fletcher and Banker, 1989). Cells isolated from late embryos first develop a multipolar morphology with several short neurites that exhibit rapid elongation and retraction. However, one of these initial neurites begins to grow rapidly and becomes a thin, long axon 1–2 d after plating. The remaining short neurites then develop into dendrites. Most studies have focused on the initial event through which neurons break the initial multipolarity, as similar axon specification processes have been observed in the developing neocortex in vivo (Miyata et al., 2004; Noctor et al., 2004; Takano et al., 2015).
Dissociated cultures of cerebellar granule neurons (CGNs) provide an alternative model for studying neuronal development (Powell et al., 1997; Zmuda and Rivas, 1998; Solecki et al., 2006; Tahirovic and Bradke, 2009). These cultures recapitulate the characteristic developmental process of CGNs in vivo, which differs from that of hippocampal neurons. Initially, CGNs isolated from early postnatal rodents develop bipolar axons without elongating multiple neurites. Subsequently, the cells convert the bipolar axon into a single T-shaped axon by either migrating perpendicular to the initial bipolar axis or retracting one of the two axons. Thereafter, they complete their final morphology by extending short dendrites in multiple directions (Powell et al., 1997; Zmuda and Rivas, 1998; Solecki et al., 2006; Tahirovic and Bradke, 2009). This culture system was first used to demonstrate the close correlation between the position of the centrosome and the Golgi apparatus with the site of bipolar axon elongation (Zmuda and Rivas, 1998). Then, it has been used to investigate the molecular mechanisms underlying axonogenesis (Arakawa et al., 2003; Oishi et al., 2021) and dendritogenesis (Huang et al., 2007; Litterman et al., 2011; Tan et al., 2013). However, no studies have yet focused on the mechanism that induces the transition from bipolarity to multipolarity in CGNs, a phenomenon that has not been observed in hippocampal neurons.
MTCL2, formerly known as SOGA1, is a recently identified microtubule-associated protein (Matsuoka et al., 2022). It dimerizes through its central coiled-coil region and interacts with microtubules (MTs) via its C-terminal region. The N-terminal portion of the coiled-coil region also exhibits additional activity to associate with the Golgi membrane. These abilities enable MTCL2 to accumulate MTs around the Golgi apparatus, thereby promoting the lateral assembly of Golgi stacks and forming a compact Golgi ribbon. Matsuoka et al. (2022) further suggested that these MTCL2 functions are essential for maintaining directional cell migration.
In this study, we demonstrated that MTCL2 is highly expressed in CGNs in vivo. In cultured CGNs, MTCL2 depletion resulted in abnormally polarized cells with longer and fewer dendrites. Several experiments revealed that MTCL2 is necessary for the transition of dendrite extensions from bipolar to multipolar, which is observed during normal CGN development. In vivo analysis supported these findings, demonstrating that MTCL2 knockdown suppresses the disruption of the bipolarity of CGNs established when they migrate from the external granular layer (EGL) to the internal granular layer (IGL) prior to developing their multipolar dendrites. Immunofluorescence analysis and knockdown/rescue experiments have revealed that MTCL2 sequesters the Golgi apparatus from the base of the bipolar neurites to the MT cage that wraps around the nucleus. Experiments inhibiting the LINC complex, which links the nuclear membrane to MTs, further supported the importance of the MT cage in this polarity conversion. Taken together, these results demonstrate MTCL2’s novel role in promoting the bipolar-to-multipolar transition of dendrite extensions by linking the Golgi apparatus and MTs.
Materials and Methods
Animals
All protocols were approved by and performed in accordance with the guidelines established by the Institutional Animal Care and Use Committee of Yokohama City University, Medical Life Science or the Animal Care and Use Committee of the National Institute of Neuroscience, Japan. Mice were housed in SPF conditions and maintained on a 12 h light/dark cycle with ad libitum access to food and water. In all analyses, we used pups without identifying the sex of each animal.
Antibodies
The primary antibodies used in this study were as follows: rabbit anti-SOGA1 to detect MTCL2 (polyclonal, 1:2,000, HPA043992), mouse anti-tau1 (monoclonal, clone PC1C6, 1:1,000, MAB3420), Goat anti-calbindin (polyclonal, 1:500, C9848), mouse anti-Ankyrin G (monoclonal, clone N106/36, 1:1,000, MABN466) from Merck Sigma-Aldrich; mouse anti-MAP2 (monoclonal, clone AP-20, 1:1,000, sc-32791), mouse anti-α-tubulin (monoclonal, clone DM1A, 1:1,000, sc-32293), mouse anti-acetylated tubulin (monoclonal, clone 6-11B-1, 1:2,000, sc-23950), rat anti-tyrosinated tubulin (monoclonal, clone YL1/2, 1:2,000, sc-53029), mouse anti-GFP (monoclonal, clone B-2, 1:1,000, sc-9996) from Santa Cruz Biotechnology; mouse anti-GM130 (monoclonal, clone 35/GM130, 1:1,000, 610822) and mouse anti-GS28 (monoclonal, clone 1/GS28, 1:300, 611184) from BD Transduction Laboratories; mouse anti-GAPDH (monoclonal, clone 6C5, 1:2,000 5G4) from HyTest; and mouse anti-NeuN (monoclonal, clone A60, 1:500, MAB377) from Merck Millipore; rabbit anti-GABA-A receptor a6 antibody (polyclonal, 1:500, 224603) from Synaptic Systems; rabbit anti-contactin-1 antibody (polyclonal, 1:100, AF904) from Bio-Techne (R&D Systems).
Plasmids
For knockdown experiments, pEB-super-GFP vectors simultaneously expressing EGFP and appropriate shRNA were first constructed (Masuda-Hirata et al., 2009). Then, the EBNA1 cDNA sequence and the associated CMV promoter were removed to reduce vector size. For mouse MTCL2 knockdown, the RNAi target sequence 5′-gacggtcagtgtaggtcttca-3′ was inserted under the H1 promoter as a hairpin oligonucleotide sequence in a tail-to-tail fashion (Satake et al., 2017). The control shRNA sequence used was 5′-cagtcgcgtttgcgactgg-3′. To generate RNAi-resistant mouse MTCL2 expression vectors, silent mutations (a act gta tca gtc ggc ttg cag a) in the RNAi target sequence were introduced in the cDNAs of V5-tagged wild-type or mutant mouse MTCL2 (4LA or ΔKR) subcloned in the pCAGGS expression vector (Matsuoka et al., 2022). In rescue experiments, the shRNA expression vector for mouse MTCL2 and appropriate expression vectors for RNA-resistant mouse MTCL2 wild type or mutant MTCL2 were cotransfected into CGNs. To construct a GFP-KASH1 expression vector, a human Nesprin-1 cDNA fragment encoding the C-terminal region (8,726–8,799 aa) was amplified by RT-PCR from total RNA from HeLa-K cells and cloned into pEGFP-C1 at BglII/BamHI sites (Stewart-Hutchinson et al., 2008). The resulting GFP-KASH1 cDNA fragment was subcloned into the pCAGGS vector to change the promoter.
Primary neuron culture and transfection
Primary CGNs were isolated from postnatal day (P) 6 neonatal mice and prepared as previously described (Krämer and Minichiello, 2010). Neurons were plated on coverslips coated with poly-d-lysin (0.1 mg/ml; Merck Sigma-Aldrich or Thermo Fisher Scientific) at a density of 180,000 cells/well, 300,000 cells/well, or 360,000 cells/well (24 well plates) and cultured for 8 h in Dulbecco's modified Eagle medium (DMEM; Life Technologies Corporation) containing 10% fetal bovine serum, penicillin (100 U/ml), streptomycin (0.1 mg/ml), 3.5 mM glutamine, and 0.9 mM sodium pyruvate (nacalai) under controlled temperature and CO2 conditions (37°C, 5%). Then, cells were subjected to plasmid transfection using a CalPhos Mammalian Transfection Kit (Takara) according to the manufacturer's instruction for 8–16 h, followed by incubation with the original medium supplemented with 0.01 mM Ara-C (Tokyo Chemical Industry) and 20 mM KCl until fixation. For live cell imaging, primary CGNs were seeded onto 35 mm glass-bottom dishes divided into four-compartment (Greiner Bio-One) after coating with poly-d-lysin and subjected to appropriate transfection.
In vivo electroporation
In vivo electroporation to neonatal mice was described previously (Owa et al., 2018). Briefly, P6 mice were anesthetized on ice and injected with three microliters of plasmid DNA (3 µg/µl) in water on the pial surface. While holding the brain with a forceps-type electrode (Nepa Gene), 50 ms of 80 V electric pulses were delivered seven times at 150 ms intervals using an electroporator (CUY21; Nepa Gene). The pups were revived at 37°C and returned to the litter and subjected to immunohistochemical analysis at P12 as described below.
Immunocytochemistry
The primary cultured CGNs were fixed in 4% paraformaldehyde (PFA) at room temperature for 15 min at 37°C. After fixation and blocking with 10% fetal bovine serum in PBS (8.1 mM Na2HPO4.12H2O, 1.47 mM KH2PO4, 137 mM NaCl, 2.7 mM KCl), samples were incubated with appropriate primary antibodies diluted in TBST (10 mM Tris–HCl, pH 7.5, 150 mM NaCl, 0.01% [v/v] Tween 20) containing 0.1% (w/v) BSA overnight at 4°C. After washing with PBST (PBS containing 0.05% Tween 20), samples were incubated with the appropriate secondary antibodies conjugated with Alexa Fluor 488, 555, or 647 (Life Technologies Corporation) for 60 min at room temperature. All secondary antibodies were used at a 1:2,000 dilution. The nuclei were counterstained with 4′,6-diamidino-2-phenylindole (MBL, Japan) at a 1:2,000 dilution in PBST during the final wash. For image acquisition, samples on coverslips were mounted onto glass slides in ProLong Diamond Antifade Mountant (Thermo Fisher Scientific).
Immunohistochemistry
For Figure 1A, mice were fixed via transcardial perfusion with 4% paraformaldehyde (PFA) in PBS while under deep isoflurane anesthesia. The brains were removed from the skull and postfixed for 3–5 h at 4°C. Then, they were sectioned at a thickness of 50 µm using a vibratome (VT1200S; Leica Microsystems). After permeabilization with PBST’ (PBS containing 0.2% Triton X-100) at room temperature with gentle shaking for 30 min, the cerebellar vermis slices were blocked for an additional 30 min with 10% fetal bovine serum in PBST’. Immunofluorescence staining was performed using the same method described above for immunocytochemical staining. For in vivo electroporated mice (Fig. 4), the brains were postfixed with 4% PFA at 4°C overnight and subsequently cryoprotected sequentially in 1× PBS, 10% sucrose, and 30% sucrose, each at 4°C with gentle shaking at 4°C overnight. The issues were then embedded in O.C.T. compound (Sakura Finetek), rapidly frozen, and sectioned sagittally at a thickness of 16 or 40 μm using a cryostat (CM3050S; Leica). The cryosections were washed twice with PBS for 10 min and then incubated with 10% normal donkey serum (S30-100ML; Millipore) in PBST’ at room temperature for 40 min for blocking. Immunofluorescence staining was performed using the similar method described above, except that all antibodies used were diluted using PBST’ containing 10% fetal bovine serum, and secondary antibodies were used at a 1:400 dilution. When contactin-1 staining was performed, 0.22% gelatin was used for blocking and antibody instead of 10% fetal bovine serum.
Image acquisition and processing
Most images were acquired using a Leica SP8 laser scanning confocal microscope equipped with an HC PL APO 63×/1.40 Oil 2 objective using the Hybrid Detector in photon-counting mode. To obtain super-resolution images, HyVolution2 imaging was performed on the same system using Huygens Essential software (Scientific Volume Imaging). Single confocal images are shown unless otherwise indicated. The same confocal system was used for taking time-lapse images, except that an HC PL APO 20×/0.75 objective was used. In this case, CGNs seeded onto 35 mm glass-bottom dishes were placed in a closed heat-controlled chamber (Leica) with a CO2 supply system (Tokken) on the microscope stage for 2 d under autofocus control. For quantification analysis in Figures 2⇓–4, wide-view or low-resolution images were obtained using an AxioImager ZI microscope (Carl Zeiss) equipped with a Plan-Apochromat 40×/0.95 objective and an Orca II CCD camera (Hamamatsu Photonics). To obtain images of brain slices and to measure the heights of cells and the apical end of the Golgi apparatus, an AxioImager Z1 microscope equipped with a CSU10 disc confocal system (Yokogawa Electric) and a 20×/1.4 NA or 100×/1.46 NA Plan-Apochromat objective was used. Images were acquired using MetaMorph software (Molecular Devices) and processed using ImageJ software to obtain appropriate brightness and contrast.
Quantification
To quantify the enrichment of MTCL2 and MAP2 in CGN neurites, immunofluorescence signal intensities of anit-MTCL2 and anti-MAP2 staining were measured in ROIs of 1 µm2 circles placed on anti-acetylated tubulin- or tau1-positive neurites. To analyze the morphology of CGNs, the positions of bases, tips, or branching points of neurites (axons or dendrites) were marked manually, and their lengths and numbers of tips were automatically quantified using the NeuronJ plugin for ImageJ. Essential functions of ImageJ were used to manually analyze the polarity of the dendrite extension direction, Golgi position in the x–y plane, and number of bases of dendrites. The dendritic lengths of CGNs subjected to live imaging were also analyzed manually. The cell height and position of the Golgi apical end were determined from the focal plane at which the fluorescent signals of tyrosinated tubulin and GS28 disappeared in z-stack images taken at an interval of 0.3 µm. The 3D video shown in Movie 5 was created using software (LAS X) associated with the Leica SP8 laser scanning confocal system. To analyze MT cage density, confocal Z-stack images covering the entire plane of individual CGNs stained with tyrosinated tubulin were projected onto a single image using maximum projection. The tyrosinated tubulin signal intensity was measured along eight lines connecting the cell body center to the periphery, dividing each cell body into eight equal parts. After standardizing the position along each line relative to the distance from the cell center to the periphery (set as 1), the tyrosinated tubulin signal profiles along the eight lines were averaged per cell. Finally, the profiles were normalized by setting the maximum tyrosinated tubulin signal value within each cell to 1. The profiles of cells subjected to each condition were then averaged. To qualitatively classify live imaging data taken to analyze the differentiation process of CGNs from 3 days in vitro (DIV3) to DIV4, dozens of video files of control and MTCL2 knockdown cells from two independent experiments were randomly mixed and numbered so that their origin could not be determined. Subsequently, another person who was not involved in randomizing the files classified the developmental process of the dendrites shown in each video into four categories, as shown in Figure S3D. To analyze CGNs in vivo, 2D stacks of confocal images taken by 0.36 µm intervals using an HC PL APO 20×/0.75 objective were transformed into 3D images using the 3D viewer plugin in ImageJ. These 3D images were then used to identify the axon of each CGN, analyze the direction of dendrite extension relative to the axon, and measure the glomeruli size of each dendrite.
Cell extraction and Western blotting
CGN extracts were prepared by adding RIPA buffer (25 mM Tris/HCl, pH 7.5, 150 mM NaCl, 1% NP40, 1% deoxycholic acid, 0.1% SDS) containing a protease inhibitor cocktail (Merck Sigma-Aldrich, P8340), followed by brief sonication and centrifugation (15,000 × g, 15 min). Samples were separated using SDS-PAGE and transferred to polyvinylidene fluoride membranes. Blots were incubated in blocking buffer containing 5% (w/v) dried skim milk in PBST, followed by overnight incubation with anti-SOGA1 or anti-GAPDH antibodies diluted in blocking buffer. The diluted anti-SOGA1 (for MTCL2), MAP2, and anti-GAPDH antibodies were 1:1,000, 1:500, and 1:5,000, respectively. Blots were then exposed to horseradish peroxidase (HRP)-conjugated secondary antibodies (GE HealthCare) diluted in blocking buffer for 60 min at room temperature and washed again. Blots were visualized using an Immobilon Western Chemiluminescent HRP Substrate (Millipore) or ECL Western blotting detection system (GE HealthCare). Chemiluminescence was quantified using an ImageQuant LAS4000 Luminescent Image Analyzer (GE HealthCare).
Results
MTCL2 shows preferential enrichment in the dendrites of cerebellar granule neurons
A previous study by Matsuoka et al. (2022) showed preferential expression of MTCL2 in the lung, testis, ovary, cerebrum, and cerebellum using Western blotting of mouse tissue extracts. High expression of MTCL2 in the cerebellum is also evident in public mRNA expression databases for human and mouse organs (https://www.ebi.ac.uk/gxa/home and https://www.proteinatlas.org), as well as in situ hybridization data for the mouse brain (https://mouse.brain-map.org/; Fig. S1A). We therefore performed an immunostaining analysis of MTCL2 in the mouse cerebellum and found that MTCL2 is preferentially expressed in granule cells and, to a lesser extent, in Bergmann glial cells, but not in Purkinje cells (Fig. 1A; A. Suzuki, unpublished observation). The absence of MTCL2 in Purkinje cells is consistent with the public in situ hybridization data for the mouse brain (Fig. S1A), whereas it is in sharp contrast to its paralogue, MTCL1, which is expressed in Purkinje cells and plays critical functions (Satake et al., 2017). Based on these results, in subsequent studies, we analyzed MTCL2 functions in cerebellar granule neurons (CGNs) using dissociated cultures of mouse CGNs (Powell et al., 1997; Krämer and Minichiello, 2010).

MTCL2 is preferentially enriched in the dendrites of cerebellar granule neurons. A, Cerebellar sections from 4-week-old mice are stained for calbindin and NeuN (left panel) or MTCL2 and α-tubulin (middle and right panels). Scale bars, 250 µm. B, Representative images of isolated CGNs cultured for 5 d and stained for acetylated tubulin, MTCL2, and MAP2. Scale bar, 20 µm. C, Correlation between the immunofluorescence intensities of MTCL2 and MAP2 in acetylated tubulin-positive neurites. A total of 100 neurites from three independent experiments were analyzed. D, Representative images of CGNs at DIV1–DIV5 stained for tau1, MTCL2, and MAP2. In the merged view, nucleus staining is included to clarify the positions of cell bodies. The arrowheads indicate tau1-positive neurites exhibiting MTCL2 signals in immature CGNs. Scale bar: 20 µm. E, Time-dependent increase in the relative intensities of the MTCL2 (solid line) and MAP2 (dotted line) signals in dendrites. Neurites exhibiting MAP2 signal intensities three times greater than the background intensity were analyzed as dendrites. Data represent the means ± SD of the average values for each of the three independent experiments (more than 67 neurites were analyzed for each DIV stage). Welch’s two-sample t test was used to examine statistical significance. F, Western blot analysis of MTCL2 and MAP2 expression in primary cultured CGNs from various DIVs. A representative result of two independent experiments is presented.
Immunofluorescence analysis of CGNs isolated and cultured for DIV5 revealed strong anti-MTCL2 signals in the cell bodies and in some restricted neurites (Fig. 1B). The disappearance of these signals following MTCL2 knockdown (Fig. S1B) indicates that they represent the true localization of endogenous MTCL2. Neurites with a strong MTCL2 signal showed a high degree of correlation with the MAP2-positive dendrites (Fig. 1B). In fact, the intensities of MTCL2 and MAP2 staining on the neurites were highly correlated (Fig. 1C; Pearson's r = 0.83). However, weak MTCL2 signals were also detected in MAP2-negative thin axons (Fig. 1B,C). These results suggest that, while MTCL2 is not restricted to MAP2-positive dendrites, it is preferentially enriched in these dendrites.
Next, we examined the timing of MTCL2 enrichment in dendrites during CGN polarization. To this end, we compared the intensities and patterns of the immunostaining for dephosphorylated tau (tau1), MAP2, and MTCL2 in CGNs cultured for 1–5 d (Mandell and Banker, 1996). Consistent with previous reports, CGNs extended tau1-positive short processes 1 d after seeding (Fig. 1D, arrowheads; Zmuda and Rivas, 1998). Most of these processes acutely elongated after DIV2 and gradually became axon-like neurites with longer and thinner morphologies. Conversely, MAP2 signals were very weak until DIV3, when they began to be detected in the short neurites. MTCL2 signals were strongly detected even at DIV1, at levels comparable to those observed at DIV5 (∼80%; Fig. 1E). This level of expression was maintained thereafter, with slight decreases at DIV2 and 3 (Fig. 1D,E). High expression of MTCL2 in DIV1 CGNs was also confirmed by Western blotting (Fig. 1F). MTCL2 signals in CGNs at DIV1 and 2 were detected in cell bodies and in some tau1-positive initial neurites (Fig. 1D, arrowheads). Approximately DIV3–4, however, when MAP2-positive neurites appeared, MTCL2 gradually exhibited selective enrichment in these neurites (Fig. 1D). These results suggest that MTCL2 enrichment in dendrites occurs during the late stage of CGN polarization, which occurs alongside MAP2 expression.
Depletion of MTCL2 resulted in the development of fewer and longer dendrites
These results suggest a possibility that MTCL2 plays an important role in the dendritic development of CGNs. To investigate this possibility, we examined the effects of MTCL2 knockdown in primary cultured CGNs. Eight hours after seeding, we transfected a plasmid expressing shRNA and EGFP into the cells (Fig. S1B). As shown in Figure 2A, CGNs lacking MTCL2 appeared to differentiate normally into neurons with long, thin axons at DIV6. Quantification of axon length and branching revealed no significant differences between MTCL2-depleted cells and control cells (Fig. 2B, Fig. S2A). Furthermore, MTCL2 knockdown did not prevent the appearance of MAP2-positive dendrites in DIV6 CGNs (Fig. 2C). However, detailed analyses revealed that MTCL2 knockdown resulted in fewer dendrites than control cells in terms of both the number of dendrite tips (Fig. 2D) and bases (Fig. S2B). Additionally, the average dendrite length of MTCL2-depleted CGNs (25.0 ± 11.5 µm) was greater than that of control cells (15.4 ± 4.0 µm; Fig. 2E). Analysis of the length distribution of the total dendrites revealed that the increase in average length was primarily due to the existence of long dendrites in the MTCL2-depleted cells, which were rarely observed in the control cells (Fig. S2C). For instance, the maximum dendritic length of individual CGNs was 35.7 ± 11.5 µm on average for control cells and 54.0 ± 21.6 µm for the MTCL2-depleted cells (Fig. S2D). The proportion of dendrites longer than 40 µm in the total number of dendrites was 3.14 ± 0.13% in control cells and 14.36 ± 0.10% in MTCL2-depleted cells (Fig. 2F). These changes in dendrite numbers and length distribution in MTCL2-depleted cells were reversed by expressing RNAi-resistant mouse MTCL2 (Fig. 2D–F; Fig. S2B–D). In summary, these results indicate that MTCL2 depletion leads to abnormal CGN development, resulting in fewer longer dendrites.
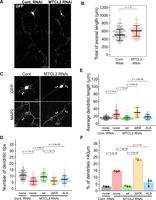
Depletion of MTCL2 resulted in the development of fewer and longer dendrites. A, Full views of single CGNs treated with the indicated RNAi and fixed at DIV6. The cells were visualized using GFP signal. Scale bar: 50 µm. B, Distribution of the total axonal length of individual CGNs subjected to the indicated RNAi and fixed at DIV6. C, Dendritic development of CGNs subjected to the indicated RNAi and fixed at DIV6. Cells were visualized using GFP and MAP2 signals. The arrowheads indicate the dendrites of GFP-positive cells. Scale bar, 10 µm. D, Distribution of the total number of dendritic tips of individual CGNs subjected to the indicated RNAi/rescue conditions and fixed at DIV6. E, Distribution of the averaged dendritic lengths of the individual CGNs analyzed in D. Each data point in B, D, and E represents the result of one neuron from three independent experiments. The means ± SD are shown for each scatterplot. F, The percentage of dendrites longer than 40 µm in all dendrites of the same CGNs analyzed in D and E. Each data point represents the average value from each of the three independent experiments. The means ± SE are shown. For all datasets, statistical significance was assessed using the Kruskal–Wallis test with the Holm-corrected Mann–Whitney U test, except for F, for which a one-way analysis of variance test was employed in conjunction with a Holm-corrected Welch's two-sample t test.
In MTCL2-depleted CGNs, dendrite extensions are biased in the direction opposite to axon elongation
While characterizing MTCL2-depleted CGNs, we observed that their dendrite extensions were biased in the opposite direction of axon elongation (Fig. 2A,C). To confirm this tendency, we quantitatively estimated the direction of dendrite extension in the CGNs at DIV6. Angles were measured based on the positions of the base of each dendrite (MAP2-positive neurite) and an axon (MAP2-negative, thin neurite) on the cell body (see Fig. 3A for an illustration). Consistent with previous reports (Powell et al., 1997; Zmuda and Rivas, 1998), control cells extended dendrites evenly in all directions (Fig. 3B). Conversely, dendrite extension in MTCL2-depleted CGNs was weakly or strongly biased toward the same or opposite directions of axon elongation, respectively, when focusing on dendrites longer than 15 µm (Fig. 3B). The directional bias (r), defined as the ratio of the number of dendrites extending forward or backward versus left or right, was 1.22 ± 0.05 and 1.66 ± 0.10 for control cells and MTCL2-depleted cells, respectively (Fig. 3C). However, expressing RNAi-resistant MTCL2 in MTCL2-depleted cells suppressed the directional bias of dendritic extension to 1.01 ± 0.03 (Fig. 3B,C). These results suggest that MTCL2-depleted CGNs exhibit bipolarity in relation to the direction of axon elongation, extending fewer and longer dendrites in that direction (Fig. S2E).

Dendrite extensions and Golgi apparatus positions of MTCL2-depleted CGNs biased in the direction opposite to axonal elongation. A, The extension directions of dendrites longer than 15 µm were defined as the angle (θ) formed between the roots of the dendrite and an axon, as depicted. B, θ distribution of individual dendrites of CGNs subjected to the indicated RNAi/rescue conditions and fixed at DIV6. The θ values are categorized in four directions and presented in polar histograms of the average values from each of the three independent experiments (more than 350 dendrites from the indicated number of cells were analyzed for each condition). Data represent the means ± SE. C, Comparison of dendritic direction bias (r) between the conditions. r = 1 indicates no direction bias. Each data point represents the average value from each of the three independent experiments. The means ± SE are shown. D, The position of the Golgi apparatus for individual CGNs was estimated as the angle (θ) formed between the center of the Golgi apparatus and the roots of an axon, as depicted. E, θ distribution of the Golgi position in CGNs subjected to the indicated RNAi/rescue conditions and fixed at DIV6. The θ values are categorized in four directions and presented in polar histograms of the average values for each from the three independent experiments (indicated number of cells were analyzed for each condition). Data represent the means ± SE. F, Comparison of direction bias (r) of the Golgi position under each condition. Each data point represents the average value from each of the three independent experiments. The means ± SE are shown. In C and F, the one-way ANOVA test with the Holm-corrected Welch's two-sample t test was employed to ascertain statistical significance.
MTCL2 is necessary for the transition of dendrite extensions from bipolar to multipolar
In vivo, CGNs first extend two bipolar axons parallel to the brain surface in the EGL of the cerebellum and then migrate vertically deep into the IGL (Solecki et al., 2006). During this migration process, they newly extend a leading process toward migration, which eventually becomes a dendrite (Kawaji et al., 2004). Meanwhile, a trailing process connected to the bipolar axons is dragged behind them. These facts indicate that, in vivo, CGNs temporarily exhibit another bipolarity similar to that of MTCL2-depleted cells after losing their initial bipolarity. However, because no live imaging analysis has been conducted on primary cultured CGNs, it is unclear whether they exhibit the intermediate bipolar morphology with a single axon in vitro, as observed in vivo. To investigate this, we examined the polarity of CGN dendrite extensions during the middle stage (DIV3) when MAP2-positive dendrites begin to appear (Fig. 1D, Fig. 4). Immunostaining with the axon marker Ankyrin G and the dendrite marker MAP2 revealed that all of the CGNs that we analyzed had a single, long axon and multiple dendrites (an average of 3.4 dendrites per cell; Fig. 4A). This indicates that these cells have exited the initial bipolar stage with two axons and entered a stage in which they elongate multiple dendrites. In these DIV3 CGNs, the directions of dendrite extension were strongly biased toward the same axis as the axon elongation, as was observed in MTCL2-depleted cells (Fig. 4B, Fig. S3A). Interestingly, similar to MTCL2-depleted cells at DIV6, DIV3 CGN dendrites were fewer but longer than DIV5 CGN dendrites (Fig. 4C, Fig. S3B). These results support the hypothesis that MTCL2 knockdown arrests the bipolar-to-multipolar transition of dendrite extension, which normally occurs during CGN differentiation.

MTCL2 is required for the transition from bipolar to multipolar dendrite extension. A, Representative morphologies of CGNs at DIV3 visualized by GFP. Axons and dendrites were identified by staining with Ankyrin G and MAP2, respectively. Arrows and arrowheads indicate dendrites and an axon of the GFP-expressing cell, respectively. Scale bar, 20 µm. B, θ distribution of individual dendrites of CGNs at DIV3 and 5. Polar histograms of the average values from each of the three independent experiments are shown (more than 350 dendrites from the indicated number of cells were analyzed for each condition). The means ± SE are indicated. C, Distribution of the average dendritic length of the individual CGNs analyzed in B. Each data point represents the result of one neuron in three independent experiments. The means ± SD are shown for each scatterplot. D, Comparison of the direction bias (r) of the Golgi position in the GCNs at DIV3 and DIV5. Each data point represents the average value from each of the three independent experiments. The means ± SE are shown. See Figure S3C for the corresponding polar histogram. For verifying statistical significance in C and D, the Wilcoxon rank-sum test and Welch's two-sample t test were used, respectively. E, F, Representative live imaging data of GFP-expressing CGNs transfected with control (E) or MTCL2 (F) knockdown vectors. In each case, bipolar CGNs were selected at DIV3, and recordings were performed for 48 h. The frames showing the characteristic changes in the dendrite extensions are only presented for each CGN (for comprehensive images, refer to Movies 1 and 2). Arrowheads indicate axons. Arrows indicate initial stable dendrites. Note that the MTCL2-depleted CGN exhibited shrinkage of the preexisting bipolar dendrites but failed to persistently extend short dendrites in multiple directions. Instead, the cell stably extended long bipolar dendrites, again. Scale bars, 50 µm.
To examine this hypothesis directly, we subjected GFP-expressing CGNs to live imaging at DIV3. We recorded the morphological changes every 2 min for 48 h (Fig. 4E,F; Movies 1, 2). Consistent with the aforementioned results, most cells at this stage exhibited extended bipolar neurites and a thin, long axon (arrowheads) at the beginning of the recording (Fig. 4E,F; Fig. S3D). The control cell in Figure 4E had a thick neurite (arrow) that extended in the direction opposite to the axon (arrowheads) and remained relatively stable for several hours (0–6.2 h). Additionally, during this initial phase, several short neurites grew and shrank dynamically in the same direction as axon elongation (Fig. 4E, Movie 1). A few hours after recording began, the thick neurite started shrinking (6.2–9.2 h). In parallel, short dynamic neurites began elongating from various sites on the cell body after 8.2 h. The cell eventually acquired a multipolar morphology with short dendrites (Fig. 4E, Fig. S3E, Movie 1). At this stage, the initial thick neurite became indistinguishable from the other neurites in terms of length, thickness, and dynamic nature. Live imaging data were obtained from 52 control CGNs in two independent experiments. Of these cells, 66% exhibited bipolar dendrite extension at the start of the recording (Fig. S4D). Of these cells, 26% (17% of those recorded) maintained a bipolar morphology throughout the observation period; however, 61% (40% of those recorded) underwent a transition from a bipolar to a multipolar morphology (Fig. S4D). These results support the notion that dendrite extension polarity undergoes a bipolar-to-multipolar transition during CGN differentiation in vitro. As expected, MTCL2 knockdown reduced the percentage of CGNs exhibiting the bipolar-to-multipolar transition of dendrite extension to 36% (27% of the recorded cells), while increasing the percentage of cells that continued to exhibit a bipolar morphology to 56% (42% of the recorded cells; Fig. S4D).
Morphological changes in the control CGN from DIV3 to DIV5. GFP fluorescence images were acquired every 2 min for 40 h. The video speed was 30 fps. The representative frames of this movie are shown in Figure 4E. [View online]
Morphological changes in the MTCL2-depleted CGN from DIV3 to DIV5. GFP fluorescence images were acquired every 2 min for 40 h. The video speed was 30 fps. The representative frames of this movie are shown in Figure 4F. [View online]
Interestingly, of the control cells that had already developed multipolar dendrites at the beginning of the recording, 25% (9% of total cells recorded) transitioned to a bipolar morphology by the end. These results suggest that the multipolar morphology is unstable, at least initially, and must be stabilized to avoid reverting to the bipolar morphology. MTCL2 knockdown increased the percentage of cells undergoing this multipolar-bipolar transition to 54% of cells exhibiting the multipolar morphology at the beginning of the recording (Fig. S4D). This indicates that MTCL2 is also required for this stabilization process. Figure 4F and Movie 2 show an example of MTCL2-depleted CGNs that once exhibited a bipolar-to-multipolar transition but ultimately reverted to a bipolar morphology by newly extending stable, long dendrites in the opposite direction of axon elongation (Fig. S3E).
These results indicate that the bipolar-to-multipolar transition of dendrite extensions occurs during normal CGN differentiation and that MTCL2 is necessary to facilitate this process.
MTCL2 depletion also affects dendrite extension polarity of CGNs in vivo
Next, we examined the effect of MTCL2 knockdown on CGNs in vivo (Fig. 5). For this analysis, the knockdown plasmid was introduced into the cerebellar EGL of P6 mice via in vivo electroporation (Adachi et al., 2021). The injected cerebella were fixed and sectioned at P12 to examine CGN migration and differentiation. Almost all GFP-positive CGNs were found in the IGL of mice injected with the control plasmid (Fig. 5A). In contrast, some GFP-positive cells remained in the molecular layer (ML) of mice injected with the MTCL2 knockdown plasmid (Fig. 5A, white arrowheads). This phenotype may be related to the role of MTCL2 in directional migration observed in cultured cells (Matsuoka et al., 2022). Nevertheless, the majority of MTCL2-depleted CGNs migrated to the IGL in a manner similar to that of control CGNs (Fig. 5A). These results suggest that although MTCL2 knockdown can affect the initial stage of CGN migration within the ML, it does not significantly prevent their subsequent migration into the IGL during the P6–P12 period, provided that the initial stage is overcome. This can be explained by considering that whether or not a CGN remains in the ML depends on the timing when the transfected knockdown plasmid induces sufficient reduction in MTCL2 expression. Interestingly, MTCL2-depleted CGNs were occasionally observed even in the white matter (Fig. 5A, yellow arrows). This may indicate that MTCL2 also plays a significant role in the normal termination of CGN migration within the IGL.

MTCL2 depletion affects dendrite extension polarity of CGNs in vivo. A, B, CGNs in the EGL of P6 mice were electroporated with either the control or the MTCL2 knockdown shRNA vector, both of which coexpressed GFP. The single images generated from the z-stack confocal image projection are shown. Cerebellar sagittal sections were prepared at P12. The EGL, molecular layer (ML), IGL, and white matter (WM) were identified by DAPI staining (magenta). White arrowheads in A indicate CGNs arrested in the ML, and yellow arrows indicate CGNs invading the WM. Red asterisks in B indicate CGNs exhibiting bipolar morphology. Scale bar, 50 µm. C, Three-dimensional distribution of dendritic root positions on cell bodies. The cell center of each CGN was placed at the center of the illustrated box, and each cell was oriented such that the direction of its axon root points toward the red arrow, and its parallel fibers are aligned with the black double arrow. Dendrites longer than the cell body were analyzed. More than 100 dendrites each from 24 control CGNs and 31 MTCL2 knockdown CGNs (collected from at least five mice each) were analyzed. D, Left, The angle distribution of the individual dendrites analyzed in C relative to the direction of axon elongation (0°). The angles were categorized as either parallel or perpendicular and are presented in polar histograms as indicated. The distribution of the average value for dendrites detected in each mouse is shown. The means ± SE are indicated. Right, Distribution of directional biases of dendrite extension (r) calculated as in Figure 3C. Each data point represents the average from each mouse treated with the indicated RNAi. The means ± SE are shown. Welch's two-sample t test was used to examine statistical significance. E, F, Contactin-1 (E) or GABAARα6 (F) expression in MTCL2 knockdown CGNs in the IGL at P12. Yellow arrows indicate GFP-positive CGNs in which MTCL2 expression is suppressed. Scale bar, 50 µm.
Next, we examined the dendrite extension polarity of CGNs found in the IGL. In the control mice, many GFP-positive CGNs extended multiple dendrites (Fig. 5B, Fig. S4A, Movie 3). However, to our surprise, the quantitative analysis of dendrite extension polarity revealed that, unlike CGNs cultured in vitro, those differentiated in vivo preferred to extend their dendrites to perpendicular to the axon (Fig. 5C,D). To the best of our knowledge, this is the first detailed quantification of dendrite extension polarity of CGNs in vivo. In contrast, MTCL2-depleted CGNs lost this bias, with more dendrites extending along the axonal elongation axis (Fig. 5B–D, Fig. S4A, Movie 4). Overall, these results suggest that MTCL2 is essential for disrupting the bipolarity of migrating CGNs developed along the axis of axonal elongation. It is conceivable that the MTCL2 activity observed in an in vitro culture system is an expression of this MTCL2 activity in vivo.
3D reconstructed images of a control CGN in IGL in vivo. Three-dimensional stereoscopic images were reconstructed from z-stack images of a CGN in the IGL of a mouse transfected with the control shRNA vector. Cell shape was visualized using the GFP signal. [View online]
3D reconstructed images of MTCL2 knockdown CGN in IGL in vivo. Three-dimensional stereoscopic images were reconstructed from z-stack images of a CGN in the IGL of a mouse transfected with the MTCL2 knockdown shRNA vector. Cell shape was visualized using the GFP signal. [View online]
In the above analysis, MTCL2 knockdown also affected the development of the glomerular structure at the dendrite tip in CGNs identified in the IGL (Fig. S4A–C; Jakab and Hámori, 1988). Therefore, we finally examined whether MTCL2 inhibits the normal differentiation of CGNs using markers of migrating (cortactin-1/F3) and mature (GAGA-A receptor α6) CGNs (Weyer and Schilling, 2003; Xenaki et al., 2011; Dey et al., 2022). The expression of both marker proteins in MTCL2-depleted cells was comparable to that in the surrounding GFP-negative cells (Fig. 5E,F, yellow arrows). These results support the hypothesis that MTCL2 regulates dendritic extension polarity downstream of the normal CGN differentiation program.
MTCL2 promotes the bipolar-to-multipolar transition of dendrite extension through its MT- and Golgi-binding activity
Numerous studies have demonstrated a close association between the localization of the Golgi apparatus and the development of various neurite processes, including axons, dendrites, and leading processes involved in neuronal migration (Zmuda and Rivas, 1998; Horton et al., 2005; Matsuki et al., 2010; Tanabe et al., 2010; O’Dell et al., 2012). In fact, an initial study of isolated cultures of CGNs (Zmuda and Rivas, 1998) reported that the Golgi apparatus localizes to the sites in the cell body from which bipolar axons originate during the initial bipolar phase of CGN differentiation. Interestingly, this correspondence with the Golgi position was not observed at the elongation sites of dendrites, which develop in multiple directions in the later stage (Zmuda and Rivas, 1998). This suggests that the disruption of the localized position of the Golgi apparatus is impaired in MTCL2-depleted cells. Therefore, we next examined the localization of the Golgi apparatus in MTCL2-depleted cells (Fig. 3D–F). Consistent with a previous report (Zmuda and Rivas, 1998), the Golgi apparatus did not exhibit any specific localization in DIV6 of control CGNs. However, in MTCL2-depleted CGNs at the same stage, the Golgi position was clearly biased toward the direction opposite to axon elongation, similarly to dendrite elongation. This abnormality was randomized again by expressing RNAi-resistant MTCL2. Interestingly, CGNs at DIV3 exhibited a similarly biased Golgi localization (Fig. 4D, Fig. S3C). These results support the possibility that MTCL2 disrupts the bipolarity of dendrite extensions by affecting the Golgi position.
To evaluate this possibility, we examined the ability of MTCL2 mutants to rescue the defects exhibited by MTCL2-depleted CGNs (Figs. 2, 3; Fig. S2). Unlike wild-type MTCL2, MTCL2 mutants lacking MT- (ΔKR) or Golgi- (4LA) binding activity (Matsuoka et al., 2022) failed to rescue the biased polarity of dendrite elongation and the Golgi localization (Fig. 3B,C,E,F). In addition, they did not restore the reduced number of dendrites observed in MTCL2-depleted CGNs (Fig. 2D, Fig. S2B). The only exception was that the 4LA mutant, but not the ΔKR mutant, exhibited substantial rescue activity for dendrite length (Fig. 2E,F; Fig. S2C,D). Consequently, MTCL2-depleted CGNs expressing RNAi-resistant MTCL2 4LA developed a few short dendrites with biased polarity (Fig. S2E). Our live imaging analysis revealed that the bipolar-to-multipolar transition of dendrite extensions of CGNs is divided into two events, one is the destabilization of bipolar long neurites, and the other is the de novo development of short neurites from various positions of the cell body (Fig. 4E, Movie 1). Therefore, the abovementioned results on MTCL2 4LA suggest that the Golgi-binding activity of MTCL2 is not essential for the destabilization of bipolar long neurites. However, the present results also clarified that the de novo development of multipolar dendrites requires both MT- and Golgi-binding activities of MTCL2 in CGNs.
During the late stage of CGN polarization, the Golgi apparatus exhibited upward extension along the microtubule cage surrounding the nucleus
To investigate how MTCL2 promotes the bipolar-to-multipolar transition of dendrite extension in more detail, we examined the subcellular localization of MTCL2 in relation to MTs and the Golgi apparatus.
Consistent with our previous observations in HeLa-K cells, basal confocal images of mature CGNs (DIV5) revealed intermittent granular MTCL2 staining on MT bundles passing through MAP2-positive dendrites (Fig. S5A). In addition, numerous MTCL2 signals were observed in the cell bodies (Fig. 6A, Fig. S5A). These signals frequently colocalized with an MT network in the cell bodies that was efficiently stained by anti-tyrosinated but not anti-acetylated tubulin antibodies (Fig. S5B,C). Serial analysis of z-stack confocal images (Fig. 6A,B) and their reconstructed z-sectional views (Fig. 6C, Movie 5) revealed that the MT network completely encircles the nucleus. This indicates that it corresponds to the MT cage, the presence of which has been reported in CGNs (Rivas and Hatten, 1995; Xie et al., 2003; Solecki et al., 2004; Umeshima et al., 2007). Preferential staining with anti-tyrosinated, but not anti-acetylated, tubulin antibodies corroborated this conclusion (Umeshima et al., 2007).

The Golgi apparatus in differentiated CGNs was sequestered into the MT cage surrounding the nucleus. A, High-resolution confocal images of mature CGNs (DIV5) stained for tyrosinated tubulin, MTCL2, and GS28 (Golgi membrane protein). Three images of the same field in different confocal planes are presented from the basal to apical planes, as indicated. Scale bar, 5 µm. B, The boxed regions in A were enlarged to show the localization of tyrosinated tubulin, MTCL2, and the Golgi apparatus. The orange arrows indicate the typical sites where MTCL2 signals localize to the contact sites between the MT cage and the Golgi apparatus. Scale bar, 5 µm. C, Cross-sectional views of the z-stack images along the dotted line in A. Two types of merged images with different antibody combinations are presented. The arrows indicate the Golgi apparatus at the top of the nucleus. Scale bar, 2 µm. D, High-resolution confocal images of immature CGNs at DIV2 and DIV3 after staining with tyrosinated tubulin and GS28. Scale bar, 5 µm. E, Height distribution of the apical edge of the Golgi apparatus estimated as a percentage of the cell heights (Fig. S7A). Each data point represents the result of one neuron observed in three independent experiments. The means ± SD are shown for each scatterplot. The Kruskal–Wallis test was employed in conjunction with the Holm-corrected Mann–Whitney U test to ascertain statistical significance.
3D reconstructed images of polarized CGNs at DIV5. The z-stack images of the CGNs shown in Figure 5A were reconstructed into 3D stereoscopic images with different staining combinations. [View online]
Interestingly, the Golgi apparatus in CGNs at DIV5 is often associated with the MT cage on the lateral or apical surfaces of the nucleus (Fig. 6A–C; Fig. S5D). Consequently, the Golgi apparatus was drawn toward the nucleus, extending its apical end toward the upward direction along the nuclear surface (Fig. 6C). In the most extreme cases, the entire apparatus was placed on top of the nucleus (Fig. 6C, arrows; Movie 5). This differs greatly from the situation observed in CGNs at DIV2. At this stage, the Golgi apparatus was found in the basal position, biased toward the base of one of the bipolar processes, as previously reported (Fig. 6D, Fig. S6B; Zmuda and Rivas, 1998). Some DIV2 cells contained cortical MTs underneath the apical membranes of their cell bodies (Fig. 6D; Fig. S6B, arrowhead). However, these MTs were not organized into a dense, isotropic network. Rather, they tended to align parallel to the preexisting bipolar axis (Fig. 6D). Even at the CGNs at DIV3, where isotropic network-like MT structures were detected (Fig. 6D, Fig. S6A), the upward shift of the Golgi apparatus was not significant compared with DIV5 (Fig. 6D, Fig. S6B). Quantitative analysis demonstrated that the cell heights of the CGNs at DIV3 and DIV5 did not differ significantly (Fig. S7A,B). However, the height of the apical end of the Golgi apparatus relative to the corresponding cell height increased as the polarization proceeded (Fig. 6E). These results suggest that the final CGN polarization is tightly coupled with the sequestration of the Golgi apparatus from the base of the bipolar neurites into an MT cage around the nucleus. This is consistent with a previous report that the Golgi apparatus in mature CGNs is not localized to the base of any neurites, including axons and dendrites (Zmuda and Rivas, 1998).
MTCL2 promotes the sequestration of the Golgi apparatus into the MT cage
As observed in previous studies in HeLa-K cells (Matsuoka et al., 2022), some MTCL2 signals in the cell body were detected at the apparent contact sites between the MT cage and the Golgi apparatus in CGNs (Fig. 6A–C; Fig. S5D; Fig. S6), consistent with the ability of MTCL2 to associate with both MTs and the Golgi apparatus. Considering that both the MT- and the Golgi-binding activities of MTCL2 were necessary to disrupt the biased localization of the Golgi apparatus in the x–y plane (Fig. 3E,F), these results suggest that MTCL2 plays a crucial role in the upward extension of the Golgi apparatus by facilitating its association with the MT cage. To verify this possibility, we reexamined the positions of the Golgi apparatus in MTCL2-depleted cells in the z direction (Fig. 7). As expected, the positions of the Golgi apparatus were significantly lowered in MTCL2-depleted cells (Fig. 7A,B). Quantitative analysis demonstrated that MTCL2 knockdown did not change the cell height (Fig. S7C). However, the apical ends of the Golgi apparatus were lowered to a level similar to that observed in bipolar DIV3 CGNs (Fig. 7C). This defect was restored by expressing wild-type RNAi-resistant MTCL2 but not by expressing MTCL2 ΔKR or 4LA mutants (Fig. 7C). These results support the hypothesis that MTCL2 extends the Golgi apparatus upward along the nucleus by connecting it to the MT cage (Fig. 8A).

MTCL2 promotes the upward extension of the Golgi apparatus in an MT- and Golgi-binding activity-dependent manner. A, High-resolution confocal images of CGNs subjected to the indicated RNAi, fixed at DIV6, and stained for tyrosinated tubulin and GS28. On the left, the projected views of the z-stack images are shown to indicate cells expressing the indicated shRNA vector together with GFP. On the right, the confocal images obtained at three different focus planes are shown. Scale bar, 5 µm. B, Cross-sectional views of the z-stack images along the dotted lines in A. Asterisks indicate GFP-positive cells. Scale bar: 5 µm. C, Height distribution of the Golgi apical edge in CGNs subjected to the indicated RNAi/rescue conditions and fixed at DIV6. Each data point represents the result of one neuron observed in three independent experiments. The means ± SD are shown for each scatterplot. The Kruskal–Wallis test was employed in conjunction with the Holm-corrected Mann–Whitney U test to ascertain statistical significance. D, Comparison of MT cage density in CGNs subjected to different conditions. The intensity of the tyrosinated tubulin signal across the entire cell body of a single CGN was quantified along the eight lines shown above and averaged for each CGN based at each normalized distance from the cell center. The results were further averaged for cells obtained from two independent experiments and plotted from the cell center to the periphery according to the normalized distance. The number of cells (n) analyzed for each condition is indicated in parentheses. The means ± SD are shown. The p values estimated using the one-way ANOVA test with the Holm-corrected Welch’s two-sample t test are listed in Figure S7F.

The inhibition of LINC complex activity mimicked most of the phenotypes induced by MTCL2 knockdown. A, Schematic of our working hypothesis. During the late phase of CGN polarization, the MTCL2-mediated association between the Golgi apparatus and the MT cage induces an upward extension of the Golgi apparatus along the nucleus. This recruitment to the MT cage results in the sequestration of the Golgi apparatus from the roots of the preexisting bipolar dendrites. The molecular organization of the LINC complex on the nuclear membrane is illustrated on the right. B, A typical cross-sectional view of CGNs expressing GFP-KASH1, fixed at DIV6, and stained for MTCL2 and GS28. The white dotted lines indicate the focus plane from which the confocal image shown in Figure S8A was obtained. Scale bar, 5 µm. C, Apical confocal section of a GFP-KASH1-expressing cell stained for MTCL2 and tyrosinated tubulin. Scale bar, 5 µm. D, θ distribution of the Golgi position in CGNs expressing GFP or GFP-KASH1, examined at DIV6. Data are presented as polar histograms as shown in Figure 3E for the indicated number (n) of cells from three independent experiments. E, Height distribution of the Golgi apical edge in the same CGNs analyzed in D. F, θ distribution of individual dendrites of CGNs expressing GFP or GFP-KASH1, examined at DIV6. Data are presented as polar histograms as shown in Figure 3B for >400 dendrites of the indicated number (n) of cells from three independent experiments. G, H, Distribution of the number of dendritic tips (G) and averaged dendritic length (H) of the same CGNs analyzed in F. Each data point in E, G, and H represents the result of a single neuron. The means ± SE are shown in D and F, whereas the means ± SD are shown for each scatterplot (E, G, H). The Wilcoxon rank-sum test was used to examine statistical significance.
Regarding MTs, no obvious effects of MTCL2 knockdown were observed in MT bundles running within dendrites (Fig. 7A). However, we did notice that the density of the MT cage network was reduced in MTCL2-depleted cells (Fig. 7B, Fig. S7E). To quantify the MT cage density in each cell, we divided the cell into eight equal parts by drawing lines connecting the cell center to the periphery and measured the intensity of the tyrosinated tubulin signal along each line (Fig. 7D). As shown in Figure 7D, the signals measured by this method gradually decreased from the cell periphery toward the center. However, the decrease in the tyrosinated tubulin signal slowed down when it reached the cell center, and an increase in the tubulin signal was observed around the cell center (around the cell apex). The statistical significance of the reduction in MTCL2 knockdown cells was confirmed in this cell center region (around the cell apex; Fig. 7D, Fig. S7F). This defect was restored by expressing wild-type RNAi-resistant MTCL2 but not by expressing the MTCL2 ΔKR mutant (Fig. 7D; Fig. S7E,F), suggesting that the MT-crosslinking activity of MTCL2 contributes to the densification of the MT cage network, which occurs late in CGN differentiation. Unexpectedly, MTCL2 4LA failed to rescue the reduced density of the MT cage network despite being expected to maintain normal MT-crosslinking activity. Rather, the data indicate that the expression of the 4LA mutant worsens the defect in MT cage formation in MTCL2 knockdown cells (Fig. 7D, Fig. S7F). In HeLa-K cells, MTCL2 organizes microtubules using the Golgi apparatus as a scaffold to develop a microtubule network around the Golgi (Matsuoka et al., 2022). Given this finding, in mature CGNs, the incorporation of the Golgi into the microtubule cage via MTCL2 may promote the densification of the microtubule cage network.
The LINC complex activity is necessary for sequestering the Golgi apparatus into the MT cage
The MT cage in CGNs was first observed 30 years ago (Rivas and Hatten, 1995), but its molecular basis remains unclear. The LINC complex is a potential candidate associated with the MT cage because it links the nuclear membrane to MTs (Chang et al., 2015; Kengaku, 2018). Recent studies have revealed the indispensable role of the LINC complex in nuclear rotation, deformation, and translocation during CGN migration (Wu et al., 2018; Zhou et al., 2024). Therefore, to confirm the involvement of the MT cage in the bipolar-to-multipolar transition of dendrite elongation, we investigated the role of the LINC complex in this process.
The Nesprin protein is a component of the LINC complex located in the outer nuclear membrane (Fig. 8A). It interacts with MT motors via its N-terminal cytoplasmic stretch. Another component is the inner nuclear membrane protein SUN, which interacts with the nuclear lamina and chromatin within nucleus via its N-terminus (Fig. 8A). Nesprins interact with SUN proteins through their C-terminal KASH domains in the perinuclear space (Fig. 8A). Consequently, the overexpression of a Nesprin-1 mutant lacking the cytoplasmic stretch (KASH1) inhibits LINC complex activity by dominantly interfering with the interaction between endogenous Nesprin-1/2 and SUN proteins (Stewart-Hutchinson et al., 2008; Wu et al., 2018).
When expressed in primary cultured CGNs, GFP-KASH1 localized to the nuclear membrane, as expected (Fig. 8B). Close examination revealed a network-like distribution of GFP-KASH1 on the nuclear membrane, likely reflecting the underlying nuclear lamina pattern via SUN proteins (Fig. 8C, Fig. S8A). These cells maintained a partial overlap with MTCL2 localization in both the Golgi apparatus and the MT cage, suggesting that GFP-KASH1 did not interfere with MTCL2 interaction with the Golgi and MTs (Fig. 8B,C; Fig. S8A). In addition, unlike in MTCL2-depleted cells, GFP-KASH1 expression did not prevent the increase in the tyrosinated tubulin signals at the cell apex (Figs. S7E, S8B), suggesting that the fineness of the MT cage was not significantly reduced by GFP-KASH1 expression. Nevertheless, the randomization of the Golgi position in the x–y plane (Fig. 8D, Fig. S8C) and the upward extension of the Golgi apparatus in the z direction (Fig. 8B,E) were specifically suppressed in these cells to a similar extent as that observed in MTCL2-depleted CGNs.
Importantly, when we examined the polarity of dendrite extensions, cells expressing GFP-KASH1 exhibited a reduced number of dendrites with a biased extension direction to the preexisting bipolar axis (Fig. 8F,G; Fig. S8D). As these cells did not exhibit a significant increase in dendritic length (Fig. 8H, Fig. S8E), they perfectly mimicked the phenotypes exhibited by MTCL2-depleted CGNs expressing the MTCL2 4LA mutant, which lacks Golgi-binding activity (Fig. S2E, Fig. S8F). These results support the hypothesis that the MTCL2-mediated sequestration of the Golgi apparatus within the MT cage plays a pivotal role in the multipolar development of dendrites observed in CGNs during the final stage of their polarization.
Discussion
MTCL2 is a novel MT-binding protein that crosslinks MTs on the Golgi membrane (Matsuoka et al., 2022). In this study, we demonstrated that MTCL2 is highly expressed in CGNs and plays an indispensable role in the bipolar-to-multipolar transition of dendrite extension observed at the late stage of differentiation. We also provide evidence suggesting that MTCL2 facilitates this polarity conversion by mediating the sequestration of the Golgi apparatus into the MT cage surrounding the nucleus.
The unique polarization process observed in isolated CGN cultures was first reported in 1997 (Powell et al., 1997; Zmuda and Rivas, 1998; Kollins et al., 1999). These pioneering studies have demonstrated that the localized position of the Golgi apparatus is intricately linked to the origin sites of the initial bipolar axons (Zmuda and Rivas, 1998). However, the process by which the initial bipolar morphology transforms into the final complex morphology involving multiple short dendrites extending in various directions remains unclear. In this study investigating the function of MTCL2 in CGNs, we discovered for the first time that dendrite extension was bipolar rather than multipolar in the initial phase of this polarity conversion (Fig. 4A,B; Fig. S3A). The live imaging analysis of CGNs from DIV3 to DIV5 supported this conclusion and revealed that this bipolarity is disrupted through two distinct processes: destabilization of the stable dendrites elongating opposite to an axon and the de novo generation of unstable dendrites from the multiple sites of the cell body (Fig. 4E, Movie 1). MTCL2 knockdown impeded both processes, resulting in fewer dendrites and biased longer extensions in the direction opposite to an axon (Fig. 2C–F; Fig. S2B–D; Fig. 3B,C; Fig. 4F; Movie 2). The rescue experiments indicated that the MT-binding activity of MTCL2 was required for both processes, whereas the Golgi-binding activity was dispensable for the sustained destabilization of a bipolar long neurite and only required for the persistent generation of multipolar dendrites from the cell body.
In vivo, CGNs exhibit an intermediate bipolar morphology after losing their initial bipolar morphology and before acquiring their final complex morphology (Solecki et al., 2006; Tahirovic and Bradke, 2009). During this second bipolar phase, CGNs develop a leading process toward their migration and a trailing process that extends backward (Gao and Hatten, 1993; Solecki et al., 2006). Kawaji et al. (2004) demonstrated that the leading process in this phase exhibits dendritic properties and ultimately contracts, resulting in its differentiation into one of the multipolar dendrites. These features of the leading process are highly similar to those of stable dendrites observed in vitro in DIV3 CGNs that elongate in the direction opposite the axon (Fig. 4). Therefore, it is highly plausible that the bipolarity observed in DIV3 CGNs with single axons and that exhibited by MTCL2-depleted CGNs in vitro corresponds to the bipolarity exhibited by migrating CGNs in vivo. Indeed, when we introduced the MTCL2 knockdown plasmid into CGNs in vivo, many cells failed to disrupt migrating bipolarity and still showed a bias in dendritic extension along the axon direction, even though most cells reached the IGL (Fig. 5B–D). These results clearly indicate that the bipolarity disrupted by MTCL2 activity corresponds to the second intermediate bipolarity established during CGN migration. Interestingly, in our in vivo experiments, MTCL2-depleted CGNs occasionally migrated further into the white matter beyond the IGL (Fig. 5A). This may indicate that breaking the bipolarity for migration is necessary to terminate CGN migration within the IGL. The underdevelopment of glomerular structures in MTCL2-depleted CGNs (Fig. S4) may also indicate that the loss of bipolarity in migrating CGNs is necessary for the development of connections with other neurons, such as mossy fibers. Regarding the mature marker protein GABAAR α6, MTCL2-deficient CGNs exhibited expression levels equivalent to control cells (Fig. 5F). However, further research is required to confirm that MTCL2 depletion caused these phenomena without directly affecting CGN differentiation.
In this study, we were unable to elucidate how the MT-binding activity of MTCL2 contributes to the first event observed in the conversion of CGNs from bipolar to multipolar morphology: the process by which long bipolar dendrites become unstable. To resolve this issue, it is first necessary to verify changes in microtubule stability and dynamics within the dendrites of MTCL2 knockdown CGNs. However, we successfully proposed an intriguing hypothesis regarding the mechanism by which the MT- and Golgi-binding activities of MTCL2 promote the multidirectional development of new short dendrites. Our discovery that the Golgi apparatus extends along the nucleus in late-stage CGNs in a manner dependent on these two activities of MTCL2 (Figs. 6, 7) raised the possibility that MTCL2 mediates binding to the MT cage, thereby isolating the Golgi body from the existing bipolar dendritic base to the MT cage. This sequestration of the Golgi apparatus is considered to result in the inhibition of polarized vesicle transport required for asymmetric dendrite extension and promote the de novo extension of short dendrites in multiple directions. The involvement of the MT cage was further substantiated by the finding that inhibition of the normal formation of the LINC complex also results in the similar phenotypes exhibited by MTCL2-depleted CGNs (Fig. 8F, Fig. S8D). Importantly, unlike MTCL2-depleted cells, cells in which the LINC complex was inhibited did not significantly reduce the formation of the MT cage (Fig. S8B). However, the cells exhibited suppression of the upward extension of the Golgi apparatus to a level similar to that exhibited by MTCL2 knockdown (Fig. 8E). These results indicate that the reduced density of the MT cage mesh observed in MTCL2-depleted cells is not the primary cause of defects in the bipolar-to-multipolar transition of the dendritic extensions. The finding that the inhibition of the LINC complex suppressed the upward shift of the Golgi apparatus without affecting the formation of the MT cage also suggest that the pulling forces generated by the MT motors are involved in the sequestration of the Golgi apparatus into the MT cage (Fig. 8A).
The critical role of the Golgi apparatus in dendrite development has been extensively studied (Horton et al., 2005; Tanabe et al., 2010; Wu et al., 2015; Nakagawa and Iwasato, 2023). However, most of these studies have focused on the analysis of pyramidal neurons in the cerebral cortex and hippocampus, as well as on Purkinje cells in the cerebellum. These neurons all develop thick primary dendrites that are polarized apically, also known as apical dendrites. These studies demonstrate that polarized Golgi localization is required for asymmetric dendrite growth. In contrast, the present study distinguished itself by analyzing CGNs that exhibit near-symmetric short dendrites with uniform length and suggested that sequestering the Golgi apparatus from the base of any dendrite is essential for developing multipolar dendrites devoid of any asymmetry. Furthermore, during this analysis, the MT cage was identified as the target structure to which the Golgi apparatus was sequestered. Because the MT cage had previously been studied only in terms of its role in nucleokinesis observed in neural cell migration (Rivas and Hatten, 1995; Xie et al., 2003; Solecki et al., 2004), the present finding suggests an unexpected function of this higher-order MT structure. The molecular mechanism suggested by this study may be specific to CGNs, as the MT cage has primarily been observed in CGNs, though not conspicuously in other neurons (Rivas and Hatten, 1995; Solecki et al., 2004; Umeshima et al., 2007). However, many nonpyramidal neurons, such as GABAergic interneurons, lack apical dendrites and develop symmetrical, uniform dendrites (Müller et al., 1984; Horton et al., 2005). In addition, some pyramidal neurons remodel their asymmetric dendrites by withdrawing their apical dendrites and acquiring a multipolar morphology (Koester and O’Leary, 1992). Therefore, at least in part, neurons other than CGNs may utilize the MT cage-dependent regulation of the Golgi position. Our in vivo analysis also suggests the intriguing possibility that a similar mechanism also functions in more general neurons, enabling them to terminate migration toward their target sites and transition to the final stage of differentiation where dendritic outgrowth begins.
In summary, the results of this study shed light on how CGNs extend dendrites in multiple directions. Our results highlight the significance of the MT cage surrounding the nucleus in removing the Golgi apparatus from the base of preexisting neurites. The critical importance of the MTCL2-mediated association between the Golgi apparatus and the MT cage, as well as that of the LINC complex-mediated fixation of MT motors to the nuclear membrane, was also suggested in this study.
Footnotes
- Received May 21, 2025.
- Revision received February 11, 2026.
- Accepted February 19, 2026.
-
We thank Dr. Tomoko Satake for her initial support in the establishment of the primary cerebellar granule cell culture. This research was supported by KAKENHI (to A.S.; grant numbers 19H03228, 22H02621, and 25K02273) of the Ministry of Education, Culture, Sports, Science and Technology (MEXT) of Japan.
-
The authors declare no competing financial interests.
-
This paper contains supplemental material available at: https://doi.org/10.1523/JNEUROSCI.0996-25.2026
- Correspondence should be addressed to Atsushi Suzuki at abell{at}yokohama-cu.ac.jp.
- Copyright © 2026 the authors




