Corticotropin-Releasing Factor and Somatostatin Neurons in the Central Amygdala Mediate Dynamic Defensive Behaviors during Fear Extinction
- Quan-Son Eric Le1,2,
- Emma Lardant1,3,
- Yumnah Siddiqui1,2,
- Thamidul Alam1,2,
- Kylie Evans1,3, and
- Jonathan P. Fadok1,3
- 1Tulane Brain Institute, Tulane University, New Orleans, Louisiana 70118
- 2Program in Neuroscience, Tulane University, New Orleans, Louisiana 70118
- 3Department of Psychology, Tulane University, New Orleans, Louisiana 70118
-
Author contributions: Q-S.E.L., E.L., and J.P.F. designed research; Q-S.E.L. and E.L. performed research; Q-S.E.L., E.L., Y.S., T.A., and J.P.F. analyzed data; Q-S.E.L., K.E., and J.P.F. wrote the first draft of the paper.
Abstract
Traumatic experiences can result in heightened fear responses to trauma-associated stimuli. These symptoms can be difficult to extinguish, so identifying neuronal targets for facilitating fear extinction is critical. Many studies investigating fear learning in mice measure conditioned fear via freezing, but other defensive behaviors, such as flight, can also be present during conditioning. The central amygdala (CEA) mediates conditioned freezing and flight responses via corticotropin-releasing factor-positive (CRF+) and somatostatin-positive (SOM+) neuron populations. However, it is unknown how these populations regulate changes in freezing and flight responses as fear extinction is learned. Thus, we investigated the roles of CRF+ and SOM+ CEA neurons in modulating defensive behaviors during extinction. To elicit dynamic defensive responses in male and female mice, we used a modified pavlovian conditioned flight paradigm that paired an aversive footshock with a serial compound stimulus (SCS) consisting of tone followed by white noise (WN), resulting in freezing during the tone that rapidly transitioned into flight (escape jumping and darting) during WN. We used optogenetics in CRF-Cre and SOM-Cre mice to selectively excite and inhibit CRF+ and SOM+ CEA populations during WN presentation within extinction. Within early extinction, CRF+ inhibition reduced WN-evoked jumping and led to subsequent context-specific reduction in tone-evoked freezing. During extinction, SOM+ excitation replaced early WN-evoked flight with freezing, and both SOM+ excitation and inhibition reduced WN-evoked darting. Collectively, these data demonstrate modulation of jumping and darting behaviors within extinction via CRF+ and SOM+ CEA activity. These findings suggest mechanisms of attenuating multiple defensive behaviors during extinction.
Significance Statement
Fear extinction is a critical process for recovery from trauma, but it is often impaired by persistent fear responses. We conducted these experiments to better understand how defensive behaviors involved in learned fear are modulated during fear extinction through activity in the central amygdala. We found that inhibiting corticotropin-releasing factor-positive neurons reduced escape jumping, exciting somatostatin-positive neurons replaced flight with freezing, and unbalancing somatostatin activity reduced darting behaviors. Overall, this work highlights modulatory roles of central amygdala neuron populations in selecting and directing defensive behaviors over the course of fear extinction, which can assist in future endeavors to reduce unwanted fear responses in those suffering from fear disorders with impaired fear extinction.
Introduction
Over 70% of people experience traumatic events (Benjet et al., 2016), potentially developing post-traumatic stress disorder (PTSD; Kessler et al., 2017). PTSD victims often exhibit impaired fear extinction (Wessa and Flor, 2007; Milad et al., 2009), resulting in persistent, life-disrupting fear responses to trauma-related stimuli (Maren et al., 2013). To uncover mechanisms of fear extinction and identify PTSD-related treatment targets, studies utilize classical pavlovian fear conditioning in animal models (Bolles, 1970; Bolles and Collier, 1976; Grewe et al., 2017; Roy et al., 2017; Bouton et al., 2021), where a conditioned stimulus (CS), often a context or auditory tone cue (Phillips and Ledoux, 1992), is paired with an aversive unconditioned stimulus (US), often footshock (Blanchard and Blanchard, 1969; Bolles and Collier, 1976), to induce freezing responses with subsequent CS presentations (Ledoux, 2000). Repeatedly presenting the CS without the US induces fear extinction, reducing CS-evoked freezing afterwards (Myers and Davis, 2002). For decades, freezing has been the dominant behavioral measure of fear learning and extinction (Tovote et al., 2015).
However, studies highlight additional conditioning-elicited defensive behaviors, including flight (Fadok et al., 2017), escape jumping (Chu et al., 2024), and darting (Gruene et al., 2015). In nature, defensive responses occur along a predatory imminence continuum (Fanselow, 2018), adapting based on threat proximity, intensity, and context (Perusini and Fanselow, 2015). Despite documentation of varied fear responses, nonfreezing defensive behaviors are not well explored in fear learning studies, obscuring mechanisms of adaptive defensive responses. To bridge this gap, a modified pavlovian conditioning paradigm was developed that elicits freezing, jumping, and darting responses to conditioned stimuli (Fadok et al., 2017; Borkar et al., 2020, 2024; Borkar and Fadok, 2021; Le et al., 2024). In this “conditioned flight” paradigm, the CS is a serial compound stimulus (SCS) consisting of a tone followed by white noise (WN). When this SCS is paired with footshock, rodents freeze in response to tone and switch to flight (jumping and darting) responses during WN presentation (Dong et al., 2019; Totty et al., 2021). As mice undergo extinction, tone-evoked freezing diminishes, and the WN response uniquely de-escalates, with jumping behavior downscaling to freezing and darting across the extinction session (Le et al., 2024). These findings showcase that freezing, darting, and jumping behaviors dynamically change based on threat imminence and fear extinction learning. Using this conditioned flight paradigm, neuronal mechanisms behind changes in dynamic defensive responses across extinction can be explored in-depth, revealing targets for attenuating trauma-associated responses during treatment.
The central amygdala (CEA) modulates defensive responses (Fadok et al., 2018) via GABAergic inhibitory neurons (Ciocchi et al., 2010), which include corticotropin-releasing factor-positive (CRF+) and somatostatin-positive (SOM+) populations. Activating CRF+ CEA neurons promotes anxiety (McCall et al., 2015) and stress responses (Henckens et al., 2016), and inhibition suppresses threat reactivity and impairs the extinction of conditioned freezing (Hartley et al., 2019; Demaestri et al., 2024). Activating SOM+ CEA neurons drives the acquisition and expression of conditioned freezing (Li et al., 2013; Zhou et al., 2018), and inhibition facilitates active defensive behaviors (Yu et al., 2016). Additionally, circuits involving CRF+ and SOM+ CEA neurons dynamically remodel and alter neuronal activity between conditioning and extinction (Hartley et al., 2019). These two CEA populations distinctly control conditioned freezing and arousal, but their roles in directing other defensive behaviors are unclear. Previously, CRF+ and SOM+ CEA neurons have been shown to modulate flight and freezing behavior within the conditioned flight paradigm (Fadok et al., 2017), but their roles in controlling defensive behaviors during extinction remain unexplored.
To elucidate the roles of CRF+ and SOM+ CEA neurons in directing extinction-dependent defensive behaviors within the conditioned flight paradigm, we used optogenetics to excite and inhibit each population during WN presentation during extinction, tested each group's extinction recall post-manipulation, and then examined populations for colocalization. We hypothesized that CRF+ neurons were necessary for flight in early extinction, and SOM+ neurons would drive the transition from flight to freezing over extinction.
Materials and Methods
Animal subjects
Nearly equal numbers of male and female CRF-IRES-Cre (Jackson Laboratory, #012704) and SOM-IRES-Cre (Jackson Laboratory, #013044) mice aged 3–6 months were used in this study (numbers detailed further below). All mice were individually housed on a 12 h light/dark cycle with ad libitum access to food and water. Surgeries and behavioral experiments were performed during the light cycle. All animal procedures were performed in accordance with institutional guidelines and were approved by the Institutional Animal Care & Use Committee of Tulane University.
Behavioral apparatus and serial compound stimulus presentation
Behavioral testing was performed in one of two contexts for each session for all experiments. Context A consisted of a 30-cm-diameter transparent acrylic cylinder with a smooth acrylic floor, cleaned with 1% acetic acid between each subject. Context B consisted of a modular fear conditioning chamber (ENV-307W, Med Associates) with metal grid flooring and walls of polycarbonate, stainless steel, and polyurethane, cleaned with 70% ethanol solution between sessions. Alternating current footshocks (ENV-414S, Med Associates) were delivered to the mice during conditioning in Context B. A programmable audio generator (ANL-926, Med Associates) generated auditory stimuli that were delivered at 75 dB in each context via an overhead speaker (ENV-224AM, Med Associates). A SCS was used, consisting of 10 pips of tone (7.5 kHz, 0.5 s at 1 Hz) followed by 10 pips of white noise (0.5 s at 1 Hz). The white noise (WN) was random and composed of frequencies from 1 to 20,000 Hz. Behavioral protocols were generated using Med-PC software (Med Associates) to control auditory stimuli, light stimulation, and shock with high temporal precision.
A conditioned flight paradigm for investigating dynamic defensive behaviors
Behavioral testing took place over 5 d (Fig. 1). On Day 1 (Pre-Exposure), subjects were placed in Context A for a baseline period of 3 min, followed by four presentations of the SCS with a pseudorandom interstimulus interval (ISI) period of 90–100 s and a period of 40 s following the final SCS presentation, totaling 590 s per session. Day 2 and Day 3 (Conditioning) took place in Context B. On each Conditioning day, after a 3 min baseline period, mice were presented with five pairings of the SCS coterminating with a 1 s, 0.9 mA footshock, with pseudorandom ISI periods of 90–150 s and a period of 60 s following the final footshock of the session, totaling 820 s. Stimulus timing and ISI differed between Day 2 and Day 3 to avoid predictable anticipation of stimuli before presentation. Day 4 (Extinction) took place in Context B. After a 3 min baseline period, mice were presented with 16 presentations of the SCS with pseudorandom ISI periods of 60–120 s and a period of 50 s following the final SCS of the session, totaling 1,910 s. During Extinction, light stimulation was delivered during WN presentation (stimulation parameters detailed further below). Day 5 (Recall) took place across two sessions for each mouse, separated by a period of at least 3 h. The first session (Recall1) took place in Context A, and the second session (Recall2) took place in Context B. Each Recall session consisted of a baseline period of 3 min followed by four presentations of the SCS with pseudorandom ISI periods of 80–100 s and a period of 50 s following the final SCS presentation, totaling 590 s per session. Subjects were killed and perfused after the conclusion of behavioral testing. Cohorts for each instance of behavioral testing varied in number of mice and groups involved.

Experimental design. A, Viral vector and optic fiber stub targeting strategy for optogenetic manipulation of the central amygdala (CEA) in CRF-Cre and SOM-Cre mice. Partially created with BioRender.com. B, Representative images of EYFP-tagged virus expression (green) in the CEA and fiber stub implantation above the CEA in CRF-Cre (left) and SOM-Cre (right) mice. Scale bar represents 200 µm. C, Graphic representation of the serial compound stimulus (SCS) and timing of the light delivery for optogenetic manipulation during white noise presentation. D, Stages of the conditioned flight paradigm with optogenetic manipulation over 5 d. Colored squares indicate the day mice receive light through attached fiberoptic patch cables. E, Graphic collection of viral expression (green ovals) and fiber placements (magenta rectangles) of each CRF-Cre group in the CEA, distributed through coronal brain sections. F, Graphic collection of viral expression (green ovals) and fiber placements (magenta rectangles) of each SOM-Cre group in the CEA, distributed through coronal brain sections. CRF, corticotropin-releasing factor; SOM, somatostatin.
Stereotaxic surgery for viral vector injection and optic fiber implantation
Mice were deeply anaesthetized using 5% isoflurane (Fluriso, VetOne) in oxygen-enriched air (OxyVet O2 Concentrator, VetEquip), injected subcutaneously with 5 mg/kg meloxicam (OstiLox, VetOne), and then fixed into a stereotaxic frame (Model 900, Kopf Instruments) equipped with a robotic stereotaxic targeting system (NeuroStar). Anaesthetized mice were maintained on 2–2.5% isoflurane, and a core body temperature was maintained at 36°C using a feedback-controlled direct current temperature controller (ATC2000, World Precision Instruments). Eye ointment (GenTeal Tears, Alcon) was applied to prevent dryness. The head was shaved, and the skin was sterilized using betadine iodine solution (Purdue Products). Then, 0.1 ml of 2% lidocaine (VetOne) was injected subcutaneously at the site of incision, and a midline incision was made to expose the skull. Craniotomies were drilled above target region coordinates using a 0.6 mm drill burr (Harvard Apparatus).
For viral vectors, pAAV-EF1a-DIO-hChR2(H134R)-EYFP-WPRE-HGHpa (Addgene #20298), pAAV-EF1a-DIO-EYFP (Addgene #27056), and pAAV-EF1a-DIO-eNpHR3.0-EYFP (Addgene #26966) were used. Approximately 0.4 μl of viral vector per hemisphere was injected bilaterally into the CEA using pulled glass pipettes (tip diameter 10–20 μm, PC-100 puller, Narishige International), connected to a pressure ejector (PDES-Pressure Application System, NPI Electronic Equipment). The CEA coordinates used were as follows: 1.22 mm posterior to bregma, ±3.00 mm lateral to the midline and 4.4 mm below the dura.
Two to three weeks after viral vector injection, animals were bilaterally implanted with self-constructed fiber stubs made with ceramic LC ferrules (CFLC230, 230 μm diameter, 6.4 mm length, Thorlabs) and multimode glass fiber (FP200URT, 0.50 NA, 200 μm diameter, 5–6 mm exposed length, Thorlabs). Optic fiber tips were lowered to 100–200 μm above the CEA. Implants were fixed to the skull with cyanoacrylate glue gel (SuperGlue), dental cement (Ortho-Jet powder and black liquid acrylate, Lang), and two miniature self-tapping screws (00.90-100-M-SS-FH, US Micro Screw) to serve as anchor points. Experiments were conducted at least 4 weeks after viral infections and at least 2 weeks after fiber implantations. Mice were never older than 6 months at the end of behavioral testing.
Optogenetic manipulation of CRF+ and SOM+ CEA populations
For optogenetic modulation, a Plex controller system (Plexon) was operated through Radiant software (Plexon). Two PlexBright LED modules (Plexon) were connected to the controller, and an LC patch cable (200–230 µm fiber, 1 m long, 0.66 NA, Plexon) was connected. Laser power at the fiber tip was measured before testing with an optical power and energy meter (PM100D, Thorlabs) and adjusted to reach a value of at least 8 mW. The patch cable was connected to head-mounted fiber stubs using ceramic sleeves (Plexon).
During Day 4, light stimulation was delivered during each presentation of WN (Fig. 1A–D), starting at the termination of the last tone pip and coterminating with the last WN pip (total 10 s). For ChR2-induced excitation (CRF: N = 4 females, 5 males; SOM: N = 4 females, 6 males), mice received blue light pulses (465 nm, 300 mA), with differing frequencies for CRF-Cre (10 Hz, 10 ms width) and SOM-Cre (50 Hz, 5 ms width) groups. These frequencies were based on previous experiments with CRF-Cre and SOM-Cre mice (Fadok et al., 2017). For eNpHR3-induced inhibition (CRF: N = 5 females, 4 males; SOM: N = 6 females, 3 males), mice received constant orange light (620 nm, 250 mA). Control mice injected with EYFP-expressing viral vector (CRF: N = 6 females, 4 males; SOM: N = 6 females, 4 males) received one of either option of light.
Tissue processing
Following the completion of experiments, mice were anaesthetized with a terminal dose of tribromoethanol (240 mg/kg) and perfused transcardially with phosphate-buffered saline (PBS) followed by 4% paraformaldehyde (PFA) in PBS. Brains were isolated and stored in 4% PFA overnight. The next day, fixed brains were sectioned using a vibrating microtome (Precisionary) or a vibratome (Leica Biosystems) into 80-μm-thick coronal slices of the CEA.
For antibody staining via immunohistochemistry, tissue sections were washed in PBS–Triton X-100 (PBST, 0.3%) and blocked using 5% donkey serum in PBST for 1 h followed by an overnight incubation in goat anti-GFP primary antibody (NB-100-1770, Novus Biologicals) at 4°C. After primary antibody incubation, sections were washed in PBST and incubated in donkey anti-goat Alexa Fluor 488 secondary antibody (A-11055, Invitrogen). Following final rinses with PBS, sections were mounted on glass slides. Images were obtained using an Axio Scan.Z1 slide-scanning microscope (Zeiss). Mice were included in data analysis only if bilateral expression specific to the CEA was observed (target verifications detailed in Fig. 1E,F).
Fluorescence in situ hybridization
CRF-Cre (heterozygous, N = 4 females, 3 males) and SOM-Cre (homozygous, N = 4 females, 4 males) mice were injected with pAAV-EF1a-DIO-EYFP (Addgene #27056) bilaterally into the CEA and perfused 3 weeks later with PBS and 4% PFA. After at least 4 h, fixed brains were transferred to 30% sucrose for cryoprotection and were submerged for at least 24 h until tissue was no longer floating. Fixed brains were sectioned using a vibratome into 30-μm-thick coronal slices of the CEA, then placed onto SUPERFROST+ (22-037-246, Fisherbrand) slides, which were stored at −20°C for at least 24 h.
A RNAScope Multiplex Fluorescent V2 Assay (323100, Bio-Techne) was used to perform FISH, following the detection protocol for fixed frozen tissue (document 323100-USM, Bio-Techne). Briefly, sections were baked for 45 min at 41°C then immersed in 4% PFA for 30 min at room temperature, placed through progressive dehydration, and treated with PretreatPro Reagent (Bio-Techne) to increase permeability to target RNAs, and then the Assay was performed using RNAScope Probes Mm-Crh-C2 (316091-C2, Bio-Techne) and Mm-Sst-C1 (404631, Bio-Techne) with fluorescent dyes Opal 690 and Opal 570, respectively (Bio-Techne). All hybridization steps were performed at 41 ± 0.5°C using a 20 L digital laboratory incubator (Model SYSLDGZJ20L0QIYG1V1; VEVOR). Viral vector expression was visualized using the same anti-GFP immunohistochemical antibody staining process as detailed above. Images were obtained using a confocal microscope (FV3000, Olympus), and cells were counted and analyzed for colocalization using Fiji (Schindelin et al., 2012).
Data analysis
All sessions were recorded to video using a camera (Pike, Allied Vision) mounted above the behavioral contexts with stimulus events encoded to the same files using TTL pulses (OmniPlex, Plexon). Contour tracking (CinePlex, Plexon) was used to automatically detect freezing based on frame-by-frame changes in pixels. Freezing behavior was defined as a cessation of nonrespiratory movement for at least 1 s, and results were confirmed with an observer blinded to the condition. By determining a calibration coefficient using the known size of the behavioral context and the camera's pixel dimensions, speed (cm/s) was extracted per frame using the animal's center of gravity. Escape jumps and darting behaviors were manually classified by an observer blinded to the condition. Jumps were defined as the period where the mouse had all four paws above the chamber floor. Darting was defined as rapid bursts of movement across the floor of the chamber measured at least 12 cm/s over an interval of <1 s. Two female mice from the CRF-Cre Control group and one female mouse from the SOM-Cre ChR2 group were removed from Recall data analysis due to fiber implant instability and recording malfunctions.
To ensure robust expression of fluorescent markers for validation of FISH-obtained data, SOM-Cre mice were maintained as homozygotes, while CRF-Cre mice were heterozygotes. For each mouse line, images were assessed for efficiency, specificity, and cross-lineage leakage of relevant biomarkers. Efficiency was defined as the percentage of marker-positive (CRF+ or SOM+) cells that were GFP+ (Number of GFP+ cells/Number of marker-positive cellsX100). Specificity and cross-lineage leakage were defined as the percentage of GFP+ cells that either expressed the target marker (Number of marker-positive cells/Number of GFP+ cellsX100) or off-target markers (Number of marker-negative cells/Number of GFP+ cellsX100), respectively.
Statistical analysis
Data were analyzed for statistical significance using Prism 10 (GraphPad Software) and IBM SPSS Statistics (IBM). For all tests, the definition of statistical significance was p < 0.05. All data were checked for normal distribution using the Shapiro–Wilk normality test (α = 0.05). One-way ANOVA was used to assess behavioral differences between all groups, and two-way ANOVA was used to assess interactions of time point and viral vector between groups. Mixed ANOVA was used to assess context and group as factors together. One-way multivariate ANOVA (MANOVA) was used to assess if groups differed in both freezing and average speed. When any of these ANOVAs yielded significant interactions, Tukey's or Sidak's post hoc multiple-comparisons test was used to detect significant behavioral differences between groups when appropriate. A negative binomial generalized linear model was used to analyze count-based data that did not pass the normality test. Fisher's exact test was used to analyze the number of mice per group that engaged in a given behavior. Because sex differences in SCS-induced freezing and flight behavior were not detected in previous studies (Borkar et al., 2020; Le et al., 2024), we did not power this study to statistically test for sex differences. Given the smaller sample sizes for each group and variations in marker expression, nonparametric Mann–Whitney test was used to compare FISH-related measures between groups.
Results
CRF+ CEA neurons do not affect WN-evoked freezing or speed during extinction
To determine if the CRF+ CEA population has a role in directing the changes in flight behaviors to WN that were previously observed (Le et al., 2024), we used optogenetics in CRF-Cre mice to activate and inhibit CRF+ neurons during WN presentations in the extinction stage of the conditioned flight paradigm. During Pre-Exposure and Conditioning, all CRF-Cre groups behaved as observed in previous iterations of the conditioned flight paradigm (Borkar et al., 2020; Le et al., 2024).
To visualize behavioral changes over extinction (Day 4), we plotted behavioral responses over all trials and compared the first and last 4-trial bins for each group of CRF-Cre mice. For tone-evoked freezing (Fig. 2A), we did not find an interaction of trial and group (two-way ANOVA, F(30,400) = 0.57, p = 0.969), but we did find main effects of trial (F(15,400) = 2.85, p = 0.0003) and group (F(2,400) = 7.9, p = 0.0004). When comparing early (first bin) freezing during tone to late (last bin) freezing (Fig. 2B), we found no interaction of trial and group (one-way ANOVA, F(2,50) = 0.679, p = 0.512) or main effect of group (F(2,50) = 2.46, p = 0.096), but we did find a main effect of trial (F(1,50) = 18.26, p < 0.0001). This indicates that there were no tangential effects of WN-locked manipulation of CRF+ CEA neurons on extinction of tone-evoked freezing.
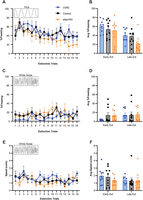
CRF+ CEA neurons do not affect freezing or speed to white noise during extinction. A, Freezing during the tone period for all CRF-Cre groups. B, Comparison of average freezing during the tone period for all CRF-Cre groups between the first and last 4-trial bins of Extinction. C, Freezing during the white noise (WN) period for all CRF-Cre groups. D, Comparison of average freezing during the WN period for all CRF-Cre groups between the first and last 4-trial bins of Extinction. E, Speed during the WN period for all CRF-Cre groups. F, Comparison of average speed during the WN period for all CRF-Cre groups between the first and last 4-trial bins of Extinction. ChR2: n = 9, Control: n = 10, eNpHR3: n = 9. Data for all figures is presented as mean ± SEM and were analyzed using two-way ANOVA.
Neither excitation nor inhibition of CRF+ CEA neurons during WN within Day 4 affected WN-evoked freezing in the CRF-Cre groups (Fig. 2C). We did not find an interaction of trial and group (two-way ANOVA, F(30,400) = 0.75, p = 0.832), and we did not find a main effect of trial (F(15,400) = 0.9, p = 0.564), but we did find a main effect of group (F(2,400) = 5.3, p = 0.0054). We found no significant effects when comparing early freezing during WN to late freezing (Fig. 2D), as there was no interaction of trial and group (one-way ANOVA, F(2,50) = 0.69, p = 0.507) or main effects of trial (F(1,50) = 1.42, p = 0.239) or group (F(2,50) = 0.94, p = 0.398). Analyzing average speed during WN yielded similar results (Fig. 2E), as we found a lack of interaction between trial and group (two-way ANOVA, F(30,400) = 0.71, p = 0.87) and no main effect of trial (F(15,400) = 1.34, p = 0.17), but a main effect of group (F(2,400) = 4.09, p = 0.017). When comparing early speed to late speed (Fig. 2F), we found no interaction of trial and group (two-way ANOVA, F(2,50) = 0.40, p = 0.623) and no main effects of trial (F(1,50) = 1.69, p = 0.199) or group (F(2,50) = 0.473, p = 0.626). Thus, freezing or speed to WN within extinction was not affected by CRF+ CEA activity.
Inhibition of CRF+ CEA neurons reduces jumping responses to WN during extinction
Next, we quantified and analyzed escape jumping and darting behaviors during WN presentation across extinction. Across all 4-trial bins of Day 4 (Fig. 3A), the ChR2 and control groups jumped at similar levels to WN (ChR2 total: 24; Control total: 25), while the eNpHR3 group jumped much less (total: 4). This difference is most apparent in the first bin, when jumps are most prominent during extinction (Le et al., 2024). Given that each group had several mice that did not jump during WN (# of jumpers to WN: ChR2: 4/9; Control: 6/10; eNpHR3: 3/9), we used a negative binomial generalized linear model to examine the effect of CRF+ activation and inhibition on average WN-evoked jumps compared with control mice (Fig. 3B). We found that eNpHR3 mice reduced jumping compared with controls (β = 28.12, CI: 26.118–30.121, p < 0.001), but there was no significant change in the ChR2 mice (β = 0.154, CI: −2.601 to 2.909, p = 0.913). Fisher's exact test yielded no differences in the number of mice per group that jumped to WN (ChR2 vs Control, p = 0.656; Control vs eNpHR3, p = 0.37; ChR2 vs eNpHR3, p > 0.99).
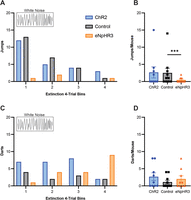
Inhibition of CRF+ CEA neurons reduces escape jumping responses to white noise during extinction. A, The cumulative distribution of jumps during the white noise (WN) period for all CRF-Cre groups, separated into 4-trial bins of Extinction. B, Comparison of total jumps per mouse from all WN periods of Extinction for all CRF-Cre groups. C, The cumulative distribution of darts during the WN period for all CRF-Cre groups, separated into 4-trial bins of Extinction. D, Comparison of total darts per mouse from all WN periods of Extinction for all CRF-Cre groups. ChR2: n = 9, Control: n = 10, eNpHR3: n = 9. Data from A and C are presented as raw numerical values. Data from B and D are presented as mean ± SEM and were analyzed using negative binomial generalized linear model. ***p < 0.001.
With regard to WN-induced darting, there were unique trends for each group (Fig. 3C). ChR2 mice displayed darting until decreasing in the fourth bin (total: 24), while control mice displayed more consistent amounts of darting throughout extinction (total: 11). The eNpHR3 group, interestingly, exhibited an increasing level of darting across the session, darting the most to WN out of all groups within the fourth bin (total: 18). As was observed with jumping, there were several nondarters in each group (# of darters to WN: ChR2: 5/9; Control: 4/10; eNpHR3: 5/9). When comparing the average WN-evoked darts of ChR2 and eNpHR3 groups to controls (Fig. 3D), we found no effect of optogenetic manipulation (negative binomial generalized linear model, ChR2 vs Control, β = −28.72, CI: −1,090,755.33 to 1,090,697.9, p = 1.00; eNpHR3 vs Control, β = 27.33, CI: −1,090,699.3 to 1,090,753.9, p = 1.00). Fisher's exact test did not yield any significant differences in darting between groups (ChR2 vs Control, p = 0.656; Control vs eNpHR3, p = 0.656; ChR2 vs eNpHR3, p > 0.99).
Overall, optogenetic inhibition of CRF+ CEA neurons during WN presentation reduced the number of escape jumps during extinction, while darts were unaffected.
CRF+ CEA inhibition during extinction attenuates post-extinction freezing to tone during recall in the threat context
On Day 5, we measured freezing and speed to the tone and WN periods within both the neutral (Recall1) and threat (Recall2) contexts to determine the extent to which CRF+ CEA manipulation during extinction affected post-extinction recall of extinction learning (Fig. 1D). Average tone-evoked freezing did not differ between groups in the neutral context (Fig. 4A; one-way ANOVA, F(2,23) = 1.29, p = 0.29), but there were differences when the mice were placed back into the threat context (Fig. 4B; one-way ANOVA, F(2,23) = 9.07, p = 0.0012). During recall in the threat context, eNpHR3 mice that had experienced CRF+ inhibition during WN froze less to tone compared with ChR2 (Tukey's multiple-comparisons test, ChR2 vs eNpHR3, p = 0.011) and control mice (Tukey's multiple-comparisons test, Control vs eNpHR3, p = 0.0015). ChR2 and control mice did not differ in tone-evoked freezing (Tukey's multiple-comparisons test, ChR2 vs Control, p = 0.621). However, we did not find a significant effect of context for any group for tone-evoked freezing (mixed ANOVA, F(2,23) = 1.51, p = 0.24).

CRF+ CEA inhibition during extinction attenuates post-extinction freezing to tone during recall in the threat context. A, Comparison of average freezing during the tone period in the neutral context of Recall1 for all CRF-Cre groups. B, Comparison of average freezing during the tone period in the threat context of Recall2 for all CRF-Cre groups. C, Comparison of average freezing during the white noise (WN) period in the neutral context of Recall1 for all CRF-Cre groups. D, Comparison of average freezing during the WN period in the threat context of Recall2 for all CRF-Cre groups. E, Comparison of average speed during the tone period in the neutral context of Recall1 for all CRF-Cre groups. F, Comparison of average speed during the WN period in the threat context of Recall2 for all CRF-Cre groups. ChR2: n = 9, Control: n = 8, eNpHR3: n = 9. Data from all figures are presented as mean ± SEM and were analyzed with one-way ANOVA and Tukey's multiple-comparisons test. *p < 0.05, **p < 0.01.
There were no significant effects of CRF+ manipulation on responses during WN. Groups did not differ in average freezing to WN within the neutral (Fig. 4C; one-way ANOVA, F(2,23) = 0.49, p = 0.62) or the threat context (Fig. 4D; one-way ANOVA, F(2,23) = 0.48, p = 0.622). Additionally, we found no differences in average speed during WN in either the neutral (Fig. 4E; one-way ANOVA, F(2,23) = 0.69, p = 0.51) or the threat context (Fig. 4F; one-way ANOVA, F(2,23) = 0.265, p = 0.77). Additionally, we did not observe jumping to WN during Recall in either context, and darting to WN was minimal in both Recall1 (ChR2 total: 2; Control total: 0; eNpHR3 total: 1; # of darters to WN: ChR2: 1/9; Control: 0/8; eNpHR3: 1/9) and Recall2 (ChR2 total: 3; Control total: 2; eNpHR3 total: 8; # of darters to WN: ChR2: 3/9; Control: 2/8; eNpHR3: 4/9). Thus, while CRF+ inhibition during the WN period in Day 4 did not affect WN-evoked responses on Day 5, it had an attenuating effect on post-extinction freezing to the tone in the threat context.
Overall, CRF+ CEA inhibition during WN seemed to have the greatest effect on jumping within early extinction. The decreased freezing to tone within the threat context during post-extinction recall could reflect increased downscaling of response intensity, given that the intensities of freezing and flight to tone and WN decrease concomitantly over extinction (Le et al., 2024). These results could point to a mechanism for preventing high-intensity threat responses in the early stages of fear extinction.
SOM+ CEA neuron excitation during early extinction promotes freezing
To investigate how SOM+ CEA neurons affect the extinction of flight behaviors within the conditioned flight paradigm, we performed the same behavioral paradigm for the SOM-Cre groups as the CRF-Cre groups, using optogenetic manipulation during WN in extinction. During Pre-Exposure and Conditioning, there were no differences in SCS-evoked behavioral responses between groups (Borkar et al., 2020; Le et al., 2024). When analyzing tone-evoked freezing across Day 4, we did not find any interaction of trial and group (Fig. 5A; two-way ANOVA, F(30,416) = 0.86, p = 0.68), but we did find main effects of trial (F(15,416) = 2.34, p = 0.032) and group (F(2,416) = 12.77, p < 0.0001). When comparing the first and last 4-trial bins of extinction (Fig. 5B), we did not find differences in freezing to the tone (one-way ANOVA, F(2,52) = 0.156, p = 0.856) or a main effect of group (F(2,52) = 1.362, p = 0.265), but there was a main effect of trial (F(1,52) = 8.08, p = 0.0064).

SOM+ CEA neuron excitation replaces early flight to white noise with freezing. A, Freezing during the tone period for all SOM-Cre groups. B, Comparison of average freezing during the tone period for all SOM-Cre groups between the first and last 4-trial bins of Extinction. C, Freezing during the white noise (WN) period for all SOM-Cre groups. D, Comparison of average freezing during the WN period for all SOM-Cre groups between the first and last 4-trial bins of Extinction. E, Speed during the WN period for all SOM-Cre groups. F, Comparison of average speed during the WN period for all SOM-Cre groups between the first and last 4-trial bins of Extinction. G, Comparison of average speed during the WN period for all SOM-Cre groups during the first four trials of Extinction. ChR2: n = 10, Control: n = 10, eNpHR3: n = 9. Data for A–F is presented as mean ± SEM and were analyzed using two-way ANOVA and Tukey's/Sidak's multiple-comparisons test when appropriate. Data for G is presented as mean ± SEM and were analyzed using one-way ANOVA and Tukey's multiple-comparisons test. **p < 0.01, ****p < 0.0001.
While tone-evoked freezing was not affected by optogenetic manipulation, exciting SOM+ CEA neurons during the WN in extinction produced significant changes to WN-induced freezing. There was an interaction between trial and group (Fig. 5C; two-way ANOVA, F(30,416) = 1.95, p = 0.0024), with a main effect of group (F(2,416) = 19.44, p < 0.0001) but not trial (F(15,416) = 1.04, p = 0.417). Within the first four trials, the ChR2 group froze to WN significantly more than the control (Tukey's multiple-comparisons test, ChR2 vs Control, p < 0.05 for trials 1–3, p = 0.056 for trial 4) and eNpHR3 (Tukey's multiple-comparisons test, ChR2 vs eNpHR3, p < 0.05 for all) groups, which did not differ in freezing performance (Tukey's multiple-comparisons test, Control vs eNpHR3, p > 0.74 for all). Additionally, we found similar results when comparing the first and last bins of extinction (Fig. 5D; one-way ANOVA, F(2,52) = 9.71, p = 0.0003; main effect of trial, F(152) = 4.47, p = 0.039; main effect of group, F(2,52) = 12.79, p < 0.0001), with the same differences between groups in the first bin (Sidak's multiple-comparisons test, ChR2 vs Control, p < 0.0001; ChR2 vs eNpHR3, p < 0.0001; Control vs eNpHR3, p = 0.99). Within the final four trials, all groups’ freezing to WN remained at similar levels (Sidak's multiple-comparisons test, ChR2 vs Control, p = 0.96; ChR2 vs eNpHR3, p = 0.861; Control vs eNpHR3, p = 0.97). ChR2 mice displayed a significant decrease in WN-evoked freezing from early to late extinction (Sidak's multiple-comparisons test, Early vs Late, p < 0.0001), while the control (Sidak's multiple-comparisons test, Early vs Late, p = 0.844) and eNpHR3 (Sidak's multiple-comparisons test, Early vs Late, p = 0.976) groups maintained a lower level of freezing overall.
Consistent with the increase in freezing, average speed during WN remained below baseline for the ChR2 group (Fig. 5E). We found no interaction between group and trial (F(30,416) = 0.709, p = 0.87) and no main effect of trial (F(15,416) = 0.518, p = 0.931), but there was a main effect of group (F(2,416) = 35.76, p < 0.0001). These results mirrored our findings when comparing early and late bins of speed (Fig. 5F; two-way ANOVA, F(2,52) = 1.4, p = 0.256; main effect of trial, F(1,52) = 0.027, p = 0.871; main effect of group, F(2,52) = 13.27, p < 0.0001). Given that we found a main effect of group in Figure 5E,F, we analyzed speed during WN within only the first bin of extinction (Fig. 5G). The ChR2 mice exhibited significantly less speed to WN (one-way ANOVA, F(2,26) = 13.6, p < 0.0001) compared with the control and eNpHR3 groups (Tukey's multiple-comparisons test, ChR2 vs Control, p < 0.0001; ChR2 vs eNpHR3, p = 0.0037; Control vs eNpHR3, p = 0.392), concordant with the elevated freezing observed.
Given the separate effects of increased freezing and lowered average speed during early extinction from exciting SOM+ CEA neurons, we examined if the ChR2 group differed from the other groups when factoring these behavioral measures together. We found that optogenetic manipulation significantly influenced behavioral responses during WN in early extinction (MANOVA, Wilks’ lambda test, F(4,50) = 11.38, p < 0.001), with significant effects in both freezing (F(2,26) = 22.15, p < 0.001, partial η2 = 0.63) and average speed (F(2,26) = 13.6, p < 0.001, partial η2 = 0.51). Post hoc analysis revealed the same results of the ChR2 group differing from the control and eNpHR3 groups for both freezing (Tukey's multiple-comparisons test, ChR2 vs Control, p < 0.001; ChR2 vs eNpHR3, p < 0.001; Control vs eNpHR3, p = 0.995) and average speed (Tukey's multiple-comparisons test, ChR2 vs Control, p < 0.001; ChR2 vs eNpHR3, p < 0.001; Control vs eNpHR3, p = 0.392) to WN.
Overall, we found that exciting SOM+ CEA neurons in early extinction overrode the flight response with freezing, but this increased freezing did not persist throughout the session. This indicates that the extinction learning process still occurs while freezing is being expressed and that there is a timepoint within extinction where SOM-induced freezing is externally inhibited.
Unbalancing SOM+ CEA neuron activity reduces darting to WN in extinction
Next, we examined how escape jumping and darting responses were affected by SOM+ CEA neuron manipulation during extinction. Jumping to WN rarely occurred for the SOM-Cre mice (Fig. 6A; ChR2 total: 0; Control total: 3; eNpHR3 total: 1), and thus we could not perform a negative binomial generalized linear model analysis. We also found that the number of jumpers to WN between groups (# of jumpers to WN: ChR2: 0/10; Control: 1/10; eNpHR3: 1/9) did not differ (Fig. 6B; Fisher's exact test, ChR2 vs Control, p > 0.99; Control vs eNpHR3, p > 0.99; ChR2 vs eNpHR3, p = 0.473). In contrast, darting behavior was affected by group (Fig. 6C), with the control group (total: 62) darting much more throughout extinction than the other groups (ChR2 total: 5; eNpHR3 total: 13). However, the average WN-evoked darts of ChR2 and eNpHR3 groups did not differ from controls (Fig. 6D; negative binomial generalized linear model, ChR2 vs Control, β = 0.12, CI: −2.42 to 2.66, p = 0.93; eNpHR3 vs Control, β = 0.81, CI: −1.82 to 3.45, p = 0.55). When comparing the number of mice per group that darted to WN (# of darters to WN: ChR2: 2/10; Control: 8/10; eNpHR3: 8/9), the ChR2 group showed fewer darters to WN than the other two groups (Fisher's exact test, ChR2 vs Control, p = 0.023; ChR2 vs eNpHR3, p = 0.0055; Control vs eNpHR3, p > 0.99), indicating that activation may reduce darting through lowering its incidence, while inhibition may reduce darting through lowering the number of occurrences. Overall, both excitation and inhibition of SOM+ CEA neurons disrupted darting to WN, suggesting a regulatory role for SOM+ CEA activity in the expression of WN-induced darting.

Unbalancing SOM+ CEA neuron activity reduces darting to white noise in extinction. A, The cumulative distribution of jumps during the white noise (WN) period for all SOM-Cre groups, separated into 4-trial bins of Extinction. B, Comparison of total jumps per mouse from all WN periods of Extinction for all SOM-Cre groups. C, The cumulative distribution of darts during the WN period for all SOM-Cre groups, separated into 4-trial bins of Extinction. D, Comparison of total darts per mouse from all WN periods of Extinction for all SOM-Cre groups. ChR2: n = 10, Control: n = 10, eNpHR3: n = 9. Data from A and C are presented as raw numerical values. Data from B and D are presented as mean ± SEM and were analyzed with Fisher's exact test. *p < 0.05, **p < 0.01.
SOM+ CEA neuron manipulation during extinction has little effect on post-extinction freezing and speed
We next examined how SOM+ CEA neuron manipulation affected post-extinction recall behavior. Groups did not differ in tone-evoked freezing, neither during recall in the neutral context (Fig. 7A; one-way ANOVA, F(2,25) = 1.025, p = 0.373) nor in the conditioning context (Fig. 7B; one-way ANOVA, F(2,25) = 0.412, p = 0.667). Within the neutral context, we found a difference in WN-evoked freezing (Fig. 7C; one-way ANOVA, F(2,25) = 4.541, p = 0.373). The ChR2 group froze more to WN than the eNpHR3 group (Tukey's multiple-comparisons test, ChR2 vs eNpHR3, p = 0.018), but neither group significantly differed from the control group (Tukey's multiple-comparisons test, ChR2 vs Control, p = 0.117; Control vs eNpHR3, p = 0.616). All groups froze similarly to WN within the threat context (Fig. 7D; one-way ANOVA, F(2,25) = 0.669, p = 0.521). Speed during WN did not differ between groups for either the neutral (Fig. 7E; one-way ANOVA, F(2,25) = 0.69, p = 0.51) or the threat context (Fig. 7F; one-way ANOVA, F(2,25) = 0.446, p = 0.645). Lastly, we did not observe jumping to WN during Recall in either context, and darting to WN was minimal in both Recall1 (ChR2 total: 1; Control total: 4; eNpHR3 total: 3; # of darters to WN: ChR2: 1/9; Control: 2/10; eNpHR3: 1/9) and Recall2 (ChR2 total: 3; Control total: 14; eNpHR3 total: 2; # of darters to WN: ChR2: 3/9; Control: 6/10; eNpHR3: 2/9).

SOM+ CEA neuron manipulation during extinction has little effect on post-extinction freezing and speed. A, Comparison of average freezing during the tone period in the neutral context of Recall1 for all SOM-Cre groups. B, Comparison of average freezing during the tone period in the threat context of Recall2 for all SOM-Cre groups. C, Comparison of average freezing during the WN period in the neutral context of Recall1 for all SOM-Cre groups. D, Comparison of average freezing during the WN period in the threat context of Recall2 for all SOM-Cre groups. E, Comparison of average speed during the tone period in the neutral context of Recall1 for all SOM-Cre groups. F, Comparison of average speed during the WN period in the neutral context of Recall2 for all SOM-Cre groups. ChR2: n = 9, Control: n = 10, eNpHR3: n = 9. Data from all figures are presented as mean ± SEM and were analyzed with one-way ANOVA and Tukey's multiple-comparisons test. *p < 0.05.
In short, while we saw significant changes in behavior during extinction from SOM+ CEA neuron manipulation, there were virtually no subsequent effects on later defensive responses.
FISH analysis of colocalization of CRF+ and SOM+ CEA neurons
We assessed the penetrance and cell-type specificity of our viral vector targeting strategy within CRF-Cre and SOM-Cre mice (Fig. 8A) using fluorescent in situ hybridization (FISH) with CRF and SOM mRNAs as markers. Utilizing FISH along with EYFP-tagged viral vector expression in both groups, we visualized SOM+ neurons in CRF-Cre mice and CRF+ neurons in SOM-Cre mice (Fig. 8B) and compared each group's relative efficiency (%GFP+/marker-positive), specificity (%marker-positive/GFP+), and cross-lineage leakage (%marker-negative/GFP+) of virus/marker expression. The efficiency of our approach did not differ between groups (Fig. 8C; Mann–Whitney test, p = 0.121), with the median being 67.8% for CRF-Cre mice and 73.16% in SOM-Cre mice. Our approach's specificity displayed similar results (Fig. 8D; Mann–Whitney test, p = 0.955), with the median being 76.1% for CRF-Cre mice and 77.93% for SOM-Cre mice. Lastly, while low percentage-wise, we found a significant difference in cross-lineage leakage between groups (Fig. 8E; Mann–Whitney test, p = 0.0053), with the median being 0.6% for CRF-Cre mice and 1.23% for SOM-Cre mice. For this analysis, marker-negative cells were defined as the opposing marker for each group (i.e., SOM+ for CRF-Cre mice). Overall, we verified that our approach targeted a large majority of marker-positive CEA cells in each group, with little to no leakage into marker-positive neurons in the opposing group.

FISH analysis of colocalization of CRF+ and SOM+ CEA neurons. A, Viral vector targeting strategy for FISH of the CEA in CRF-Cre and SOM-Cre mice. Partially created with BioRender.com. B, Representative images of the CEA 3 weeks postinjection in CRF-Cre and SOM-Cre mice. Images above and below dotted line represent CRF-Cre and SOM-Cre groups, respectively. Biomarkers stained via FISH and immunohistochemistry are nuclei (blue), EYFP-tagged viral expression (green), CRF mRNA (magenta), and SOM mRNA (red). Scale bar represents 10 µm. C, Comparison of the efficiency of our viral vector targeting strategy between CRF-Cre and SOM-Cre mice. D, Comparison of the specificity of our viral vector targeting strategy between CRF-Cre and SOM-Cre mice. E, Comparison of the cross-lineage leakage of our viral vector targeting strategy between CRF-Cre and SOM-Cre mice. CRF-Cre: n = 7, SOM-Cre: n = 8. FISH, fluorescence in situ hybridization. Data for C–E are presented as median ± interquartile range and were analyzed with Mann–Whitney test. **p < 0.01.
Discussion
Freezing and flight vary based on incoming stimuli (Bolles, 1970) and neuronal recruitment (Fanselow, 1994). Freezing is a response to threat-signaling stimuli (Blanchard and Blanchard, 1969; Tovote et al., 2015) and transitions to flight as threat imminence increases (Perusini and Fanselow, 2015). Additionally, flight downscales to freezing as extinction alters stimuli's associative values (Le et al., 2024). These behaviors reflect different threat evaluation thresholds, and investigating their neuronal drivers can reveal targets for attenuating fear responses. The CEA modulates both conditioned freezing (Ciocchi et al., 2010; Haubensak et al., 2010) and flight (Totty et al., 2021) and directs these behaviors via competitive CRF+ and SOM+ interactions (Fadok et al., 2017). To determine if these populations also mediate extinction-dependent changes in defensive behavior, we explored how CRF+ and SOM+ CEA neurons direct WN-evoked freezing and flight within extinction of the conditioned flight paradigm. Overall, our findings (Fig. 9) highlight mechanisms of suppressing and downscaling defensive behaviors within early extinction through specific CEA population activity.

Summary figure of findings.
While CRF+ excitation reduces tone-evoked freezing within early extinction (Hartley et al., 2019), increases flight (Fadok et al., 2017), and increases post-extinction cued recall (Jo et al., 2020), we did not observe CRF+ excitation reducing freezing or increasing speed to WN during extinction (Fig. 2). This discrepancy could be explained by the WN stimulus inherently interrupting freezing (Hersman et al., 2020), thus decreasing CRF+ excitation's effect normally observed during tone. Alternatively, CRF+ activity could peak during WN presentation, removing additional stimulatory effect. Other findings show that postconditioning cued freezing is unaffected by overexpression or knockdown of CRF+ CEA neurons (Regev et al., 2012). CRF+ inhibition postacquisition reportedly reduces startle response (Demaestri et al., 2024) and defensive social flight (Robison et al., 2004), but not freezing to a CS (Demaestri et al., 2024) or context (Pitts et al., 2009). However, studies also report reduced cued freezing when inhibiting CRF+ during fear acquisition (Pitts et al., 2009; Asok et al., 2018), immediate extinction training (Hartley et al., 2019; Jo et al., 2020), or with 0.3 mA shocks (Sanford et al., 2017). Future studies investigating CRF+ CEA function may find changes in freezing or flight responses to WN with alternative stimulation timings or less severe US intensity.
While CRF+ excitation did not increase WN-evoked escape jumping during extinction, CRF+ inhibition vastly reduced jumping (Fig. 3). Jumps in the non-eNpHR3 groups spiked early and diminished quickly, as previously observed (Le et al., 2024). While other groups maintained darting, the eNpHR3 group displayed reduced darting early and increased over extinction. This suggests that CRF+ inhibition suppresses both jumping and darting in early extinction, but darting in late extinction may recruit an alternate region. CRF+ inhibition in socially defeated mice reduces defensive flight from intruder mice (Robison et al., 2004). Additionally, high-avoidance rats display increased CRF+ CEA activity (Wiersma et al., 1998), while CRF+ inhibition reduces predator odor avoidance (Weera et al., 2020). Thus, CRF+ CEA neurons may drive escape or avoidance behaviors to learned threat until extinction learning takes place.
During Recall, we found no effects of CRF+ excitation or inhibition on any defensive behavior in either context (Fig. 4). Given that jumping and darting mostly ceased by Day 5, WN likely no longer predicted imminent threat. Interestingly, we found reduced tone-evoked freezing from the eNpHR3 group within the threat context. CRF+ inhibition has been shown to improve spatial discrimination (Paretkar and Dimitrov, 2018), attenuate anxiety and stress responses (Regev et al., 2012), and diminish both cued and contextual fear retrieval (Pomrenze et al., 2019), which could explain the eNpHR3 group's improved tone performance in the threat context, where extinction took place. Despite this, the WN response remained unattenuated after CRF+ inhibition. One explanation is that the WN's greater salience and closer associative proximity to threat slows downscaling of defensive responses to WN compared with tone, as observed previously (Le et al., 2024).
In early extinction, SOM+ activation heavily increased freezing and lowered speed to WN (Fig. 5), matching findings showing SOM+ excitation promotes conditioned immobility and freezing (Yu et al., 2016; Fadok et al., 2017). Additionally, this increased freezing was not consistent, suggesting that SOM+ inhibition and alternative neuronal recruitment (Hartley et al., 2019) were driving extinction learning. These findings indicate that within early extinction, SOM+ CEA excitation can suppress flight.
We found no consistent escape jumping from any SOM-Cre group (Fig. 6A). We attribute this to a potential strain-specific effect, as CRF-Cre control mice jumped to WN. Both the ChR2 and eNpHR3 groups showed reduced WN-evoked darting, while the Control group darted regularly (Fig. 6C). Specifically, the ChR2 group displayed fewer mice that darted, while the eNpHR3 group displayed fewer darting occurrences. These findings imply darting requires a regulation of SOM+ activity, as SOM+ recruitment drives conditioned freezing (Hartley et al., 2019), and SOM+ disruption promotes active avoidance (Yu et al., 2016). SOM+ CEA subpopulations can encode representations of stimuli with contrasting valences and physical properties (Yang et al., 2023), so it is unclear if the ChR2 and eNpHR3 groups’ reduced darting is due to differences in aversive learning or perceived stimulus salience (Hartley et al., 2019; Yang et al., 2023). While most research ties SOM+ CEA activity to conditioned freezing (Li et al., 2013; Hartley et al., 2019; Giovanniello et al., 2020; Hou et al., 2024), these findings promote further investigation of SOM-dependent mechanisms of associative darting. If SOM+ CEA neurons can direct defensive responses below the jumping threshold like freezing and darting, then they could help promote downscaled fear responses during extinction and facilitate recovery.
During Recall, freezing or speed to SCS did not differ (Fig. 7), indicating that ChR2-induced freezing did not affect fear extinction efficacy. This matches reports that extinction training recruits SOM-negative neurons (Hartley et al., 2019), likely CRF+ neurons. While ChR2 and eNpHR3 groups differed in WN-evoked freezing in the neutral context (Fig. 7C), neither differed from the control group, thus implicating behavioral variability. Lastly, ChR2-induced freezing did not associatively affect tone response as observed in CRF-Cre groups.
CRF+ neurons project onto SOM+ neurons (Fadok et al., 2017), and both colocalize within the lateral CEA (McCullough et al., 2018), implying our manipulation of CRF+ neurons could also target SOM+ cells and influence freezing or jumping. Thus, we utilized FISH to determine the cell-specificity and penetrance of our approach (Fig. 8). We did not find differences in transfection efficiency or specificity within either mouse line (Fig. 8C,D), and though we found differences in cross-lineage leakage, both were below 5% (Fig. 8E). Thus, off-target populations were likely unaffected. While our targeting locations matched documented colocalization coordinates of CRF+ and SOM+ neurons (McCullough et al., 2018), our lack of coexpression indicates that our approach likely ignores these cells. Our separate jumping and freezing effects imply that colocalized neurons do not override the activity of single-marker-positive cells. CRF+ and SOM+ amygdala neurons are differentially recruited for fear acquisition and extinction (Hartley et al., 2019), so these colocalized neurons may instead drive innate unpaired fear responses.
Overall, we showcase CEA-dependent behavioral modulation that ameliorates fear responses during fear extinction. With these findings, we propose that during extinction in the conditioned flight paradigm, CRF+ and SOM+ CEA neurons compete to influence freezing, darting, and jumping behaviors that are expressed at different threat evaluation thresholds (Le et al., 2024). CRF+ signaling drives escape jumping but not darting; SOM+ signaling promotes freezing and regulates darting. During extinction, CRF+ signaling is inhibited during WN presentation, potentially through SOM+ neuron recruitment. This interpretation is feasible, given that darting continues within extinction while jumping does not (Le et al., 2024). Just as CRF+ and SOM+ activity drives conditioned freezing and flight (Fadok et al., 2017), we propose that a similar interaction drives defensive adjustments within complex fear extinction. Uncovering new mechanisms of dynamic defensive regulation will help facilitate fear extinction for PTSD victims, who have trouble extinguishing learned fear (Wessa and Flor, 2007). Given our findings, CRF+ inhibition and SOM+ excitation in the CEA during early extinction could attenuate defensive behaviors in extinction-based treatments like exposure therapy, assisting the recovery to daily life.
Future studies can explore downstream targets of CRF+ inhibition and SOM+ excitation to promote defensive behavior downscaling and facilitate extinction, such as the locus ceruleus (Paretkar and Dimitrov, 2018; Shang et al., 2023), bed nucleus of stria terminalis (Asok et al., 2018; Pomrenze et al., 2019), lateral hypothalamus (Weera et al., 2023), central sublenticular extended amygdala (Sun et al., 2023), periacqueductal gray (Borkar et al., 2024), and local CEA projections (Fadok et al., 2017; Sanford et al., 2017). Possible upstream SOM+ CEA connections behind defensive modulation and associative darting include the bed nucleus of stria terminalis (Teng et al., 2025), basolateral amygdala (Massi et al., 2023), dorsal peduncular nucleus (Borkar et al., 2024), and other lateral CEA neurons (Penzo et al., 2015; Hunt et al., 2017; Hou et al., 2024). Lastly, stimulating during the tone-WN or WN-shock transitions and using dual-channel optogenetics (Cai et al., 2022) can elucidate temporal dynamics of extinction-dependent behavioral changes from CRF+ and SOM+ competition.
Footnotes
- Received May 28, 2025.
- Revision received January 21, 2026.
- Accepted February 21, 2026.
-
This study was supported by the National Institutes of Health under award number R01 MH122561 and by Merit Award I01 BX006434 from the United States Department of Veterans Affairs, Biomedical Laboratory Research and Development Service to J.P.F. The content is solely the responsibility of the authors and does not necessarily represent the official views of the National Institutes of Health.
-
The authors declare no competing financial interests.
- Correspondence should be addressed to Jonathan P. Fadok at jfadok{at}tulane.edu.
- Copyright © 2026 the authors




